Zip Codes with the Highest Percentage of Population Employed in Accommodation & Food Services in Woodstock, GA
RELATED REPORTS & OPTIONS
Accommodation & Food Services
Woodstock
Compare Zip Codes
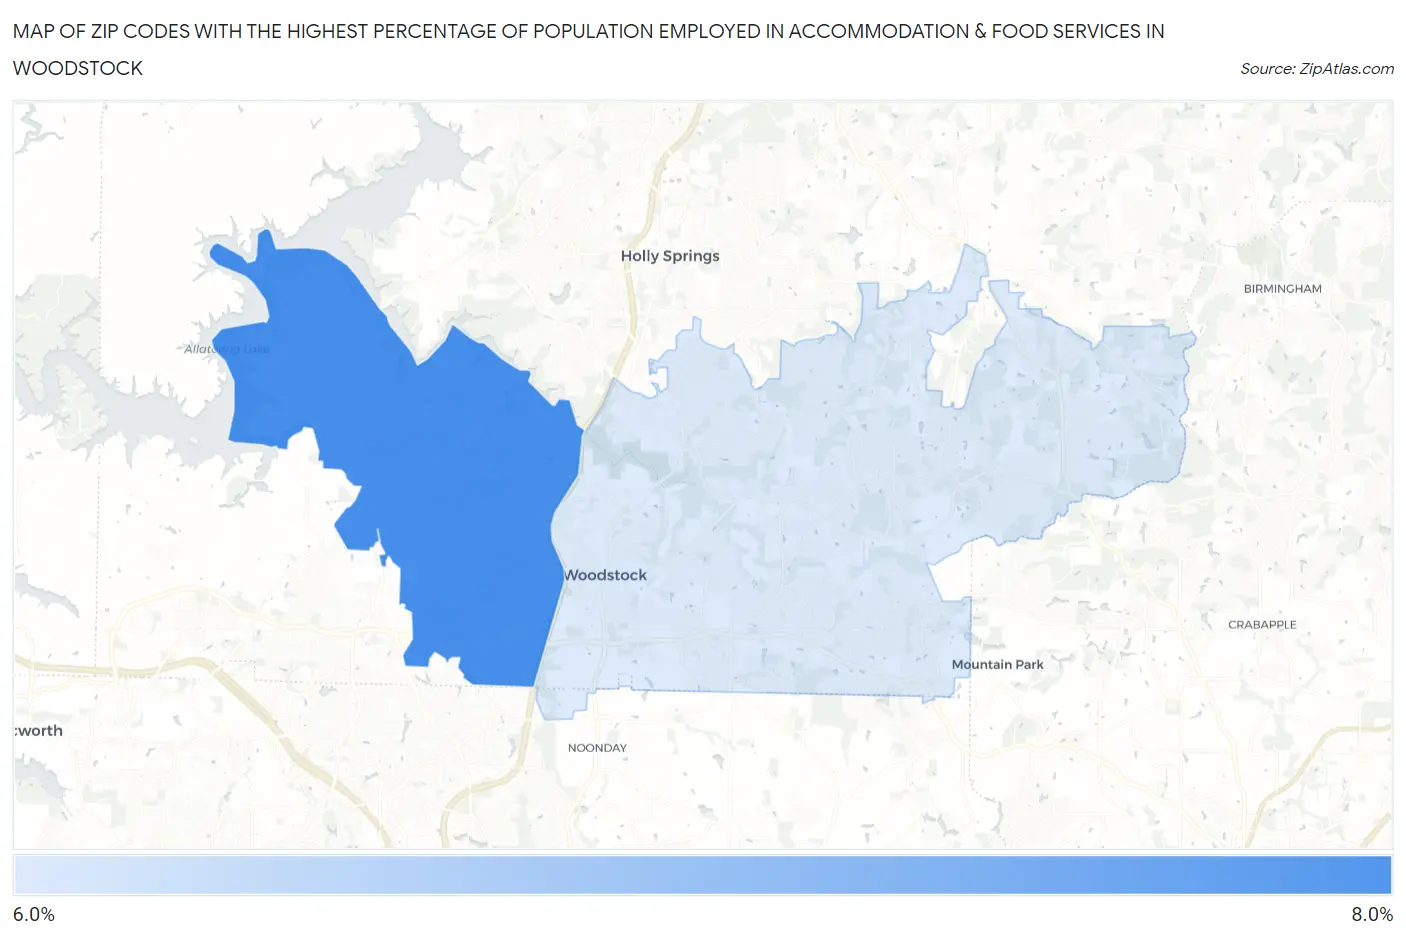
Map of Zip Codes with the Highest Percentage of Population Employed in Accommodation & Food Services in Woodstock
6.4%
7.7%
Zip Codes with the Highest Percentage of Population Employed in Accommodation & Food Services in Woodstock, GA
| Zip Code | % Employed | vs State | vs National | |
| 1. | 30189 | 7.7% | 7.2%(+0.446)#221 | 6.9%(+0.772)#8,618 |
| 2. | 30188 | 6.4% | 7.2%(-0.819)#335 | 6.9%(-0.494)#12,201 |
1
Common Questions
What are the Top Zip Codes with the Highest Percentage of Population Employed in Accommodation & Food Services in Woodstock, GA?
Top Zip Codes with the Highest Percentage of Population Employed in Accommodation & Food Services in Woodstock, GA are:
What zip code has the Highest Percentage of Population Employed in Accommodation & Food Services in Woodstock, GA?
30189 has the Highest Percentage of Population Employed in Accommodation & Food Services in Woodstock, GA with 7.7%.
What is the Percentage of Population Employed in Accommodation & Food Services in Woodstock, GA?
Percentage of Population Employed in Accommodation & Food Services in Woodstock is 7.4%.
What is the Percentage of Population Employed in Accommodation & Food Services in Georgia?
Percentage of Population Employed in Accommodation & Food Services in Georgia is 7.2%.
What is the Percentage of Population Employed in Accommodation & Food Services in the United States?
Percentage of Population Employed in Accommodation & Food Services in the United States is 6.9%.