Puget Sound Salish vs Cambodian Disability Age Under 5
COMPARE
Puget Sound Salish
Cambodian
Disability Age Under 5
Disability Age Under 5 Comparison
Puget Sound Salish
Cambodians
0.97%
DISABILITY AGE UNDER 5
100.0/ 100
METRIC RATING
19th/ 347
METRIC RANK
1.2%
DISABILITY AGE UNDER 5
95.4/ 100
METRIC RATING
106th/ 347
METRIC RANK
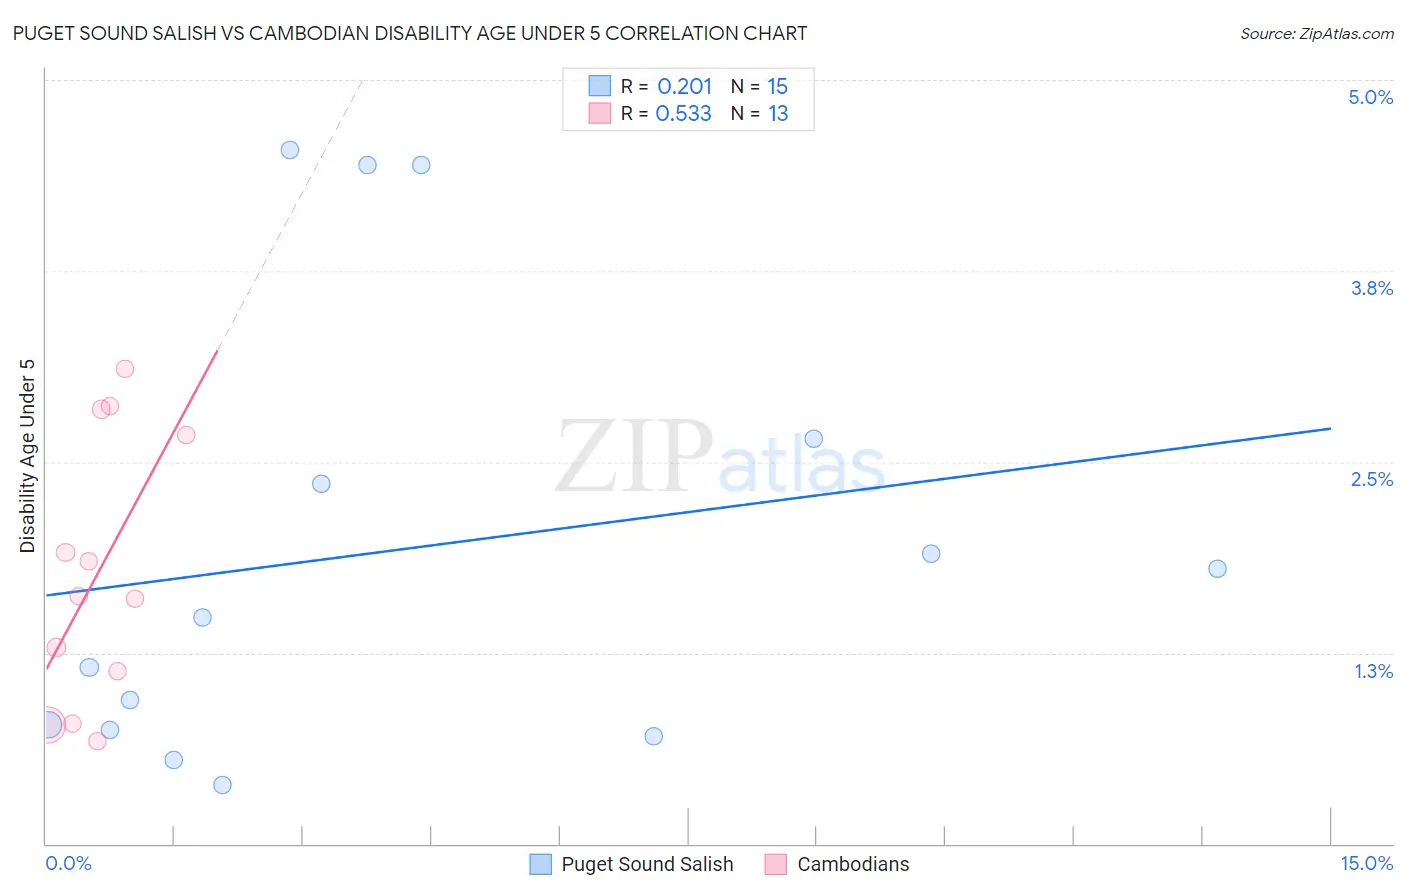
Puget Sound Salish vs Cambodian Disability Age Under 5 Correlation Chart
The statistical analysis conducted on geographies consisting of 36,173,931 people shows a weak positive correlation between the proportion of Puget Sound Salish and percentage of population with a disability under the age of 5 in the United States with a correlation coefficient (R) of 0.201 and weighted average of 0.97%. Similarly, the statistical analysis conducted on geographies consisting of 77,498,292 people shows a substantial positive correlation between the proportion of Cambodians and percentage of population with a disability under the age of 5 in the United States with a correlation coefficient (R) of 0.533 and weighted average of 1.2%, a difference of 18.8%.
Disability Age Under 5 Correlation Summary
| Measurement | Puget Sound Salish | Cambodian |
| Minimum | 0.38% | 0.67% |
| Maximum | 4.5% | 3.1% |
| Range | 4.2% | 2.4% |
| Mean | 1.9% | 1.8% |
| Median | 1.5% | 1.6% |
| Interquartile 25% (IQ1) | 0.75% | 0.96% |
| Interquartile 75% (IQ3) | 2.7% | 2.8% |
| Interquartile Range (IQR) | 1.9% | 1.8% |
| Standard Deviation (Sample) | 1.5% | 0.86% |
| Standard Deviation (Population) | 1.4% | 0.82% |
Similar Demographics by Disability Age Under 5
Demographics Similar to Puget Sound Salish by Disability Age Under 5
In terms of disability age under 5, the demographic groups most similar to Puget Sound Salish are Nepalese (0.97%, a difference of 0.10%), Immigrants from Barbados (0.97%, a difference of 0.37%), Immigrants from China (0.96%, a difference of 0.95%), Immigrants from Israel (0.96%, a difference of 1.4%), and British West Indian (0.99%, a difference of 1.9%).
| Demographics | Rating | Rank | Disability Age Under 5 |
| Immigrants | Grenada | 100.0 /100 | #12 | Exceptional 0.94% |
| Soviet Union | 100.0 /100 | #13 | Exceptional 0.95% |
| Yuman | 100.0 /100 | #14 | Exceptional 0.95% |
| Immigrants | Hong Kong | 100.0 /100 | #15 | Exceptional 0.95% |
| Immigrants | Israel | 100.0 /100 | #16 | Exceptional 0.96% |
| Immigrants | China | 100.0 /100 | #17 | Exceptional 0.96% |
| Immigrants | Barbados | 100.0 /100 | #18 | Exceptional 0.97% |
| Puget Sound Salish | 100.0 /100 | #19 | Exceptional 0.97% |
| Nepalese | 100.0 /100 | #20 | Exceptional 0.97% |
| British West Indians | 100.0 /100 | #21 | Exceptional 0.99% |
| Immigrants | Iran | 100.0 /100 | #22 | Exceptional 1.00% |
| Yakama | 100.0 /100 | #23 | Exceptional 1.00% |
| Indians (Asian) | 100.0 /100 | #24 | Exceptional 1.0% |
| Immigrants | Micronesia | 100.0 /100 | #25 | Exceptional 1.0% |
| Immigrants | Taiwan | 100.0 /100 | #26 | Exceptional 1.0% |
Demographics Similar to Cambodians by Disability Age Under 5
In terms of disability age under 5, the demographic groups most similar to Cambodians are Immigrants from West Indies (1.2%, a difference of 0.040%), Immigrants from South Africa (1.2%, a difference of 0.10%), Iraqi (1.2%, a difference of 0.17%), Immigrants from Panama (1.2%, a difference of 0.19%), and Immigrants from Lebanon (1.2%, a difference of 0.21%).
| Demographics | Rating | Rank | Disability Age Under 5 |
| Dominicans | 96.3 /100 | #99 | Exceptional 1.1% |
| Nicaraguans | 96.3 /100 | #100 | Exceptional 1.1% |
| Immigrants | Uganda | 96.1 /100 | #101 | Exceptional 1.1% |
| Immigrants | Morocco | 96.0 /100 | #102 | Exceptional 1.2% |
| Immigrants | Nicaragua | 96.0 /100 | #103 | Exceptional 1.2% |
| Indonesians | 95.9 /100 | #104 | Exceptional 1.2% |
| Immigrants | South Africa | 95.6 /100 | #105 | Exceptional 1.2% |
| Cambodians | 95.4 /100 | #106 | Exceptional 1.2% |
| Immigrants | West Indies | 95.3 /100 | #107 | Exceptional 1.2% |
| Iraqis | 95.1 /100 | #108 | Exceptional 1.2% |
| Immigrants | Panama | 95.0 /100 | #109 | Exceptional 1.2% |
| Immigrants | Lebanon | 95.0 /100 | #110 | Exceptional 1.2% |
| Senegalese | 94.6 /100 | #111 | Exceptional 1.2% |
| Immigrants | Australia | 94.4 /100 | #112 | Exceptional 1.2% |
| Immigrants | Oceania | 94.2 /100 | #113 | Exceptional 1.2% |