Puget Sound Salish vs Yup'ik Disability Age Under 5
COMPARE
Puget Sound Salish
Yup'ik
Disability Age Under 5
Disability Age Under 5 Comparison
Puget Sound Salish
Yup'ik
0.97%
DISABILITY AGE UNDER 5
100.0/ 100
METRIC RATING
19th/ 347
METRIC RANK
4.5%
DISABILITY AGE UNDER 5
0.0/ 100
METRIC RATING
346th/ 347
METRIC RANK
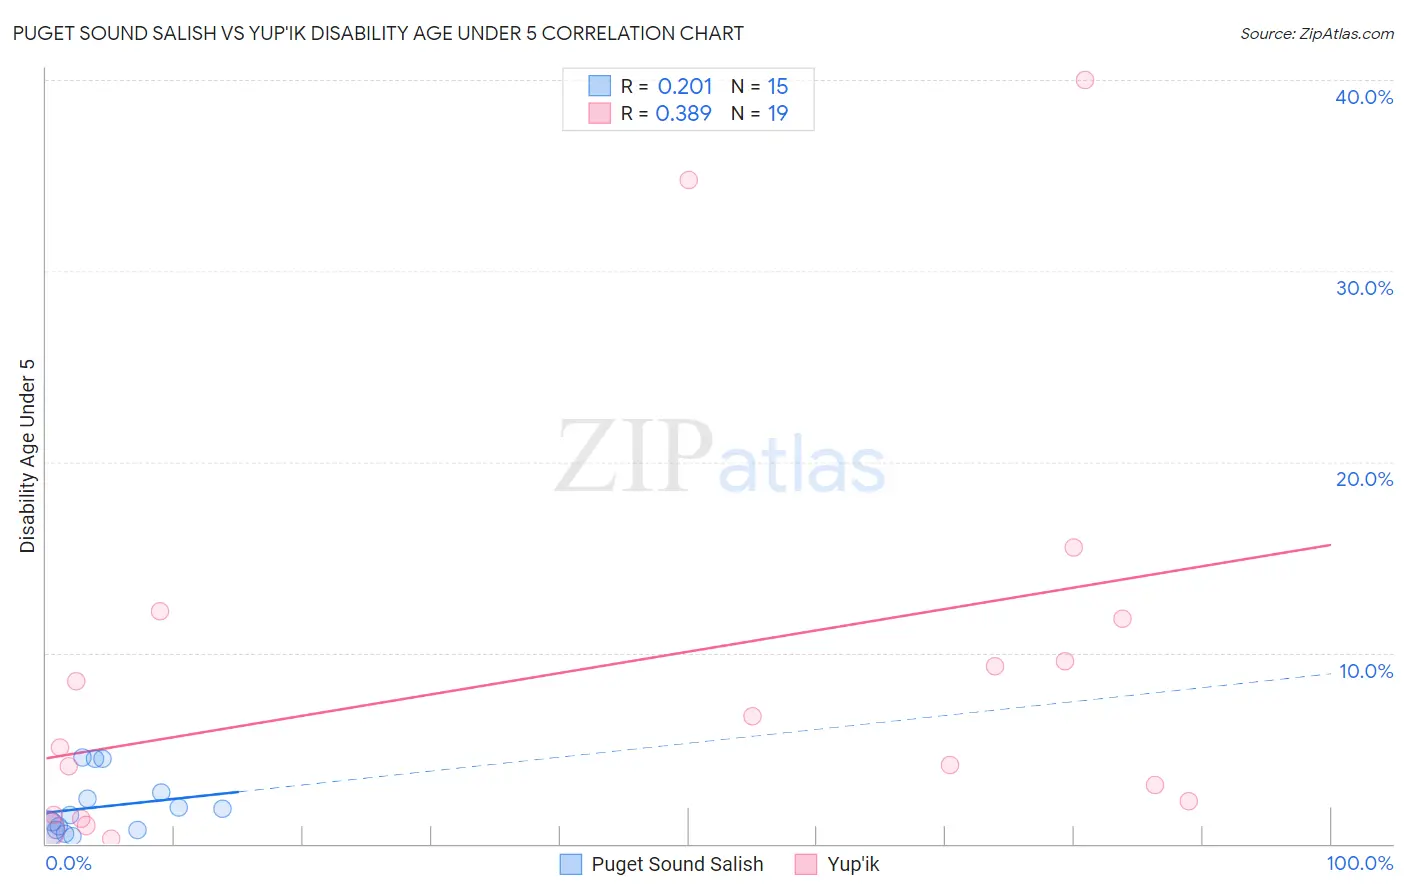
Puget Sound Salish vs Yup'ik Disability Age Under 5 Correlation Chart
The statistical analysis conducted on geographies consisting of 36,173,931 people shows a weak positive correlation between the proportion of Puget Sound Salish and percentage of population with a disability under the age of 5 in the United States with a correlation coefficient (R) of 0.201 and weighted average of 0.97%. Similarly, the statistical analysis conducted on geographies consisting of 34,357,684 people shows a mild positive correlation between the proportion of Yup'ik and percentage of population with a disability under the age of 5 in the United States with a correlation coefficient (R) of 0.389 and weighted average of 4.5%, a difference of 365.6%.
Disability Age Under 5 Correlation Summary
| Measurement | Puget Sound Salish | Yup'ik |
| Minimum | 0.38% | 0.26% |
| Maximum | 4.5% | 40.0% |
| Range | 4.2% | 39.7% |
| Mean | 1.9% | 9.0% |
| Median | 1.5% | 5.1% |
| Interquartile 25% (IQ1) | 0.75% | 1.5% |
| Interquartile 75% (IQ3) | 2.7% | 11.8% |
| Interquartile Range (IQR) | 1.9% | 10.2% |
| Standard Deviation (Sample) | 1.5% | 11.0% |
| Standard Deviation (Population) | 1.4% | 10.7% |
Similar Demographics by Disability Age Under 5
Demographics Similar to Puget Sound Salish by Disability Age Under 5
In terms of disability age under 5, the demographic groups most similar to Puget Sound Salish are Nepalese (0.97%, a difference of 0.10%), Immigrants from Barbados (0.97%, a difference of 0.37%), Immigrants from China (0.96%, a difference of 0.95%), Immigrants from Israel (0.96%, a difference of 1.4%), and British West Indian (0.99%, a difference of 1.9%).
| Demographics | Rating | Rank | Disability Age Under 5 |
| Immigrants | Grenada | 100.0 /100 | #12 | Exceptional 0.94% |
| Soviet Union | 100.0 /100 | #13 | Exceptional 0.95% |
| Yuman | 100.0 /100 | #14 | Exceptional 0.95% |
| Immigrants | Hong Kong | 100.0 /100 | #15 | Exceptional 0.95% |
| Immigrants | Israel | 100.0 /100 | #16 | Exceptional 0.96% |
| Immigrants | China | 100.0 /100 | #17 | Exceptional 0.96% |
| Immigrants | Barbados | 100.0 /100 | #18 | Exceptional 0.97% |
| Puget Sound Salish | 100.0 /100 | #19 | Exceptional 0.97% |
| Nepalese | 100.0 /100 | #20 | Exceptional 0.97% |
| British West Indians | 100.0 /100 | #21 | Exceptional 0.99% |
| Immigrants | Iran | 100.0 /100 | #22 | Exceptional 1.00% |
| Yakama | 100.0 /100 | #23 | Exceptional 1.00% |
| Indians (Asian) | 100.0 /100 | #24 | Exceptional 1.0% |
| Immigrants | Micronesia | 100.0 /100 | #25 | Exceptional 1.0% |
| Immigrants | Taiwan | 100.0 /100 | #26 | Exceptional 1.0% |
Demographics Similar to Yup'ik by Disability Age Under 5
In terms of disability age under 5, the demographic groups most similar to Yup'ik are Hopi (4.6%, a difference of 2.3%), Paiute (3.9%, a difference of 15.8%), Inupiat (3.7%, a difference of 22.0%), Colville (3.3%, a difference of 37.8%), and Alaska Native (2.9%, a difference of 53.8%).
| Demographics | Rating | Rank | Disability Age Under 5 |
| Dutch West Indians | 0.0 /100 | #333 | Tragic 1.9% |
| Natives/Alaskans | 0.0 /100 | #334 | Tragic 1.9% |
| Pennsylvania Germans | 0.0 /100 | #335 | Tragic 1.9% |
| Paraguayans | 0.0 /100 | #336 | Tragic 2.0% |
| Apache | 0.0 /100 | #337 | Tragic 2.0% |
| Tohono O'odham | 0.0 /100 | #338 | Tragic 2.2% |
| Immigrants | Azores | 0.0 /100 | #339 | Tragic 2.2% |
| Menominee | 0.0 /100 | #340 | Tragic 2.3% |
| Tsimshian | 0.0 /100 | #341 | Tragic 2.4% |
| Alaska Natives | 0.0 /100 | #342 | Tragic 2.9% |
| Colville | 0.0 /100 | #343 | Tragic 3.3% |
| Inupiat | 0.0 /100 | #344 | Tragic 3.7% |
| Paiute | 0.0 /100 | #345 | Tragic 3.9% |
| Yup'ik | 0.0 /100 | #346 | Tragic 4.5% |
| Hopi | 0.0 /100 | #347 | Tragic 4.6% |