Immigrants from Trinidad and Tobago vs European Disability Age Under 5
COMPARE
Immigrants from Trinidad and Tobago
European
Disability Age Under 5
Disability Age Under 5 Comparison
Immigrants from Trinidad and Tobago
Europeans
1.1%
DISABILITY AGE UNDER 5
98.0/ 100
METRIC RATING
80th/ 347
METRIC RANK
1.5%
DISABILITY AGE UNDER 5
0.0/ 100
METRIC RATING
284th/ 347
METRIC RANK
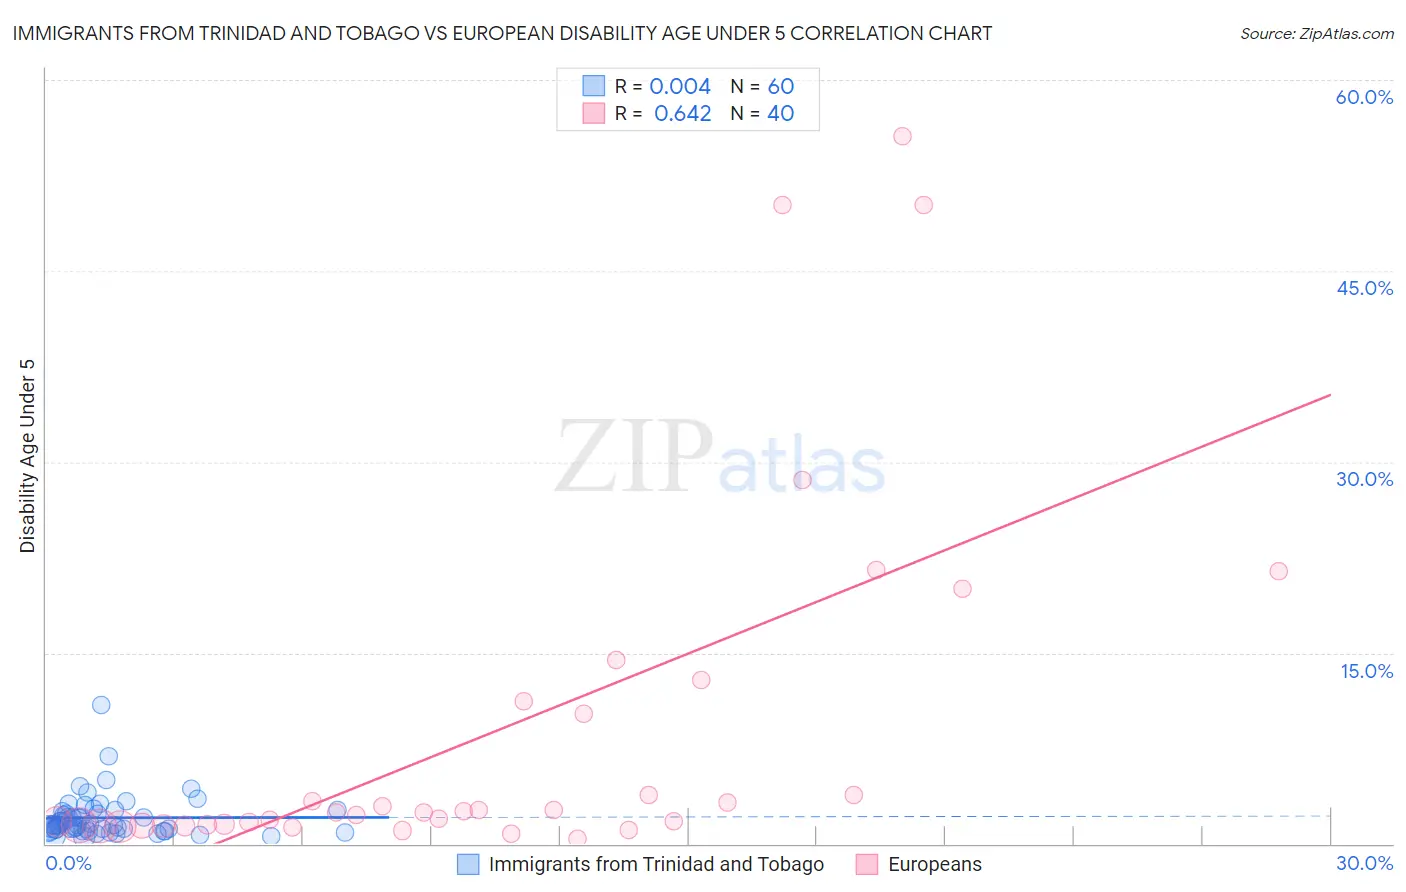
Immigrants from Trinidad and Tobago vs European Disability Age Under 5 Correlation Chart
The statistical analysis conducted on geographies consisting of 139,979,956 people shows no correlation between the proportion of Immigrants from Trinidad and Tobago and percentage of population with a disability under the age of 5 in the United States with a correlation coefficient (R) of 0.004 and weighted average of 1.1%. Similarly, the statistical analysis conducted on geographies consisting of 258,994,834 people shows a significant positive correlation between the proportion of Europeans and percentage of population with a disability under the age of 5 in the United States with a correlation coefficient (R) of 0.642 and weighted average of 1.5%, a difference of 34.5%.
Disability Age Under 5 Correlation Summary
| Measurement | Immigrants from Trinidad and Tobago | European |
| Minimum | 0.53% | 0.42% |
| Maximum | 10.9% | 55.6% |
| Range | 10.3% | 55.1% |
| Mean | 2.0% | 8.8% |
| Median | 1.5% | 2.4% |
| Interquartile 25% (IQ1) | 1.1% | 1.4% |
| Interquartile 75% (IQ3) | 2.5% | 10.7% |
| Interquartile Range (IQR) | 1.4% | 9.2% |
| Standard Deviation (Sample) | 1.7% | 14.2% |
| Standard Deviation (Population) | 1.7% | 14.0% |
Similar Demographics by Disability Age Under 5
Demographics Similar to Immigrants from Trinidad and Tobago by Disability Age Under 5
In terms of disability age under 5, the demographic groups most similar to Immigrants from Trinidad and Tobago are Hmong (1.1%, a difference of 0.020%), Turkish (1.1%, a difference of 0.020%), West Indian (1.1%, a difference of 0.040%), Immigrants from Jordan (1.1%, a difference of 0.13%), and Immigrants from Syria (1.1%, a difference of 0.14%).
| Demographics | Rating | Rank | Disability Age Under 5 |
| Immigrants | Sri Lanka | 98.5 /100 | #73 | Exceptional 1.1% |
| Jordanians | 98.5 /100 | #74 | Exceptional 1.1% |
| Immigrants | Pakistan | 98.4 /100 | #75 | Exceptional 1.1% |
| Immigrants | Burma/Myanmar | 98.2 /100 | #76 | Exceptional 1.1% |
| Immigrants | Denmark | 98.1 /100 | #77 | Exceptional 1.1% |
| West Indians | 98.0 /100 | #78 | Exceptional 1.1% |
| Hmong | 98.0 /100 | #79 | Exceptional 1.1% |
| Immigrants | Trinidad and Tobago | 98.0 /100 | #80 | Exceptional 1.1% |
| Turks | 98.0 /100 | #81 | Exceptional 1.1% |
| Immigrants | Jordan | 97.9 /100 | #82 | Exceptional 1.1% |
| Immigrants | Syria | 97.9 /100 | #83 | Exceptional 1.1% |
| Immigrants | Zaire | 97.8 /100 | #84 | Exceptional 1.1% |
| Sudanese | 97.7 /100 | #85 | Exceptional 1.1% |
| Okinawans | 97.6 /100 | #86 | Exceptional 1.1% |
| Ugandans | 97.5 /100 | #87 | Exceptional 1.1% |
Demographics Similar to Europeans by Disability Age Under 5
In terms of disability age under 5, the demographic groups most similar to Europeans are Delaware (1.5%, a difference of 0.050%), Cheyenne (1.5%, a difference of 0.25%), Czechoslovakian (1.5%, a difference of 0.59%), Croatian (1.5%, a difference of 1.2%), and Tlingit-Haida (1.5%, a difference of 1.4%).
| Demographics | Rating | Rank | Disability Age Under 5 |
| Canadians | 0.0 /100 | #277 | Tragic 1.5% |
| Kiowa | 0.0 /100 | #278 | Tragic 1.5% |
| Danes | 0.0 /100 | #279 | Tragic 1.5% |
| British | 0.0 /100 | #280 | Tragic 1.5% |
| Czechoslovakians | 0.0 /100 | #281 | Tragic 1.5% |
| Cheyenne | 0.0 /100 | #282 | Tragic 1.5% |
| Delaware | 0.0 /100 | #283 | Tragic 1.5% |
| Europeans | 0.0 /100 | #284 | Tragic 1.5% |
| Croatians | 0.0 /100 | #285 | Tragic 1.5% |
| Tlingit-Haida | 0.0 /100 | #286 | Tragic 1.5% |
| Scandinavians | 0.0 /100 | #287 | Tragic 1.5% |
| Estonians | 0.0 /100 | #288 | Tragic 1.5% |
| Hungarians | 0.0 /100 | #289 | Tragic 1.5% |
| Czechs | 0.0 /100 | #290 | Tragic 1.5% |
| Northern Europeans | 0.0 /100 | #291 | Tragic 1.6% |