Immigrants from Afghanistan vs Immigrants from Korea Disability Age Under 5
COMPARE
Immigrants from Afghanistan
Immigrants from Korea
Disability Age Under 5
Disability Age Under 5 Comparison
Immigrants from Afghanistan
Immigrants from Korea
0.91%
DISABILITY AGE UNDER 5
100.0/ 100
METRIC RATING
7th/ 347
METRIC RANK
1.1%
DISABILITY AGE UNDER 5
98.8/ 100
METRIC RATING
65th/ 347
METRIC RANK
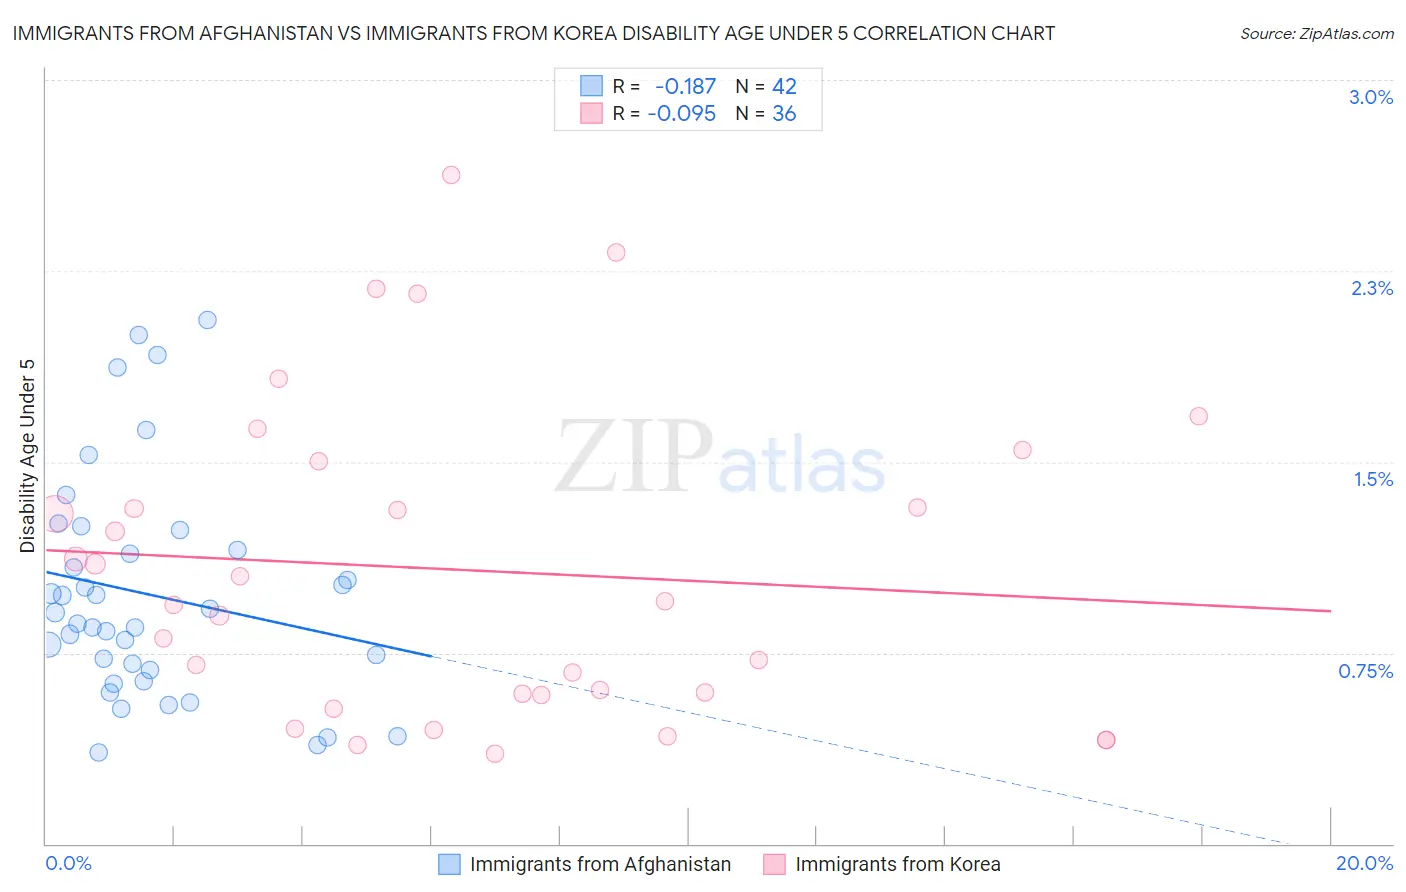
Immigrants from Afghanistan vs Immigrants from Korea Disability Age Under 5 Correlation Chart
The statistical analysis conducted on geographies consisting of 107,593,919 people shows a poor negative correlation between the proportion of Immigrants from Afghanistan and percentage of population with a disability under the age of 5 in the United States with a correlation coefficient (R) of -0.187 and weighted average of 0.91%. Similarly, the statistical analysis conducted on geographies consisting of 221,993,484 people shows a slight negative correlation between the proportion of Immigrants from Korea and percentage of population with a disability under the age of 5 in the United States with a correlation coefficient (R) of -0.095 and weighted average of 1.1%, a difference of 23.2%.
Disability Age Under 5 Correlation Summary
| Measurement | Immigrants from Afghanistan | Immigrants from Korea |
| Minimum | 0.36% | 0.35% |
| Maximum | 2.1% | 2.6% |
| Range | 1.7% | 2.3% |
| Mean | 0.98% | 1.1% |
| Median | 0.88% | 0.95% |
| Interquartile 25% (IQ1) | 0.68% | 0.59% |
| Interquartile 75% (IQ3) | 1.2% | 1.4% |
| Interquartile Range (IQR) | 0.47% | 0.82% |
| Standard Deviation (Sample) | 0.44% | 0.61% |
| Standard Deviation (Population) | 0.43% | 0.60% |
Similar Demographics by Disability Age Under 5
Demographics Similar to Immigrants from Afghanistan by Disability Age Under 5
In terms of disability age under 5, the demographic groups most similar to Immigrants from Afghanistan are Immigrants from Yemen (0.91%, a difference of 0.13%), Immigrants from Fiji (0.92%, a difference of 1.2%), Marshallese (0.94%, a difference of 3.4%), Afghan (0.94%, a difference of 4.1%), and Immigrants from Grenada (0.94%, a difference of 4.2%).
| Demographics | Rating | Rank | Disability Age Under 5 |
| Immigrants | Armenia | 100.0 /100 | #1 | Exceptional 0.76% |
| Immigrants | St. Vincent and the Grenadines | 100.0 /100 | #2 | Exceptional 0.79% |
| Vietnamese | 100.0 /100 | #3 | Exceptional 0.81% |
| Immigrants | Uzbekistan | 100.0 /100 | #4 | Exceptional 0.85% |
| Immigrants | Bangladesh | 100.0 /100 | #5 | Exceptional 0.85% |
| Ute | 100.0 /100 | #6 | Exceptional 0.86% |
| Immigrants | Afghanistan | 100.0 /100 | #7 | Exceptional 0.91% |
| Immigrants | Yemen | 100.0 /100 | #8 | Exceptional 0.91% |
| Immigrants | Fiji | 100.0 /100 | #9 | Exceptional 0.92% |
| Marshallese | 100.0 /100 | #10 | Exceptional 0.94% |
| Afghans | 100.0 /100 | #11 | Exceptional 0.94% |
| Immigrants | Grenada | 100.0 /100 | #12 | Exceptional 0.94% |
| Soviet Union | 100.0 /100 | #13 | Exceptional 0.95% |
| Yuman | 100.0 /100 | #14 | Exceptional 0.95% |
| Immigrants | Hong Kong | 100.0 /100 | #15 | Exceptional 0.95% |
Demographics Similar to Immigrants from Korea by Disability Age Under 5
In terms of disability age under 5, the demographic groups most similar to Immigrants from Korea are Immigrants from Indonesia (1.1%, a difference of 0.13%), Immigrants from Belize (1.1%, a difference of 0.19%), South African (1.1%, a difference of 0.23%), Israeli (1.1%, a difference of 0.26%), and Egyptian (1.1%, a difference of 0.34%).
| Demographics | Rating | Rank | Disability Age Under 5 |
| Immigrants | Egypt | 99.4 /100 | #58 | Exceptional 1.1% |
| Immigrants | Malaysia | 99.4 /100 | #59 | Exceptional 1.1% |
| Immigrants | Western Asia | 99.2 /100 | #60 | Exceptional 1.1% |
| Immigrants | Ethiopia | 99.2 /100 | #61 | Exceptional 1.1% |
| Immigrants | Switzerland | 99.2 /100 | #62 | Exceptional 1.1% |
| Immigrants | Vietnam | 99.1 /100 | #63 | Exceptional 1.1% |
| Egyptians | 98.9 /100 | #64 | Exceptional 1.1% |
| Immigrants | Korea | 98.8 /100 | #65 | Exceptional 1.1% |
| Immigrants | Indonesia | 98.7 /100 | #66 | Exceptional 1.1% |
| Immigrants | Belize | 98.7 /100 | #67 | Exceptional 1.1% |
| South Africans | 98.7 /100 | #68 | Exceptional 1.1% |
| Israelis | 98.7 /100 | #69 | Exceptional 1.1% |
| Immigrants | Ecuador | 98.6 /100 | #70 | Exceptional 1.1% |
| Trinidadians and Tobagonians | 98.6 /100 | #71 | Exceptional 1.1% |
| Burmese | 98.5 /100 | #72 | Exceptional 1.1% |