Immigrants from Afghanistan vs Immigrants from Jamaica Disability Age Under 5
COMPARE
Immigrants from Afghanistan
Immigrants from Jamaica
Disability Age Under 5
Disability Age Under 5 Comparison
Immigrants from Afghanistan
Immigrants from Jamaica
0.91%
DISABILITY AGE UNDER 5
100.0/ 100
METRIC RATING
7th/ 347
METRIC RANK
1.2%
DISABILITY AGE UNDER 5
58.8/ 100
METRIC RATING
170th/ 347
METRIC RANK
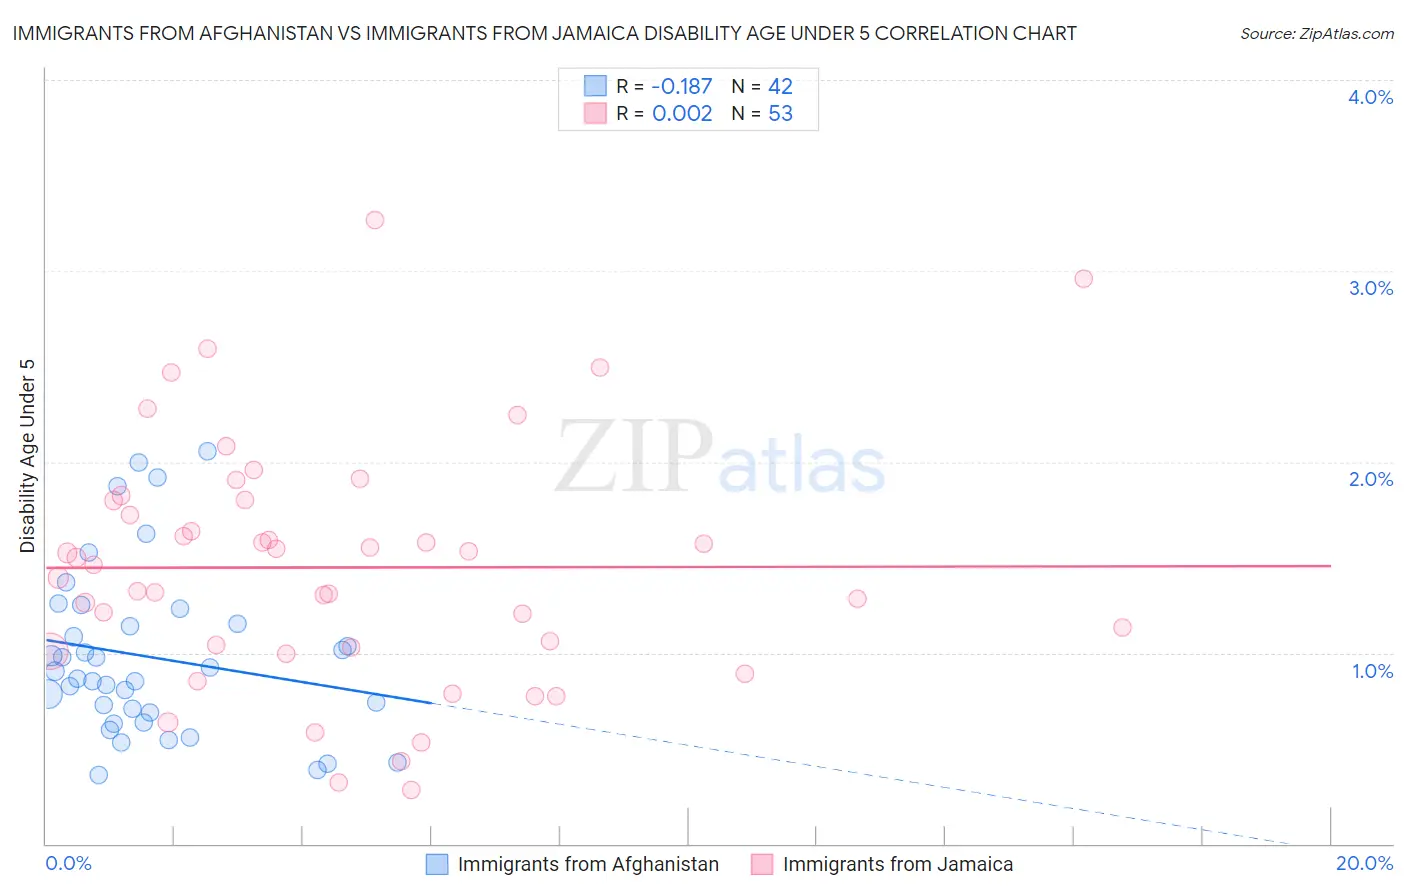
Immigrants from Afghanistan vs Immigrants from Jamaica Disability Age Under 5 Correlation Chart
The statistical analysis conducted on geographies consisting of 107,593,919 people shows a poor negative correlation between the proportion of Immigrants from Afghanistan and percentage of population with a disability under the age of 5 in the United States with a correlation coefficient (R) of -0.187 and weighted average of 0.91%. Similarly, the statistical analysis conducted on geographies consisting of 173,327,307 people shows no correlation between the proportion of Immigrants from Jamaica and percentage of population with a disability under the age of 5 in the United States with a correlation coefficient (R) of 0.002 and weighted average of 1.2%, a difference of 35.7%.
Disability Age Under 5 Correlation Summary
| Measurement | Immigrants from Afghanistan | Immigrants from Jamaica |
| Minimum | 0.36% | 0.28% |
| Maximum | 2.1% | 3.3% |
| Range | 1.7% | 3.0% |
| Mean | 0.98% | 1.4% |
| Median | 0.88% | 1.5% |
| Interquartile 25% (IQ1) | 0.68% | 1.0% |
| Interquartile 75% (IQ3) | 1.2% | 1.8% |
| Interquartile Range (IQR) | 0.47% | 0.78% |
| Standard Deviation (Sample) | 0.44% | 0.64% |
| Standard Deviation (Population) | 0.43% | 0.63% |
Similar Demographics by Disability Age Under 5
Demographics Similar to Immigrants from Afghanistan by Disability Age Under 5
In terms of disability age under 5, the demographic groups most similar to Immigrants from Afghanistan are Immigrants from Yemen (0.91%, a difference of 0.13%), Immigrants from Fiji (0.92%, a difference of 1.2%), Marshallese (0.94%, a difference of 3.4%), Afghan (0.94%, a difference of 4.1%), and Immigrants from Grenada (0.94%, a difference of 4.2%).
| Demographics | Rating | Rank | Disability Age Under 5 |
| Immigrants | Armenia | 100.0 /100 | #1 | Exceptional 0.76% |
| Immigrants | St. Vincent and the Grenadines | 100.0 /100 | #2 | Exceptional 0.79% |
| Vietnamese | 100.0 /100 | #3 | Exceptional 0.81% |
| Immigrants | Uzbekistan | 100.0 /100 | #4 | Exceptional 0.85% |
| Immigrants | Bangladesh | 100.0 /100 | #5 | Exceptional 0.85% |
| Ute | 100.0 /100 | #6 | Exceptional 0.86% |
| Immigrants | Afghanistan | 100.0 /100 | #7 | Exceptional 0.91% |
| Immigrants | Yemen | 100.0 /100 | #8 | Exceptional 0.91% |
| Immigrants | Fiji | 100.0 /100 | #9 | Exceptional 0.92% |
| Marshallese | 100.0 /100 | #10 | Exceptional 0.94% |
| Afghans | 100.0 /100 | #11 | Exceptional 0.94% |
| Immigrants | Grenada | 100.0 /100 | #12 | Exceptional 0.94% |
| Soviet Union | 100.0 /100 | #13 | Exceptional 0.95% |
| Yuman | 100.0 /100 | #14 | Exceptional 0.95% |
| Immigrants | Hong Kong | 100.0 /100 | #15 | Exceptional 0.95% |
Demographics Similar to Immigrants from Jamaica by Disability Age Under 5
In terms of disability age under 5, the demographic groups most similar to Immigrants from Jamaica are Immigrants from Uruguay (1.2%, a difference of 0.020%), Sierra Leonean (1.2%, a difference of 0.030%), Guamanian/Chamorro (1.2%, a difference of 0.090%), Immigrants from Argentina (1.2%, a difference of 0.13%), and Immigrants from Central America (1.2%, a difference of 0.25%).
| Demographics | Rating | Rank | Disability Age Under 5 |
| Immigrants | Guatemala | 63.2 /100 | #163 | Good 1.2% |
| Laotians | 62.8 /100 | #164 | Good 1.2% |
| Immigrants | Kuwait | 62.6 /100 | #165 | Good 1.2% |
| Immigrants | Central America | 61.4 /100 | #166 | Good 1.2% |
| Immigrants | Argentina | 60.2 /100 | #167 | Good 1.2% |
| Sierra Leoneans | 59.1 /100 | #168 | Average 1.2% |
| Immigrants | Uruguay | 59.0 /100 | #169 | Average 1.2% |
| Immigrants | Jamaica | 58.8 /100 | #170 | Average 1.2% |
| Guamanians/Chamorros | 57.8 /100 | #171 | Average 1.2% |
| Crow | 51.0 /100 | #172 | Average 1.2% |
| Immigrants | Ireland | 50.3 /100 | #173 | Average 1.2% |
| Immigrants | Latvia | 50.0 /100 | #174 | Average 1.2% |
| Immigrants | Nigeria | 50.0 /100 | #175 | Average 1.2% |
| Immigrants | Kenya | 48.6 /100 | #176 | Average 1.2% |
| Comanche | 47.5 /100 | #177 | Average 1.2% |