Finnish vs Tsimshian Disability Age Under 5
COMPARE
Finnish
Tsimshian
Disability Age Under 5
Disability Age Under 5 Comparison
Finns
Tsimshian
1.6%
DISABILITY AGE UNDER 5
0.0/ 100
METRIC RATING
295th/ 347
METRIC RANK
2.4%
DISABILITY AGE UNDER 5
0.0/ 100
METRIC RATING
341st/ 347
METRIC RANK
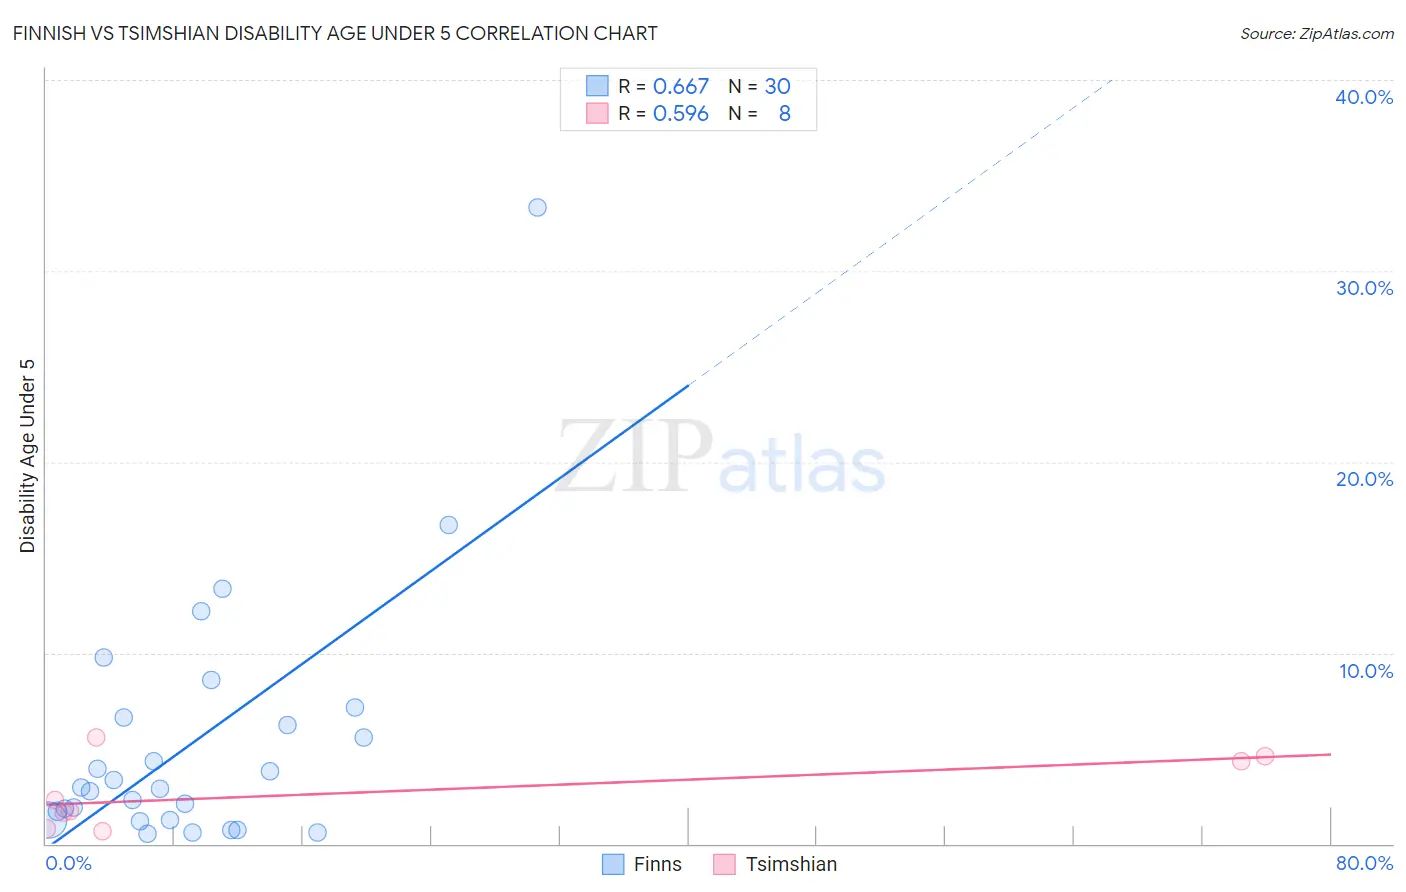
Finnish vs Tsimshian Disability Age Under 5 Correlation Chart
The statistical analysis conducted on geographies consisting of 211,536,614 people shows a significant positive correlation between the proportion of Finns and percentage of population with a disability under the age of 5 in the United States with a correlation coefficient (R) of 0.667 and weighted average of 1.6%. Similarly, the statistical analysis conducted on geographies consisting of 13,579,773 people shows a substantial positive correlation between the proportion of Tsimshian and percentage of population with a disability under the age of 5 in the United States with a correlation coefficient (R) of 0.596 and weighted average of 2.4%, a difference of 51.6%.
Disability Age Under 5 Correlation Summary
| Measurement | Finnish | Tsimshian |
| Minimum | 0.51% | 0.66% |
| Maximum | 33.3% | 5.6% |
| Range | 32.8% | 4.9% |
| Mean | 5.3% | 2.7% |
| Median | 2.9% | 2.0% |
| Interquartile 25% (IQ1) | 1.3% | 1.2% |
| Interquartile 75% (IQ3) | 6.6% | 4.5% |
| Interquartile Range (IQR) | 5.4% | 3.3% |
| Standard Deviation (Sample) | 6.7% | 1.9% |
| Standard Deviation (Population) | 6.6% | 1.8% |
Similar Demographics by Disability Age Under 5
Demographics Similar to Finns by Disability Age Under 5
In terms of disability age under 5, the demographic groups most similar to Finns are Polish (1.6%, a difference of 0.080%), Swedish (1.6%, a difference of 0.62%), Nonimmigrants (1.6%, a difference of 1.0%), Cajun (1.6%, a difference of 1.0%), and Portuguese (1.6%, a difference of 1.6%).
| Demographics | Rating | Rank | Disability Age Under 5 |
| Estonians | 0.0 /100 | #288 | Tragic 1.5% |
| Hungarians | 0.0 /100 | #289 | Tragic 1.5% |
| Czechs | 0.0 /100 | #290 | Tragic 1.5% |
| Northern Europeans | 0.0 /100 | #291 | Tragic 1.6% |
| Italians | 0.0 /100 | #292 | Tragic 1.6% |
| Lithuanians | 0.0 /100 | #293 | Tragic 1.6% |
| Swedes | 0.0 /100 | #294 | Tragic 1.6% |
| Finns | 0.0 /100 | #295 | Tragic 1.6% |
| Poles | 0.0 /100 | #296 | Tragic 1.6% |
| Immigrants | Nonimmigrants | 0.0 /100 | #297 | Tragic 1.6% |
| Cajuns | 0.0 /100 | #298 | Tragic 1.6% |
| Portuguese | 0.0 /100 | #299 | Tragic 1.6% |
| Shoshone | 0.0 /100 | #300 | Tragic 1.6% |
| German Russians | 0.0 /100 | #301 | Tragic 1.6% |
| Welsh | 0.0 /100 | #302 | Tragic 1.6% |
Demographics Similar to Tsimshian by Disability Age Under 5
In terms of disability age under 5, the demographic groups most similar to Tsimshian are Menominee (2.3%, a difference of 4.9%), Immigrants from the Azores (2.2%, a difference of 7.8%), Tohono O'odham (2.2%, a difference of 10.2%), Apache (2.0%, a difference of 18.5%), and Paraguayan (2.0%, a difference of 22.0%).
| Demographics | Rating | Rank | Disability Age Under 5 |
| Dutch West Indians | 0.0 /100 | #333 | Tragic 1.9% |
| Natives/Alaskans | 0.0 /100 | #334 | Tragic 1.9% |
| Pennsylvania Germans | 0.0 /100 | #335 | Tragic 1.9% |
| Paraguayans | 0.0 /100 | #336 | Tragic 2.0% |
| Apache | 0.0 /100 | #337 | Tragic 2.0% |
| Tohono O'odham | 0.0 /100 | #338 | Tragic 2.2% |
| Immigrants | Azores | 0.0 /100 | #339 | Tragic 2.2% |
| Menominee | 0.0 /100 | #340 | Tragic 2.3% |
| Tsimshian | 0.0 /100 | #341 | Tragic 2.4% |
| Alaska Natives | 0.0 /100 | #342 | Tragic 2.9% |
| Colville | 0.0 /100 | #343 | Tragic 3.3% |
| Inupiat | 0.0 /100 | #344 | Tragic 3.7% |
| Paiute | 0.0 /100 | #345 | Tragic 3.9% |
| Yup'ik | 0.0 /100 | #346 | Tragic 4.5% |
| Hopi | 0.0 /100 | #347 | Tragic 4.6% |