Finnish vs Immigrants from Greece Disability Age Under 5
COMPARE
Finnish
Immigrants from Greece
Disability Age Under 5
Disability Age Under 5 Comparison
Finns
Immigrants from Greece
1.6%
DISABILITY AGE UNDER 5
0.0/ 100
METRIC RATING
295th/ 347
METRIC RANK
1.3%
DISABILITY AGE UNDER 5
19.1/ 100
METRIC RATING
211th/ 347
METRIC RANK
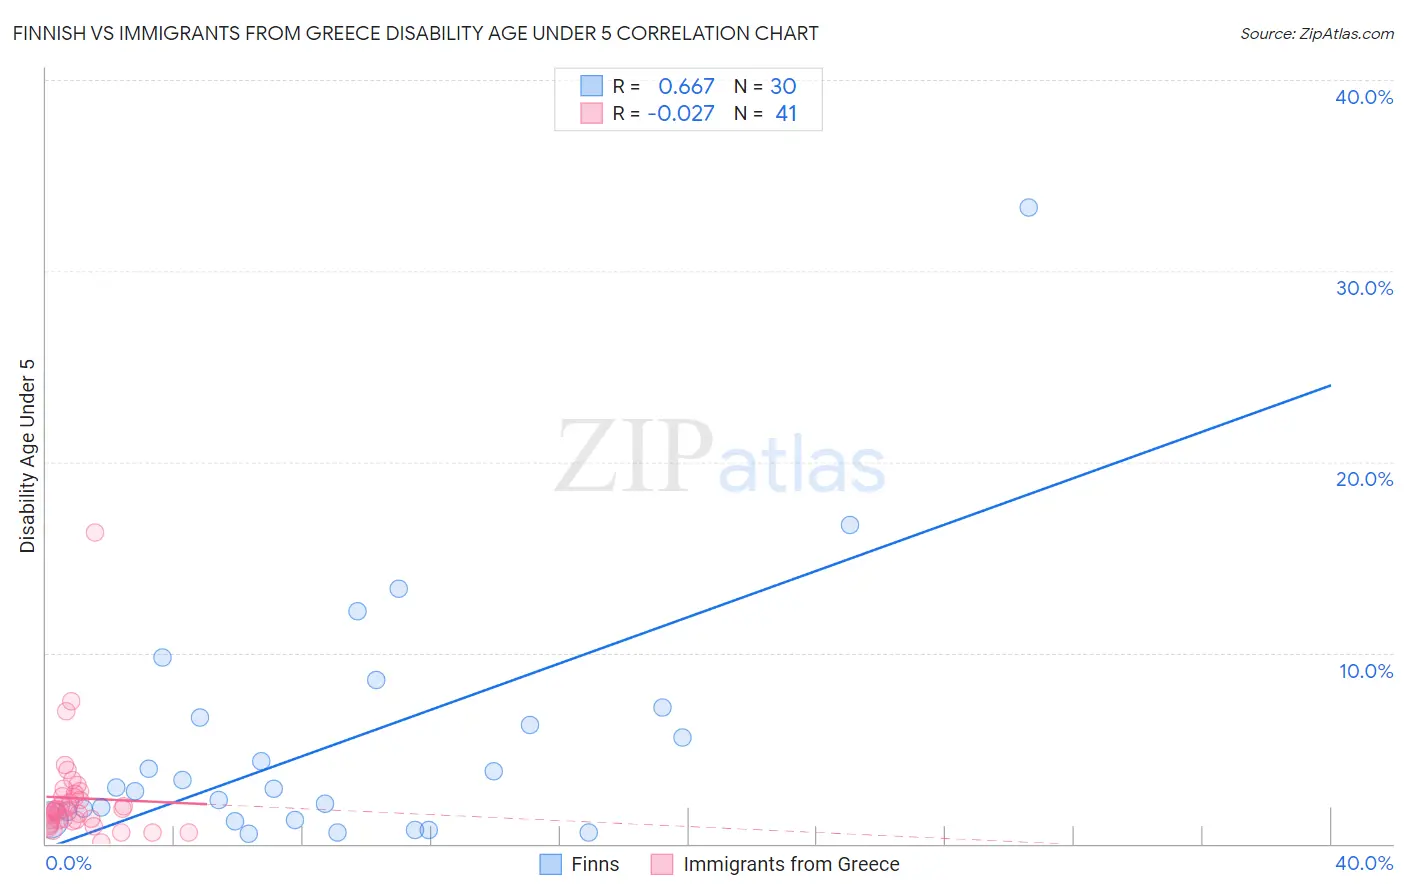
Finnish vs Immigrants from Greece Disability Age Under 5 Correlation Chart
The statistical analysis conducted on geographies consisting of 211,536,614 people shows a significant positive correlation between the proportion of Finns and percentage of population with a disability under the age of 5 in the United States with a correlation coefficient (R) of 0.667 and weighted average of 1.6%. Similarly, the statistical analysis conducted on geographies consisting of 132,613,079 people shows no correlation between the proportion of Immigrants from Greece and percentage of population with a disability under the age of 5 in the United States with a correlation coefficient (R) of -0.027 and weighted average of 1.3%, a difference of 24.1%.
Disability Age Under 5 Correlation Summary
| Measurement | Finnish | Immigrants from Greece |
| Minimum | 0.51% | 0.058% |
| Maximum | 33.3% | 16.3% |
| Range | 32.8% | 16.2% |
| Mean | 5.3% | 2.4% |
| Median | 2.9% | 1.7% |
| Interquartile 25% (IQ1) | 1.3% | 1.2% |
| Interquartile 75% (IQ3) | 6.6% | 2.6% |
| Interquartile Range (IQR) | 5.4% | 1.4% |
| Standard Deviation (Sample) | 6.7% | 2.7% |
| Standard Deviation (Population) | 6.6% | 2.6% |
Similar Demographics by Disability Age Under 5
Demographics Similar to Finns by Disability Age Under 5
In terms of disability age under 5, the demographic groups most similar to Finns are Polish (1.6%, a difference of 0.080%), Swedish (1.6%, a difference of 0.62%), Nonimmigrants (1.6%, a difference of 1.0%), Cajun (1.6%, a difference of 1.0%), and Portuguese (1.6%, a difference of 1.6%).
| Demographics | Rating | Rank | Disability Age Under 5 |
| Estonians | 0.0 /100 | #288 | Tragic 1.5% |
| Hungarians | 0.0 /100 | #289 | Tragic 1.5% |
| Czechs | 0.0 /100 | #290 | Tragic 1.5% |
| Northern Europeans | 0.0 /100 | #291 | Tragic 1.6% |
| Italians | 0.0 /100 | #292 | Tragic 1.6% |
| Lithuanians | 0.0 /100 | #293 | Tragic 1.6% |
| Swedes | 0.0 /100 | #294 | Tragic 1.6% |
| Finns | 0.0 /100 | #295 | Tragic 1.6% |
| Poles | 0.0 /100 | #296 | Tragic 1.6% |
| Immigrants | Nonimmigrants | 0.0 /100 | #297 | Tragic 1.6% |
| Cajuns | 0.0 /100 | #298 | Tragic 1.6% |
| Portuguese | 0.0 /100 | #299 | Tragic 1.6% |
| Shoshone | 0.0 /100 | #300 | Tragic 1.6% |
| German Russians | 0.0 /100 | #301 | Tragic 1.6% |
| Welsh | 0.0 /100 | #302 | Tragic 1.6% |
Demographics Similar to Immigrants from Greece by Disability Age Under 5
In terms of disability age under 5, the demographic groups most similar to Immigrants from Greece are Pakistani (1.3%, a difference of 0.040%), Chilean (1.3%, a difference of 0.040%), Bulgarian (1.3%, a difference of 0.050%), Immigrants from Sudan (1.3%, a difference of 0.060%), and Mexican (1.3%, a difference of 0.23%).
| Demographics | Rating | Rank | Disability Age Under 5 |
| Immigrants | Europe | 23.6 /100 | #204 | Fair 1.3% |
| Romanians | 22.5 /100 | #205 | Fair 1.3% |
| Immigrants | Poland | 22.4 /100 | #206 | Fair 1.3% |
| Nigerians | 21.2 /100 | #207 | Fair 1.3% |
| Mexicans | 20.8 /100 | #208 | Fair 1.3% |
| Bulgarians | 19.5 /100 | #209 | Poor 1.3% |
| Pakistanis | 19.4 /100 | #210 | Poor 1.3% |
| Immigrants | Greece | 19.1 /100 | #211 | Poor 1.3% |
| Chileans | 18.8 /100 | #212 | Poor 1.3% |
| Immigrants | Sudan | 18.7 /100 | #213 | Poor 1.3% |
| Immigrants | Chile | 17.2 /100 | #214 | Poor 1.3% |
| Syrians | 16.1 /100 | #215 | Poor 1.3% |
| Bangladeshis | 15.5 /100 | #216 | Poor 1.3% |
| Cypriots | 14.9 /100 | #217 | Poor 1.3% |
| Malaysians | 13.2 /100 | #218 | Poor 1.3% |