Finnish vs Immigrants from Sierra Leone Disability Age Under 5
COMPARE
Finnish
Immigrants from Sierra Leone
Disability Age Under 5
Disability Age Under 5 Comparison
Finns
Immigrants from Sierra Leone
1.6%
DISABILITY AGE UNDER 5
0.0/ 100
METRIC RATING
295th/ 347
METRIC RANK
1.3%
DISABILITY AGE UNDER 5
36.5/ 100
METRIC RATING
193rd/ 347
METRIC RANK
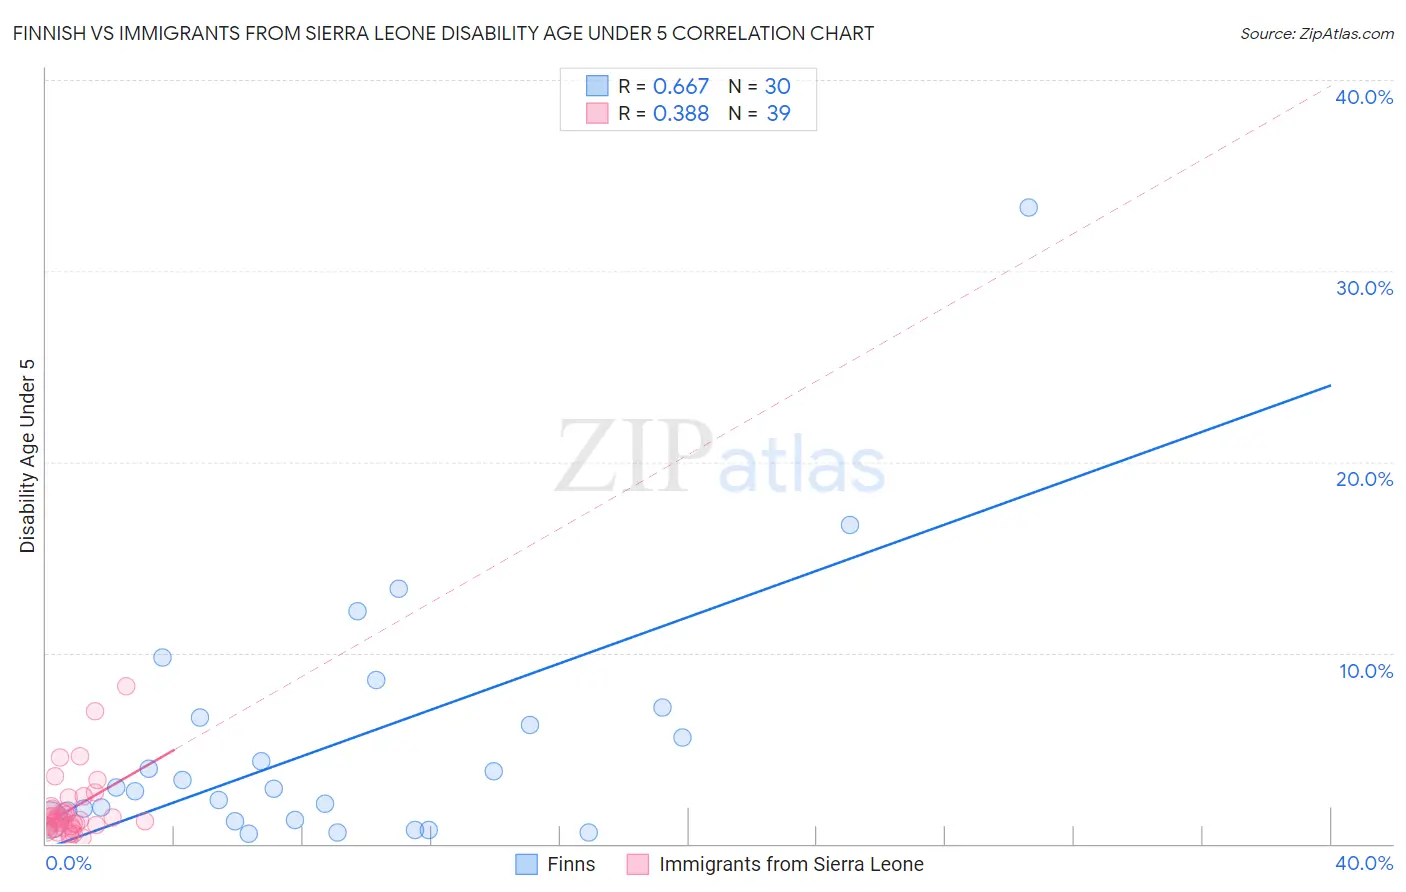
Finnish vs Immigrants from Sierra Leone Disability Age Under 5 Correlation Chart
The statistical analysis conducted on geographies consisting of 211,536,614 people shows a significant positive correlation between the proportion of Finns and percentage of population with a disability under the age of 5 in the United States with a correlation coefficient (R) of 0.667 and weighted average of 1.6%. Similarly, the statistical analysis conducted on geographies consisting of 77,055,630 people shows a mild positive correlation between the proportion of Immigrants from Sierra Leone and percentage of population with a disability under the age of 5 in the United States with a correlation coefficient (R) of 0.388 and weighted average of 1.3%, a difference of 26.6%.
Disability Age Under 5 Correlation Summary
| Measurement | Finnish | Immigrants from Sierra Leone |
| Minimum | 0.51% | 0.31% |
| Maximum | 33.3% | 8.2% |
| Range | 32.8% | 7.9% |
| Mean | 5.3% | 1.8% |
| Median | 2.9% | 1.3% |
| Interquartile 25% (IQ1) | 1.3% | 0.88% |
| Interquartile 75% (IQ3) | 6.6% | 2.0% |
| Interquartile Range (IQR) | 5.4% | 1.1% |
| Standard Deviation (Sample) | 6.7% | 1.7% |
| Standard Deviation (Population) | 6.6% | 1.7% |
Similar Demographics by Disability Age Under 5
Demographics Similar to Finns by Disability Age Under 5
In terms of disability age under 5, the demographic groups most similar to Finns are Polish (1.6%, a difference of 0.080%), Swedish (1.6%, a difference of 0.62%), Nonimmigrants (1.6%, a difference of 1.0%), Cajun (1.6%, a difference of 1.0%), and Portuguese (1.6%, a difference of 1.6%).
| Demographics | Rating | Rank | Disability Age Under 5 |
| Estonians | 0.0 /100 | #288 | Tragic 1.5% |
| Hungarians | 0.0 /100 | #289 | Tragic 1.5% |
| Czechs | 0.0 /100 | #290 | Tragic 1.5% |
| Northern Europeans | 0.0 /100 | #291 | Tragic 1.6% |
| Italians | 0.0 /100 | #292 | Tragic 1.6% |
| Lithuanians | 0.0 /100 | #293 | Tragic 1.6% |
| Swedes | 0.0 /100 | #294 | Tragic 1.6% |
| Finns | 0.0 /100 | #295 | Tragic 1.6% |
| Poles | 0.0 /100 | #296 | Tragic 1.6% |
| Immigrants | Nonimmigrants | 0.0 /100 | #297 | Tragic 1.6% |
| Cajuns | 0.0 /100 | #298 | Tragic 1.6% |
| Portuguese | 0.0 /100 | #299 | Tragic 1.6% |
| Shoshone | 0.0 /100 | #300 | Tragic 1.6% |
| German Russians | 0.0 /100 | #301 | Tragic 1.6% |
| Welsh | 0.0 /100 | #302 | Tragic 1.6% |
Demographics Similar to Immigrants from Sierra Leone by Disability Age Under 5
In terms of disability age under 5, the demographic groups most similar to Immigrants from Sierra Leone are Mexican American Indian (1.3%, a difference of 0.0%), Immigrants from Bosnia and Herzegovina (1.3%, a difference of 0.0%), Immigrants from Laos (1.3%, a difference of 0.010%), Peruvian (1.3%, a difference of 0.11%), and Immigrants from North Macedonia (1.3%, a difference of 0.18%).
| Demographics | Rating | Rank | Disability Age Under 5 |
| Cubans | 42.5 /100 | #186 | Average 1.2% |
| Immigrants | Haiti | 40.2 /100 | #187 | Average 1.3% |
| Haitians | 39.9 /100 | #188 | Fair 1.3% |
| Peruvians | 37.6 /100 | #189 | Fair 1.3% |
| Immigrants | Laos | 36.6 /100 | #190 | Fair 1.3% |
| Mexican American Indians | 36.6 /100 | #191 | Fair 1.3% |
| Immigrants | Bosnia and Herzegovina | 36.5 /100 | #192 | Fair 1.3% |
| Immigrants | Sierra Leone | 36.5 /100 | #193 | Fair 1.3% |
| Immigrants | North Macedonia | 34.7 /100 | #194 | Fair 1.3% |
| U.S. Virgin Islanders | 34.4 /100 | #195 | Fair 1.3% |
| Immigrants | Belgium | 31.4 /100 | #196 | Fair 1.3% |
| Immigrants | Somalia | 31.3 /100 | #197 | Fair 1.3% |
| Immigrants | Norway | 31.1 /100 | #198 | Fair 1.3% |
| Jamaicans | 30.7 /100 | #199 | Fair 1.3% |
| Immigrants | Lithuania | 27.2 /100 | #200 | Fair 1.3% |