Zip Codes with the Highest Percentage of Population Employed in Professional & Scientific Services in Sacramento, CA
RELATED REPORTS & OPTIONS
Professional & Scientific Services
Sacramento
Compare Zip Codes
Map of Zip Codes with the Highest Percentage of Population Employed in Professional & Scientific Services in Sacramento
2.2%
13.5%
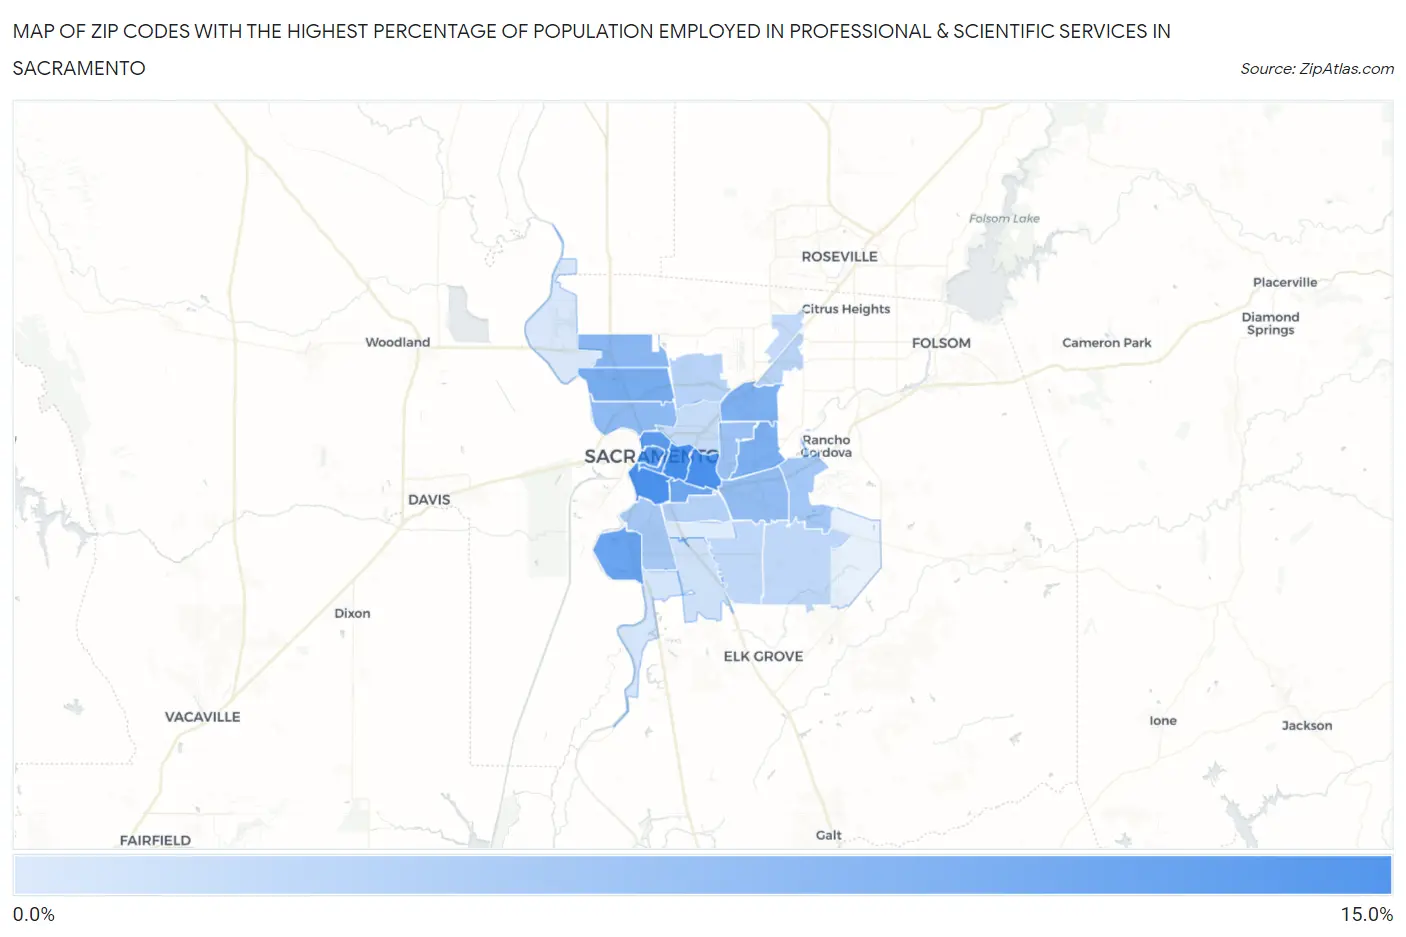
Zip Codes with the Highest Percentage of Population Employed in Professional & Scientific Services in Sacramento, CA
| Zip Code | % Employed | vs State | vs National | |
| 1. | 95816 | 13.5% | 9.4% (+4.06)#349 | 7.8% (+5.65)#2,487 |
| 2. | 95819 | 13.3% | 9.4% (+3.89)#359 | 7.8% (+5.48)#2,575 |
| 3. | 95818 | 13.1% | 9.4% (+3.70)#364 | 7.8% (+5.28)#2,653 |
| 4. | 95814 | 12.5% | 9.4% (+3.03)#395 | 7.8% (+4.62)#2,960 |
| 5. | 95811 | 12.1% | 9.4% (+2.68)#413 | 7.8% (+4.27)#3,136 |
| 6. | 95831 | 10.7% | 9.4% (+1.30)#487 | 7.8% (+2.89)#4,012 |
| 7. | 95817 | 10.4% | 9.4% (+0.958)#512 | 7.8% (+2.55)#4,283 |
| 8. | 95834 | 9.7% | 9.4% (+0.229)#560 | 7.8% (+1.82)#4,877 |
| 9. | 95864 | 9.4% | 9.4% (-0.078)#584 | 7.8% (+1.51)#5,137 |
| 10. | 95821 | 9.2% | 9.4% (-0.238)#592 | 7.8% (+1.35)#5,295 |
| 11. | 95835 | 8.3% | 9.4% (-1.18)#663 | 7.8% (+0.412)#6,329 |
| 12. | 95833 | 8.0% | 9.4% (-1.44)#692 | 7.8% (+0.144)#6,675 |
| 13. | 95826 | 7.6% | 9.4% (-1.86)#731 | 7.8% (-0.277)#7,249 |
| 14. | 95825 | 7.1% | 9.4% (-2.32)#778 | 7.8% (-0.735)#7,979 |
| 15. | 95827 | 6.5% | 9.4% (-2.96)#845 | 7.8% (-1.37)#9,083 |
| 16. | 95822 | 6.2% | 9.4% (-3.23)#867 | 7.8% (-1.64)#9,565 |
| 17. | 95820 | 5.3% | 9.4% (-4.14)#986 | 7.8% (-2.55)#11,563 |
| 18. | 95841 | 4.9% | 9.4% (-4.50)#1,030 | 7.8% (-2.91)#12,475 |
| 19. | 95838 | 4.8% | 9.4% (-4.60)#1,042 | 7.8% (-3.01)#12,741 |
| 20. | 95829 | 4.4% | 9.4% (-5.01)#1,093 | 7.8% (-3.42)#13,881 |
| 21. | 95828 | 4.3% | 9.4% (-5.12)#1,108 | 7.8% (-3.53)#14,176 |
| 22. | 95842 | 4.2% | 9.4% (-5.27)#1,133 | 7.8% (-3.68)#14,644 |
| 23. | 95815 | 3.9% | 9.4% (-5.56)#1,158 | 7.8% (-3.98)#15,511 |
| 24. | 95823 | 3.2% | 9.4% (-6.25)#1,248 | 7.8% (-4.66)#17,789 |
| 25. | 95832 | 2.9% | 9.4% (-6.55)#1,276 | 7.8% (-4.97)#18,868 |
| 26. | 95837 | 2.6% | 9.4% (-6.82)#1,310 | 7.8% (-5.23)#19,791 |
| 27. | 95824 | 2.2% | 9.4% (-7.21)#1,361 | 7.8% (-5.62)#21,132 |
1
Common Questions
What are the Top 10 Zip Codes with the Highest Percentage of Population Employed in Professional & Scientific Services in Sacramento, CA?
Top 10 Zip Codes with the Highest Percentage of Population Employed in Professional & Scientific Services in Sacramento, CA are:
What zip code has the Highest Percentage of Population Employed in Professional & Scientific Services in Sacramento, CA?
95816 has the Highest Percentage of Population Employed in Professional & Scientific Services in Sacramento, CA with 13.5%.
What is the Percentage of Population Employed in Professional & Scientific Services in Sacramento, CA?
Percentage of Population Employed in Professional & Scientific Services in Sacramento is 8.0%.
What is the Percentage of Population Employed in Professional & Scientific Services in California?
Percentage of Population Employed in Professional & Scientific Services in California is 9.4%.
What is the Percentage of Population Employed in Professional & Scientific Services in the United States?
Percentage of Population Employed in Professional & Scientific Services in the United States is 7.8%.