Egyptian Self-Care Disability
COMPARE
Egyptian
Select to Compare
Self-Care Disability
Egyptian Self-Care Disability
2.3%
SELF-CARE DISABILITY
99.4/ 100
METRIC RATING
62nd/ 347
METRIC RANK
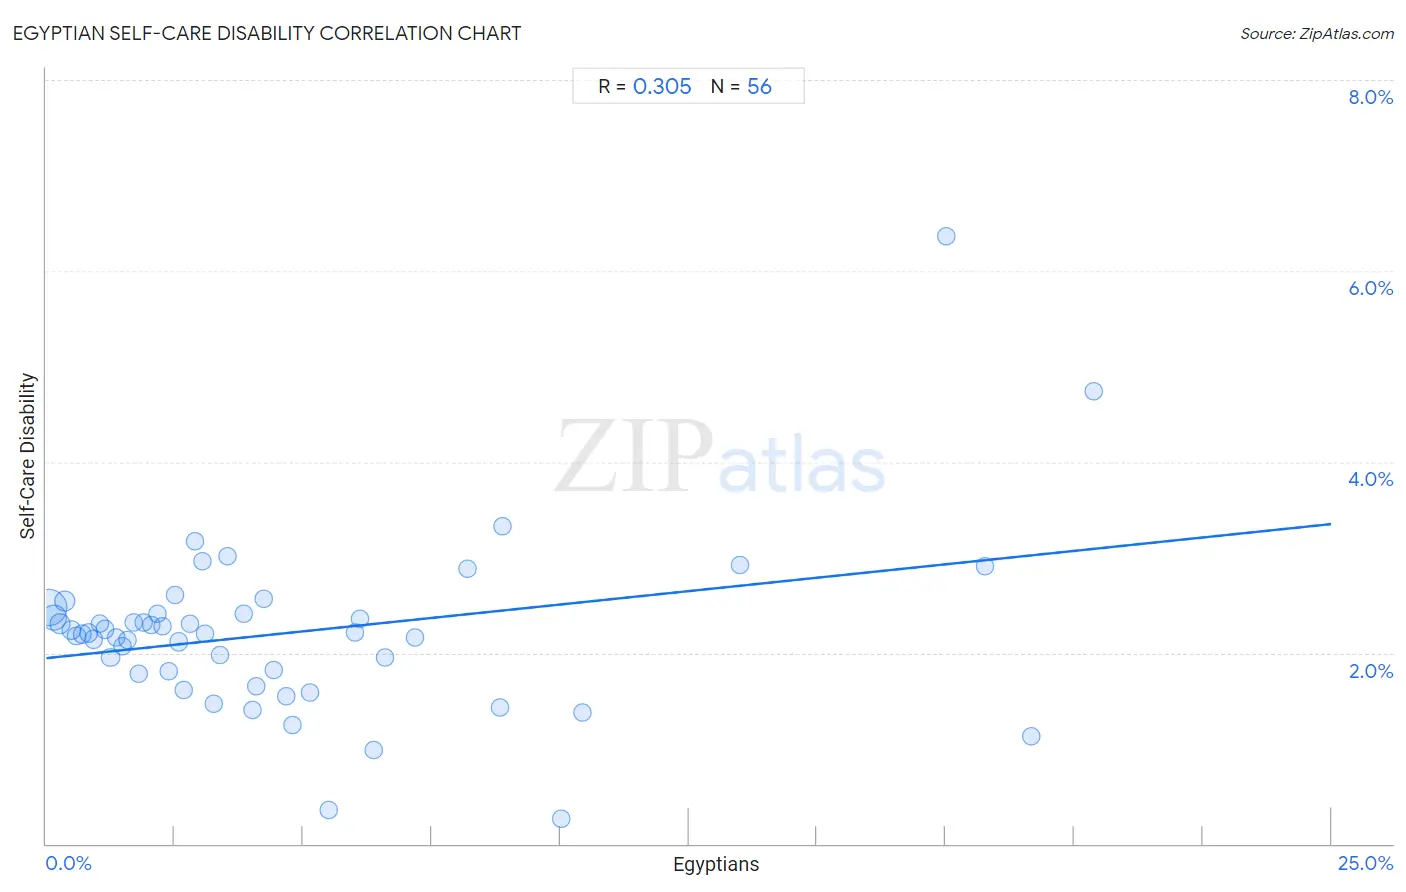
Egyptian Self-Care Disability Correlation Chart
The statistical analysis conducted on geographies consisting of 276,732,950 people shows a mild positive correlation between the proportion of Egyptians and percentage of population with self-care disability in the United States with a correlation coefficient (R) of 0.305 and weighted average of 2.3%. On average, for every 1% (one percent) increase in Egyptians within a typical geography, there is an increase of 0.056% in percentage of population with self-care disability.
It is essential to understand that the correlation between the percentage of Egyptians and percentage of population with self-care disability does not imply a direct cause-and-effect relationship. It remains uncertain whether the presence of Egyptians influences an upward or downward trend in the level of percentage of population with self-care disability within an area, or if Egyptians simply ended up residing in those areas with higher or lower levels of percentage of population with self-care disability due to other factors.
Demographics Similar to Egyptians by Self-Care Disability
In terms of self-care disability, the demographic groups most similar to Egyptians are Palestinian (2.3%, a difference of 0.090%), Mongolian (2.3%, a difference of 0.090%), Swedish (2.3%, a difference of 0.090%), Brazilian (2.3%, a difference of 0.16%), and Immigrants from Japan (2.3%, a difference of 0.19%).
| Demographics | Rating | Rank | Self-Care Disability |
| Immigrants from France | 99.6 /100 | #55 | Exceptional 2.3% |
| Immigrants from Eastern Asia | 99.6 /100 | #56 | Exceptional 2.3% |
| Immigrants from Belgium | 99.6 /100 | #57 | Exceptional 2.3% |
| Immigrants from Cameroon | 99.6 /100 | #58 | Exceptional 2.3% |
| New Zealanders | 99.5 /100 | #59 | Exceptional 2.3% |
| Immigrants from Japan | 99.5 /100 | #60 | Exceptional 2.3% |
| Palestinians | 99.4 /100 | #61 | Exceptional 2.3% |
| Egyptians | 99.4 /100 | #62 | Exceptional 2.3% |
| Mongolians | 99.3 /100 | #63 | Exceptional 2.3% |
| Swedes | 99.3 /100 | #64 | Exceptional 2.3% |
| Brazilians | 99.3 /100 | #65 | Exceptional 2.3% |
| Immigrants from Argentina | 99.3 /100 | #66 | Exceptional 2.3% |
| South Africans | 99.3 /100 | #67 | Exceptional 2.3% |
| Immigrants from Zaire | 99.2 /100 | #68 | Exceptional 2.3% |
| Immigrants from Norway | 99.2 /100 | #69 | Exceptional 2.3% |
Egyptian Self-Care Disability Correlation Summary
| Measurement | Egyptian Data | Self-Care Disability Data |
| Minimum | 0.048% | 0.26% |
| Maximum | 20.4% | 6.4% |
| Range | 20.3% | 6.1% |
| Mean | 4.7% | 2.2% |
| Median | 3.1% | 2.2% |
| Interquartile 25% (IQ1) | 1.5% | 1.8% |
| Interquartile 75% (IQ3) | 6.0% | 2.4% |
| Interquartile Range (IQR) | 4.5% | 0.61% |
| Standard Deviation (Sample) | 4.9% | 0.90% |
| Standard Deviation (Population) | 4.9% | 0.89% |
Correlation Details
| Egyptian Percentile | Sample Size | Self-Care Disability |
[ 0.0% - 0.5% ] 0.048% | 148,558,156 | 2.5% |
[ 0.0% - 0.5% ] 0.16% | 57,319,129 | 2.4% |
[ 0.0% - 0.5% ] 0.27% | 20,099,425 | 2.3% |
[ 0.0% - 0.5% ] 0.36% | 22,777,007 | 2.5% |
[ 0.0% - 0.5% ] 0.49% | 7,444,670 | 2.2% |
[ 0.5% - 1.0% ] 0.60% | 4,824,912 | 2.2% |
[ 0.5% - 1.0% ] 0.70% | 3,224,368 | 2.2% |
[ 0.5% - 1.0% ] 0.82% | 2,408,651 | 2.2% |
[ 0.5% - 1.0% ] 0.93% | 1,797,091 | 2.1% |
[ 1.0% - 1.5% ] 1.04% | 1,983,146 | 2.3% |
[ 1.0% - 1.5% ] 1.14% | 836,909 | 2.2% |
[ 1.0% - 1.5% ] 1.25% | 674,335 | 2.0% |
[ 1.0% - 1.5% ] 1.35% | 775,907 | 2.2% |
[ 1.0% - 1.5% ] 1.48% | 391,296 | 2.1% |
[ 1.5% - 2.0% ] 1.59% | 416,568 | 2.1% |
[ 1.5% - 2.0% ] 1.69% | 513,256 | 2.3% |
[ 1.5% - 2.0% ] 1.80% | 291,026 | 1.8% |
[ 1.5% - 2.0% ] 1.89% | 742,845 | 2.3% |
[ 2.0% - 2.5% ] 2.04% | 262,183 | 2.3% |
[ 2.0% - 2.5% ] 2.16% | 122,114 | 2.4% |
[ 2.0% - 2.5% ] 2.27% | 25,474 | 2.3% |
[ 2.0% - 2.5% ] 2.37% | 77,570 | 1.8% |
[ 2.5% - 3.0% ] 2.51% | 9,255 | 2.6% |
[ 2.5% - 3.0% ] 2.58% | 159,607 | 2.1% |
[ 2.5% - 3.0% ] 2.66% | 145,756 | 1.6% |
[ 2.5% - 3.0% ] 2.79% | 97,376 | 2.3% |
[ 2.5% - 3.0% ] 2.89% | 2,249 | 3.2% |
[ 3.0% - 3.5% ] 3.03% | 77,913 | 3.0% |
[ 3.0% - 3.5% ] 3.10% | 113,794 | 2.2% |
[ 3.0% - 3.5% ] 3.25% | 9,596 | 1.5% |
[ 3.0% - 3.5% ] 3.38% | 5,444 | 2.0% |
[ 3.5% - 4.0% ] 3.53% | 18,673 | 3.0% |
[ 3.5% - 4.0% ] 3.83% | 56,079 | 2.4% |
[ 4.0% - 4.5% ] 4.01% | 5,835 | 1.4% |
[ 4.0% - 4.5% ] 4.09% | 60,303 | 1.7% |
[ 4.0% - 4.5% ] 4.22% | 13,070 | 2.6% |
[ 4.0% - 4.5% ] 4.44% | 36,823 | 1.8% |
[ 4.5% - 5.0% ] 4.67% | 52,230 | 1.6% |
[ 4.5% - 5.0% ] 4.79% | 4,782 | 1.2% |
[ 5.0% - 5.5% ] 5.13% | 99,800 | 1.6% |
[ 5.0% - 5.5% ] 5.49% | 601 | 0.35% |
[ 5.5% - 6.0% ] 5.99% | 3,553 | 2.2% |
[ 6.0% - 6.5% ] 6.10% | 6,952 | 2.4% |
[ 6.0% - 6.5% ] 6.36% | 14,518 | 0.98% |
[ 6.5% - 7.0% ] 6.59% | 8,410 | 1.9% |
[ 7.0% - 7.5% ] 7.17% | 7,017 | 2.2% |
[ 8.0% - 8.5% ] 8.20% | 140,994 | 2.9% |
[ 8.5% - 9.0% ] 8.83% | 1,155 | 1.4% |
[ 8.5% - 9.0% ] 8.89% | 1,429 | 3.3% |
[ 10.0% - 10.5% ] 10.02% | 5,751 | 0.26% |
[ 10.0% - 10.5% ] 10.44% | 5,000 | 1.4% |
[ 13.0% - 13.5% ] 13.49% | 1,394 | 2.9% |
[ 17.0% - 17.5% ] 17.50% | 120 | 6.4% |
[ 18.0% - 18.5% ] 18.26% | 241 | 2.9% |
[ 19.0% - 19.5% ] 19.16% | 981 | 1.1% |
[ 20.0% - 20.5% ] 20.38% | 211 | 4.7% |