Egyptian GED/Equivalency
COMPARE
Egyptian
Select to Compare
GED/Equivalency
Egyptian GED/Equivalency
87.1%
GED/EQUIVALENCY
95.3/ 100
METRIC RATING
110th/ 347
METRIC RANK
Egyptian GED/Equivalency Correlation Chart
The statistical analysis conducted on geographies consisting of 276,927,519 people shows a weak negative correlation between the proportion of Egyptians and percentage of population with at least ged/equivalency education in the United States with a correlation coefficient (R) of -0.250 and weighted average of 87.1%. On average, for every 1% (one percent) increase in Egyptians within a typical geography, there is a decrease of 0.30% in percentage of population with at least ged/equivalency education.
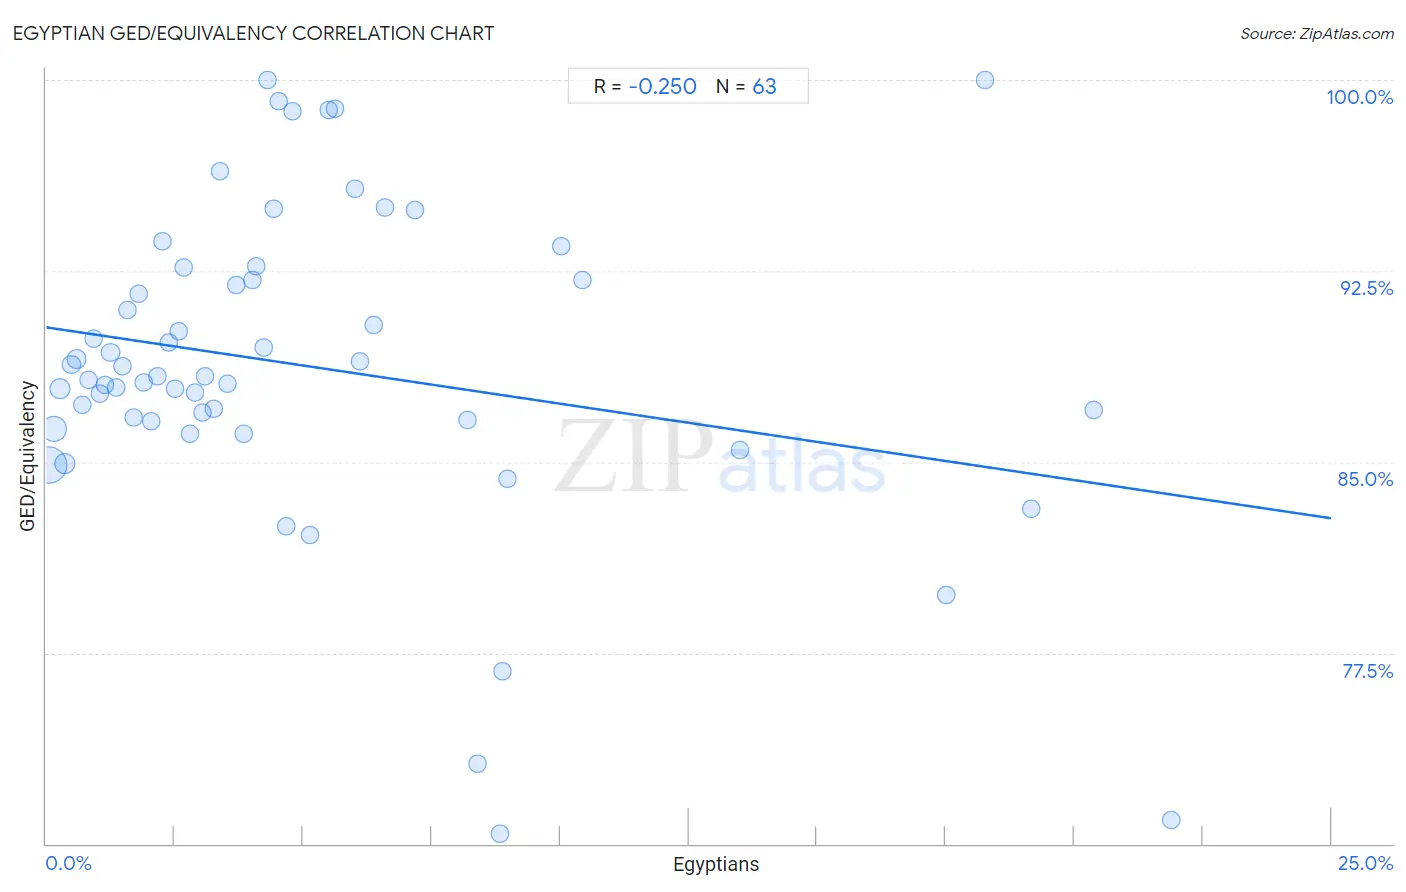
It is essential to understand that the correlation between the percentage of Egyptians and percentage of population with at least ged/equivalency education does not imply a direct cause-and-effect relationship. It remains uncertain whether the presence of Egyptians influences an upward or downward trend in the level of percentage of population with at least ged/equivalency education within an area, or if Egyptians simply ended up residing in those areas with higher or lower levels of percentage of population with at least ged/equivalency education due to other factors.
Demographics Similar to Egyptians by GED/Equivalency
In terms of ged/equivalency, the demographic groups most similar to Egyptians are French (87.1%, a difference of 0.0%), Immigrants from Eastern Europe (87.1%, a difference of 0.030%), Canadian (87.1%, a difference of 0.040%), Icelander (87.1%, a difference of 0.050%), and Tlingit-Haida (87.0%, a difference of 0.050%).
| Demographics | Rating | Rank | GED/Equivalency |
| Jordanians | 96.1 /100 | #103 | Exceptional 87.2% |
| Immigrants from Hungary | 96.0 /100 | #104 | Exceptional 87.2% |
| Indians (Asian) | 95.9 /100 | #105 | Exceptional 87.1% |
| Immigrants from Zimbabwe | 95.8 /100 | #106 | Exceptional 87.1% |
| Icelanders | 95.7 /100 | #107 | Exceptional 87.1% |
| Canadians | 95.6 /100 | #108 | Exceptional 87.1% |
| Immigrants from Eastern Europe | 95.5 /100 | #109 | Exceptional 87.1% |
| Egyptians | 95.3 /100 | #110 | Exceptional 87.1% |
| French | 95.2 /100 | #111 | Exceptional 87.1% |
| Tlingit-Haida | 94.8 /100 | #112 | Exceptional 87.0% |
| Assyrians/Chaldeans/Syriacs | 94.8 /100 | #113 | Exceptional 87.0% |
| Immigrants from Kazakhstan | 94.7 /100 | #114 | Exceptional 87.0% |
| Mongolians | 94.6 /100 | #115 | Exceptional 87.0% |
| Swiss | 94.5 /100 | #116 | Exceptional 87.0% |
| Immigrants from Hong Kong | 93.8 /100 | #117 | Exceptional 86.9% |
Egyptian GED/Equivalency Correlation Summary
| Measurement | Egyptian Data | GED/Equivalency Data |
| Minimum | 0.048% | 70.4% |
| Maximum | 21.9% | 100.0% |
| Range | 21.8% | 29.6% |
| Mean | 5.1% | 88.8% |
| Median | 3.5% | 88.3% |
| Interquartile 25% (IQ1) | 1.7% | 86.6% |
| Interquartile 75% (IQ3) | 6.4% | 92.2% |
| Interquartile Range (IQR) | 4.7% | 5.5% |
| Standard Deviation (Sample) | 5.1% | 6.2% |
| Standard Deviation (Population) | 5.1% | 6.1% |
Correlation Details
| Egyptian Percentile | Sample Size | GED/Equivalency |
[ 0.0% - 0.5% ] 0.048% | 148,575,282 | 84.9% |
[ 0.0% - 0.5% ] 0.16% | 57,367,420 | 86.3% |
[ 0.0% - 0.5% ] 0.27% | 20,141,725 | 87.9% |
[ 0.0% - 0.5% ] 0.36% | 22,792,468 | 84.9% |
[ 0.0% - 0.5% ] 0.49% | 7,459,288 | 88.8% |
[ 0.5% - 1.0% ] 0.60% | 4,835,354 | 89.0% |
[ 0.5% - 1.0% ] 0.70% | 3,226,488 | 87.2% |
[ 0.5% - 1.0% ] 0.82% | 2,417,282 | 88.2% |
[ 0.5% - 1.0% ] 0.93% | 1,797,091 | 89.8% |
[ 1.0% - 1.5% ] 1.04% | 1,983,146 | 87.7% |
[ 1.0% - 1.5% ] 1.14% | 860,367 | 88.0% |
[ 1.0% - 1.5% ] 1.25% | 676,576 | 89.3% |
[ 1.0% - 1.5% ] 1.35% | 775,907 | 87.9% |
[ 1.0% - 1.5% ] 1.48% | 391,296 | 88.7% |
[ 1.5% - 2.0% ] 1.59% | 416,887 | 91.0% |
[ 1.5% - 2.0% ] 1.69% | 513,256 | 86.7% |
[ 1.5% - 2.0% ] 1.80% | 291,026 | 91.6% |
[ 1.5% - 2.0% ] 1.89% | 742,845 | 88.1% |
[ 2.0% - 2.5% ] 2.04% | 262,183 | 86.6% |
[ 2.0% - 2.5% ] 2.16% | 122,258 | 88.3% |
[ 2.0% - 2.5% ] 2.27% | 28,023 | 93.7% |
[ 2.0% - 2.5% ] 2.37% | 77,570 | 89.7% |
[ 2.5% - 3.0% ] 2.51% | 9,255 | 87.9% |
[ 2.5% - 3.0% ] 2.58% | 159,607 | 90.1% |
[ 2.5% - 3.0% ] 2.66% | 145,756 | 92.6% |
[ 2.5% - 3.0% ] 2.79% | 97,376 | 86.1% |
[ 2.5% - 3.0% ] 2.90% | 3,965 | 87.7% |
[ 3.0% - 3.5% ] 3.03% | 77,913 | 87.0% |
[ 3.0% - 3.5% ] 3.10% | 113,952 | 88.4% |
[ 3.0% - 3.5% ] 3.25% | 9,596 | 87.1% |
[ 3.0% - 3.5% ] 3.38% | 5,444 | 96.4% |
[ 3.5% - 4.0% ] 3.53% | 18,673 | 88.1% |
[ 3.5% - 4.0% ] 3.70% | 81 | 91.9% |
[ 3.5% - 4.0% ] 3.83% | 58,053 | 86.1% |
[ 4.0% - 4.5% ] 4.01% | 5,835 | 92.2% |
[ 4.0% - 4.5% ] 4.09% | 60,303 | 92.7% |
[ 4.0% - 4.5% ] 4.22% | 13,070 | 89.5% |
[ 4.0% - 4.5% ] 4.32% | 533 | 100.0% |
[ 4.0% - 4.5% ] 4.44% | 36,823 | 94.9% |
[ 4.5% - 5.0% ] 4.52% | 155 | 99.1% |
[ 4.5% - 5.0% ] 4.67% | 52,230 | 82.5% |
[ 4.5% - 5.0% ] 4.79% | 4,782 | 98.8% |
[ 5.0% - 5.5% ] 5.13% | 99,800 | 82.1% |
[ 5.0% - 5.5% ] 5.49% | 601 | 98.8% |
[ 5.5% - 6.0% ] 5.61% | 659 | 98.9% |
[ 5.5% - 6.0% ] 5.99% | 3,553 | 95.7% |
[ 6.0% - 6.5% ] 6.10% | 6,952 | 89.0% |
[ 6.0% - 6.5% ] 6.36% | 14,518 | 90.4% |
[ 6.5% - 7.0% ] 6.59% | 8,410 | 95.0% |
[ 7.0% - 7.5% ] 7.17% | 7,017 | 94.9% |
[ 8.0% - 8.5% ] 8.20% | 140,994 | 86.6% |
[ 8.0% - 8.5% ] 8.40% | 750 | 73.1% |
[ 8.5% - 9.0% ] 8.83% | 1,155 | 70.4% |
[ 8.5% - 9.0% ] 8.89% | 1,429 | 76.8% |
[ 8.5% - 9.0% ] 8.97% | 747 | 84.3% |
[ 10.0% - 10.5% ] 10.02% | 5,751 | 93.5% |
[ 10.0% - 10.5% ] 10.44% | 5,000 | 92.1% |
[ 13.0% - 13.5% ] 13.49% | 1,394 | 85.5% |
[ 17.0% - 17.5% ] 17.50% | 120 | 79.7% |
[ 18.0% - 18.5% ] 18.26% | 241 | 100.0% |
[ 19.0% - 19.5% ] 19.16% | 981 | 83.2% |
[ 20.0% - 20.5% ] 20.38% | 211 | 87.0% |
[ 21.5% - 22.0% ] 21.88% | 96 | 70.9% |