Egyptian Married-couple Households
COMPARE
Egyptian
Select to Compare
Married-couple Households
Egyptian Married-couple Households
48.2%
MARRIED-COUPLE HOUSEHOLDS
98.2/ 100
METRIC RATING
78th/ 347
METRIC RANK
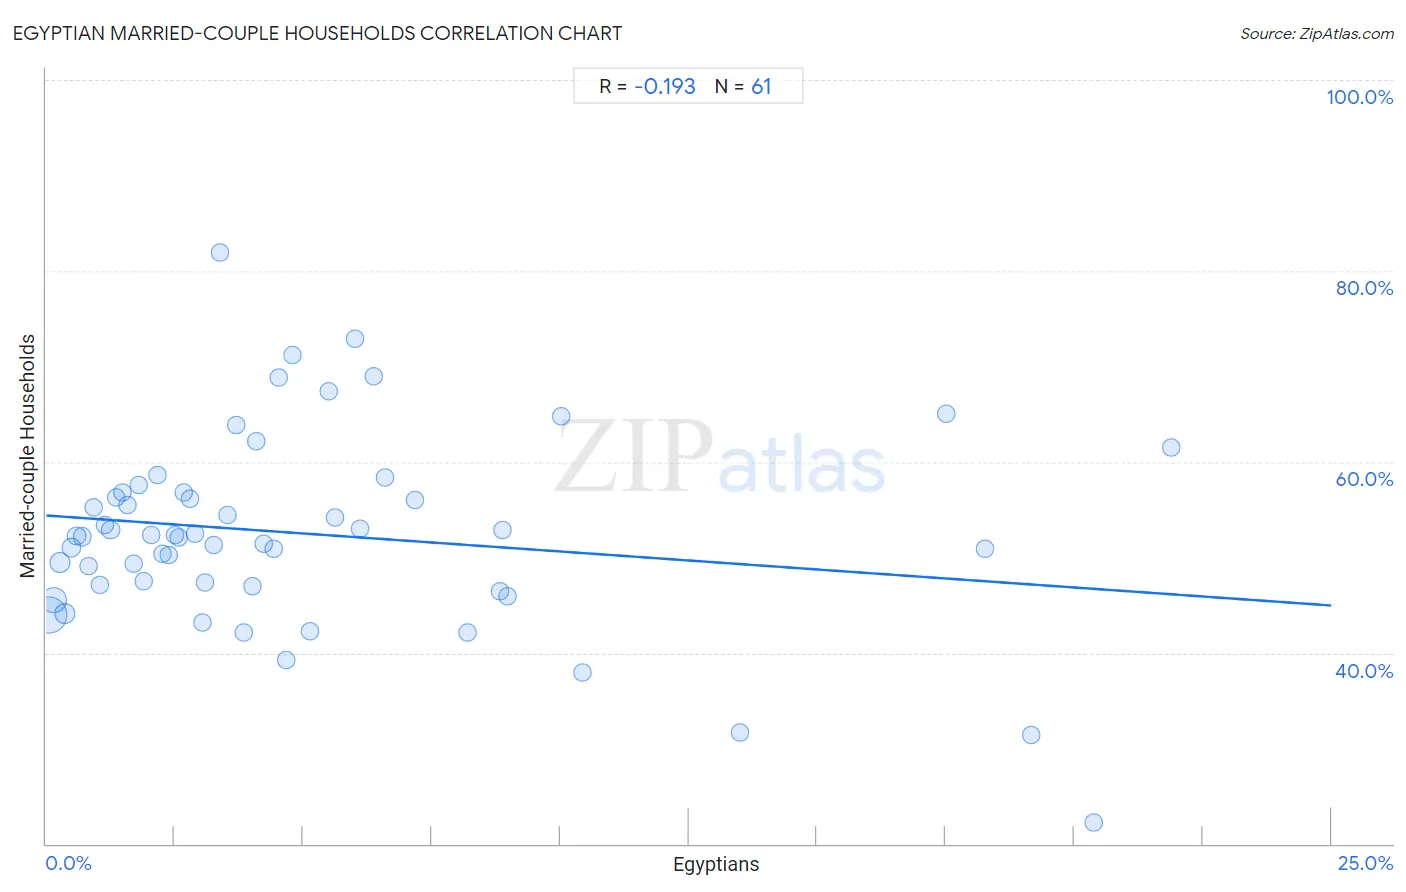
Egyptian Married-couple Households Correlation Chart
The statistical analysis conducted on geographies consisting of 276,761,742 people shows a poor negative correlation between the proportion of Egyptians and percentage of married-couple family households in the United States with a correlation coefficient (R) of -0.193 and weighted average of 48.2%. On average, for every 1% (one percent) increase in Egyptians within a typical geography, there is a decrease of 0.38% in percentage of married-couple family households.
It is essential to understand that the correlation between the percentage of Egyptians and percentage of married-couple family households does not imply a direct cause-and-effect relationship. It remains uncertain whether the presence of Egyptians influences an upward or downward trend in the level of percentage of married-couple family households within an area, or if Egyptians simply ended up residing in those areas with higher or lower levels of percentage of married-couple family households due to other factors.
Demographics Similar to Egyptians by Married-couple Households
In terms of married-couple households, the demographic groups most similar to Egyptians are Immigrants from Netherlands (48.2%, a difference of 0.010%), Canadian (48.2%, a difference of 0.020%), Russian (48.2%, a difference of 0.030%), Finnish (48.1%, a difference of 0.090%), and Immigrants from England (48.2%, a difference of 0.12%).
| Demographics | Rating | Rank | Married-couple Households |
| Laotians | 98.8 /100 | #71 | Exceptional 48.4% |
| Scotch-Irish | 98.6 /100 | #72 | Exceptional 48.3% |
| Immigrants from Singapore | 98.6 /100 | #73 | Exceptional 48.3% |
| Immigrants from Romania | 98.6 /100 | #74 | Exceptional 48.3% |
| Immigrants from England | 98.4 /100 | #75 | Exceptional 48.2% |
| Immigrants from Fiji | 98.4 /100 | #76 | Exceptional 48.2% |
| Canadians | 98.2 /100 | #77 | Exceptional 48.2% |
| Egyptians | 98.2 /100 | #78 | Exceptional 48.2% |
| Immigrants from Netherlands | 98.2 /100 | #79 | Exceptional 48.2% |
| Russians | 98.1 /100 | #80 | Exceptional 48.2% |
| Finns | 98.0 /100 | #81 | Exceptional 48.1% |
| Immigrants from Poland | 97.7 /100 | #82 | Exceptional 48.1% |
| Guamanians/Chamorros | 97.6 /100 | #83 | Exceptional 48.1% |
| Ukrainians | 97.6 /100 | #84 | Exceptional 48.1% |
| Immigrants from Israel | 97.4 /100 | #85 | Exceptional 48.0% |
Egyptian Married-couple Households Correlation Summary
| Measurement | Egyptian Data | Married-couple Households Data |
| Minimum | 0.048% | 22.2% |
| Maximum | 21.9% | 82.0% |
| Range | 21.8% | 59.7% |
| Mean | 5.1% | 52.5% |
| Median | 3.4% | 52.3% |
| Interquartile 25% (IQ1) | 1.6% | 47.0% |
| Interquartile 75% (IQ3) | 6.2% | 56.8% |
| Interquartile Range (IQR) | 4.6% | 9.8% |
| Standard Deviation (Sample) | 5.2% | 10.2% |
| Standard Deviation (Population) | 5.2% | 10.1% |
Correlation Details
| Egyptian Percentile | Sample Size | Married-couple Households |
[ 0.0% - 0.5% ] 0.048% | 148,540,911 | 44.0% |
[ 0.0% - 0.5% ] 0.16% | 57,313,099 | 45.5% |
[ 0.0% - 0.5% ] 0.27% | 20,107,944 | 49.5% |
[ 0.0% - 0.5% ] 0.36% | 22,776,039 | 44.1% |
[ 0.0% - 0.5% ] 0.49% | 7,447,302 | 51.0% |
[ 0.5% - 1.0% ] 0.60% | 4,831,139 | 52.3% |
[ 0.5% - 1.0% ] 0.70% | 3,225,676 | 52.2% |
[ 0.5% - 1.0% ] 0.82% | 2,417,282 | 49.1% |
[ 0.5% - 1.0% ] 0.93% | 1,797,091 | 55.3% |
[ 1.0% - 1.5% ] 1.04% | 1,983,146 | 47.1% |
[ 1.0% - 1.5% ] 1.14% | 855,863 | 53.4% |
[ 1.0% - 1.5% ] 1.25% | 676,576 | 52.9% |
[ 1.0% - 1.5% ] 1.35% | 775,907 | 56.2% |
[ 1.0% - 1.5% ] 1.48% | 391,296 | 56.8% |
[ 1.5% - 2.0% ] 1.59% | 416,568 | 55.5% |
[ 1.5% - 2.0% ] 1.69% | 513,256 | 49.4% |
[ 1.5% - 2.0% ] 1.80% | 290,694 | 57.6% |
[ 1.5% - 2.0% ] 1.89% | 742,845 | 47.5% |
[ 2.0% - 2.5% ] 2.04% | 262,183 | 52.4% |
[ 2.0% - 2.5% ] 2.16% | 122,258 | 58.6% |
[ 2.0% - 2.5% ] 2.27% | 28,023 | 50.4% |
[ 2.0% - 2.5% ] 2.38% | 75,833 | 50.3% |
[ 2.5% - 3.0% ] 2.51% | 9,255 | 52.4% |
[ 2.5% - 3.0% ] 2.58% | 159,607 | 52.0% |
[ 2.5% - 3.0% ] 2.66% | 145,756 | 56.8% |
[ 2.5% - 3.0% ] 2.79% | 96,434 | 56.2% |
[ 2.5% - 3.0% ] 2.90% | 3,965 | 52.5% |
[ 3.0% - 3.5% ] 3.03% | 77,913 | 43.1% |
[ 3.0% - 3.5% ] 3.10% | 113,794 | 47.3% |
[ 3.0% - 3.5% ] 3.25% | 9,596 | 51.3% |
[ 3.0% - 3.5% ] 3.38% | 5,444 | 82.0% |
[ 3.5% - 4.0% ] 3.53% | 18,086 | 54.4% |
[ 3.5% - 4.0% ] 3.70% | 81 | 63.9% |
[ 3.5% - 4.0% ] 3.83% | 58,053 | 42.2% |
[ 4.0% - 4.5% ] 4.01% | 5,835 | 46.9% |
[ 4.0% - 4.5% ] 4.09% | 60,303 | 62.2% |
[ 4.0% - 4.5% ] 4.22% | 13,070 | 51.4% |
[ 4.0% - 4.5% ] 4.44% | 36,823 | 50.9% |
[ 4.5% - 5.0% ] 4.52% | 155 | 68.9% |
[ 4.5% - 5.0% ] 4.67% | 52,230 | 39.3% |
[ 4.5% - 5.0% ] 4.79% | 4,782 | 71.2% |
[ 5.0% - 5.5% ] 5.13% | 99,800 | 42.2% |
[ 5.0% - 5.5% ] 5.49% | 601 | 67.4% |
[ 5.5% - 6.0% ] 5.61% | 659 | 54.2% |
[ 5.5% - 6.0% ] 5.99% | 3,553 | 72.9% |
[ 6.0% - 6.5% ] 6.10% | 6,952 | 52.9% |
[ 6.0% - 6.5% ] 6.36% | 14,518 | 68.9% |
[ 6.5% - 7.0% ] 6.59% | 8,410 | 58.4% |
[ 7.0% - 7.5% ] 7.17% | 7,017 | 56.0% |
[ 8.0% - 8.5% ] 8.20% | 140,994 | 42.2% |
[ 8.5% - 9.0% ] 8.83% | 1,155 | 46.4% |
[ 8.5% - 9.0% ] 8.89% | 1,429 | 52.9% |
[ 8.5% - 9.0% ] 8.97% | 747 | 45.9% |
[ 10.0% - 10.5% ] 10.02% | 5,751 | 64.7% |
[ 10.0% - 10.5% ] 10.44% | 5,000 | 38.0% |
[ 13.0% - 13.5% ] 13.49% | 1,394 | 31.6% |
[ 17.0% - 17.5% ] 17.50% | 120 | 65.0% |
[ 18.0% - 18.5% ] 18.26% | 241 | 50.8% |
[ 19.0% - 19.5% ] 19.16% | 981 | 31.3% |
[ 20.0% - 20.5% ] 20.38% | 211 | 22.2% |
[ 21.5% - 22.0% ] 21.88% | 96 | 61.5% |