Crow Disability Age 5 to 17
COMPARE
Crow
Select to Compare
Disability Age 5 to 17
Crow Disability Age 5 to 17
5.4%
DISABILITY | AGE 5 TO 17
95.0/ 100
METRIC RATING
124th/ 347
METRIC RANK
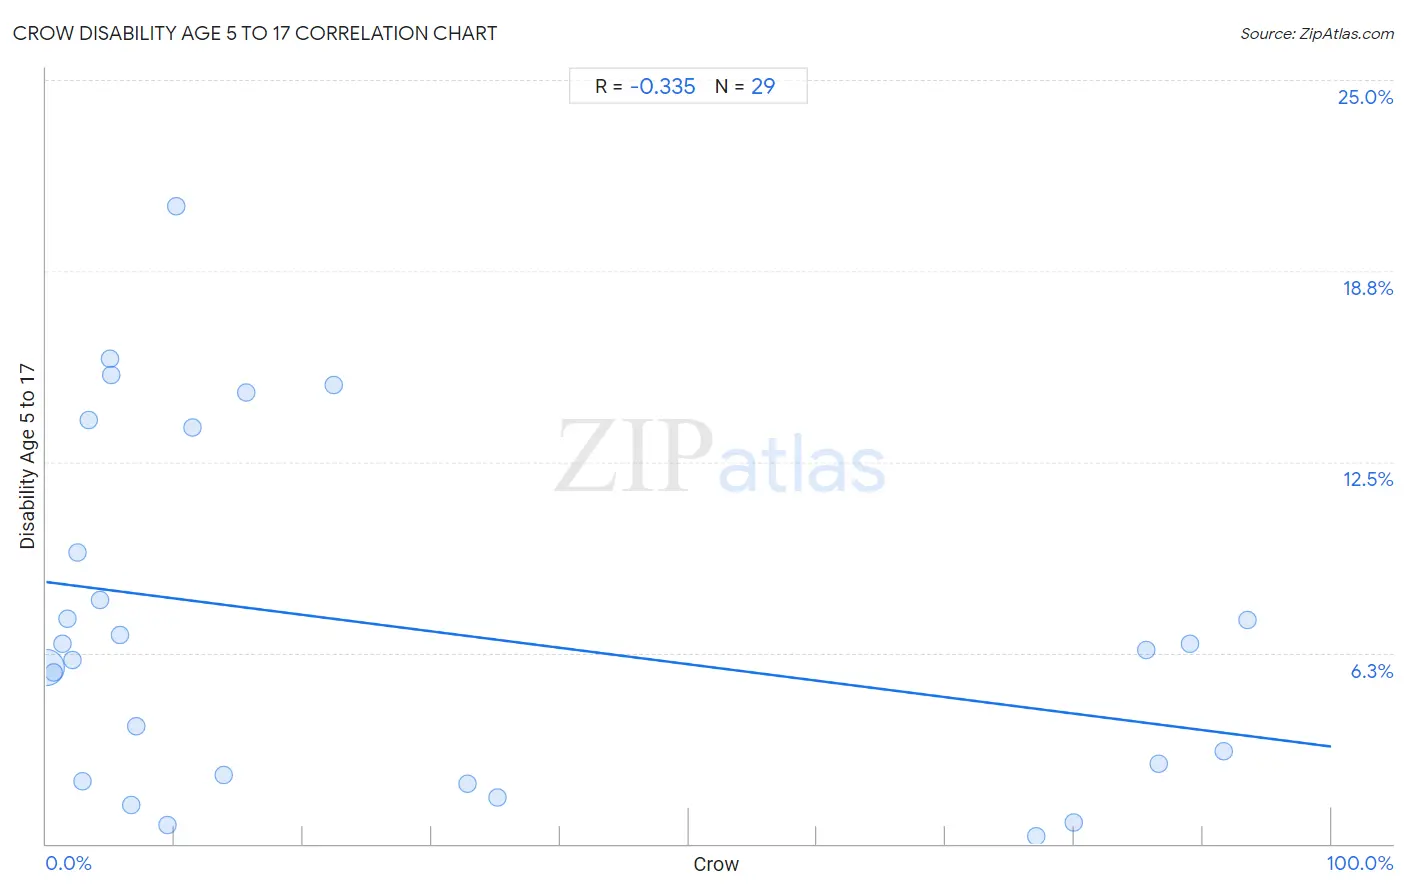
Crow Disability Age 5 to 17 Correlation Chart
The statistical analysis conducted on geographies consisting of 59,063,912 people shows a mild negative correlation between the proportion of Crow and percentage of population with a disability between the ages 5 and 17 in the United States with a correlation coefficient (R) of -0.335 and weighted average of 5.4%. On average, for every 1% (one percent) increase in Crow within a typical geography, there is a decrease of 0.054% in percentage of population with a disability between the ages 5 and 17.
It is essential to understand that the correlation between the percentage of Crow and percentage of population with a disability between the ages 5 and 17 does not imply a direct cause-and-effect relationship. It remains uncertain whether the presence of Crow influences an upward or downward trend in the level of percentage of population with a disability between the ages 5 and 17 within an area, or if Crow simply ended up residing in those areas with higher or lower levels of percentage of population with a disability between the ages 5 and 17 due to other factors.
Demographics Similar to Crow by Disability Age 5 to 17
In terms of disability age 5 to 17, the demographic groups most similar to Crow are Immigrants from Chile (5.4%, a difference of 0.010%), New Zealander (5.4%, a difference of 0.020%), Latvian (5.4%, a difference of 0.030%), Immigrants from Ethiopia (5.4%, a difference of 0.13%), and Immigrants from Venezuela (5.4%, a difference of 0.14%).
| Demographics | Rating | Rank | Disability Age 5 to 17 |
| Immigrants from Afghanistan | 97.4 /100 | #117 | Exceptional 5.3% |
| South Americans | 97.1 /100 | #118 | Exceptional 5.4% |
| Immigrants from South America | 97.1 /100 | #119 | Exceptional 5.4% |
| Immigrants | 97.0 /100 | #120 | Exceptional 5.4% |
| Maltese | 96.0 /100 | #121 | Exceptional 5.4% |
| Chileans | 95.8 /100 | #122 | Exceptional 5.4% |
| Immigrants from Ethiopia | 95.5 /100 | #123 | Exceptional 5.4% |
| Crow | 95.0 /100 | #124 | Exceptional 5.4% |
| Immigrants from Chile | 95.0 /100 | #125 | Exceptional 5.4% |
| New Zealanders | 95.0 /100 | #126 | Exceptional 5.4% |
| Latvians | 95.0 /100 | #127 | Exceptional 5.4% |
| Immigrants from Venezuela | 94.5 /100 | #128 | Exceptional 5.4% |
| Romanians | 94.1 /100 | #129 | Exceptional 5.4% |
| Immigrants from Bulgaria | 94.0 /100 | #130 | Exceptional 5.4% |
| Arabs | 92.9 /100 | #131 | Exceptional 5.4% |
Crow Disability Age 5 to 17 Correlation Summary
| Measurement | Crow Data | Disability Age 5 to 17 Data |
| Minimum | 0.023% | 0.26% |
| Maximum | 93.4% | 20.9% |
| Range | 93.4% | 20.6% |
| Mean | 27.6% | 7.1% |
| Median | 9.4% | 6.4% |
| Interquartile 25% (IQ1) | 3.1% | 2.1% |
| Interquartile 75% (IQ3) | 56.1% | 11.6% |
| Interquartile Range (IQR) | 53.1% | 9.4% |
| Standard Deviation (Sample) | 34.8% | 5.6% |
| Standard Deviation (Population) | 34.2% | 5.5% |
Correlation Details
| Crow Percentile | Sample Size | Disability Age 5 to 17 |
[ 0.0% - 0.5% ] 0.023% | 58,452,927 | 5.8% |
[ 0.5% - 1.0% ] 0.59% | 272,765 | 5.6% |
[ 1.0% - 1.5% ] 1.26% | 153,350 | 6.6% |
[ 1.5% - 2.0% ] 1.63% | 81,313 | 7.4% |
[ 2.0% - 2.5% ] 2.05% | 4,535 | 6.0% |
[ 2.0% - 2.5% ] 2.45% | 49,048 | 9.5% |
[ 2.5% - 3.0% ] 2.84% | 1,584 | 2.0% |
[ 3.0% - 3.5% ] 3.26% | 10,830 | 13.9% |
[ 4.0% - 4.5% ] 4.21% | 926 | 8.0% |
[ 4.5% - 5.0% ] 4.98% | 4,860 | 15.9% |
[ 5.0% - 5.5% ] 5.10% | 1,019 | 15.3% |
[ 5.5% - 6.0% ] 5.76% | 1,440 | 6.8% |
[ 6.5% - 7.0% ] 6.61% | 4,223 | 1.3% |
[ 6.5% - 7.0% ] 7.00% | 729 | 3.8% |
[ 9.0% - 9.5% ] 9.45% | 2,064 | 0.60% |
[ 10.0% - 10.5% ] 10.08% | 2,817 | 20.9% |
[ 11.0% - 11.5% ] 11.36% | 176 | 13.6% |
[ 13.5% - 14.0% ] 13.79% | 428 | 2.2% |
[ 15.5% - 16.0% ] 15.56% | 1,125 | 14.8% |
[ 22.0% - 22.5% ] 22.35% | 783 | 15.0% |
[ 32.5% - 33.0% ] 32.74% | 3,803 | 2.0% |
[ 35.0% - 35.5% ] 35.12% | 5,199 | 1.5% |
[ 77.0% - 77.5% ] 77.09% | 1,602 | 0.26% |
[ 79.5% - 80.0% ] 79.96% | 459 | 0.71% |
[ 85.5% - 86.0% ] 85.61% | 660 | 6.4% |
[ 86.5% - 87.0% ] 86.61% | 2,180 | 2.6% |
[ 89.0% - 89.5% ] 89.03% | 629 | 6.5% |
[ 91.5% - 92.0% ] 91.65% | 1,965 | 3.0% |
[ 93.0% - 93.5% ] 93.45% | 473 | 7.3% |