Crow GED/Equivalency

COMPARE

Crow
Race
Ancestry
AfghanAfricanAlaska NativeAlaskan AthabascanAlbanianAleutAlsatianAmericanApacheArabArapahoArgentineanArmenianAssyrian/Chaldean/SyriacAustralianAustrianBahamianBangladeshiBarbadianBasqueBelgianBelizeanBermudanBhutaneseBlackfeetBolivianBrazilianBritishBritish West IndianBulgarianBurmeseCajunCambodianCanadianCape VerdeanCarpatho RusynCelticCentral AmericanCentral American IndianCherokeeCheyenneChickasawChileanChineseChippewaChoctawColombianColvilleComancheCosta RicanCreeCreekCroatianCrowCubanCypriotCzechCzechoslovakianDanishDelawareDominicanDutchDutch West IndianEastern EuropeanEcuadorianEgyptianEnglishEstonianEthiopianEuropeanFijianFilipinoFinnishFrenchFrench American IndianFrench CanadianGermanGerman RussianGhanaianGreekGuamanian/ChamorroGuatemalanGuyaneseHaitianHmongHonduranHopiHoumaHungarianIcelanderIndian (Asian)IndonesianInupiatIranianIraqiIrishIroquoisIsraeliItalianJamaicanJapaneseJordanianKenyanKiowaKoreanLaotianLatvianLebaneseLiberianLithuanianLumbeeLuxembourgerMacedonianMalaysianMalteseMarshalleseMenomineeMexicanMexican American IndianMongolianMoroccanNative HawaiianNavajoNepaleseNew ZealanderNicaraguanNigerianNorthern EuropeanNorwegianOkinawanOsageOttawaPaiutePakistaniPalestinianPanamanianParaguayanPennsylvania GermanPeruvianPimaPolishPortuguesePotawatomiPuebloPuerto RicanPuget Sound SalishRomanianRussianSalvadoranSamoanScandinavianScotch-IrishScottishSeminoleSenegaleseSerbianShoshoneSierra LeoneanSiouxSlavicSlovakSloveneSomaliSouth AfricanSouth AmericanSouth American IndianSoviet UnionSpaniardSpanishSpanish AmericanSpanish American IndianSri LankanSubsaharan AfricanSudaneseSwedishSwissSyrianTaiwaneseThaiTlingit-HaidaTohono O'OdhamTonganTrinidadian and TobagonianTsimshianTurkishU.S. Virgin IslanderUgandanUkrainianUruguayanUteVenezuelanVietnameseWelshWest IndianYakamaYaquiYugoslavianYumanYup'ikZimbabwean
Immigration
NonimmigrantsImmigrantsAfghanistanAfricaAlbaniaArgentinaArmeniaAsiaAustraliaAustriaBahamasBangladeshBarbadosBelarusBelgiumBelizeBoliviaBosnia and HerzegovinaBrazilBulgariaBurma/MyanmarCabo VerdeCambodiaCameroonCanadaCaribbeanCentral AmericaChileChinaColombiaCongoCosta RicaCroatiaCubaCzechoslovakiaDenmarkDominicaDominican RepublicEastern AfricaEastern AsiaEastern EuropeEcuadorEgyptEl SalvadorEnglandEritreaEthiopiaEuropeFijiFranceGermanyGhanaGreeceGrenadaGuatemalaGuyanaHaitiHondurasHong KongHungaryIndiaIndonesiaIranIraqIrelandIsraelItalyJamaicaJapanJordanKazakhstanKenyaKoreaKuwaitLaosLatin AmericaLatviaLebanonLiberiaLithuaniaMalaysiaMexicoMicronesiaMiddle AfricaMoldovaMoroccoNepalNetherlandsNicaraguaNigeriaNorth AmericaNorth MacedoniaNorthern AfricaNorthern EuropeNorwayOceaniaPakistanPanamaPeruPhilippinesPolandPortugalRomaniaRussiaSaudi ArabiaScotlandSenegalSerbiaSierra LeoneSingaporeSomaliaSouth AfricaSouth AmericaSouth Central AsiaSouth Eastern AsiaSouthern EuropeSpainSri LankaSt. Vincent and the GrenadinesSudanSwedenSwitzerlandSyriaTaiwanThailandTrinidad and TobagoTurkeyUgandaUkraineUruguayUzbekistanVenezuelaVietnamWest IndiesWestern AfricaWestern AsiaWestern EuropeYemenZaireZimbabweAzores
Select to Compare
Race
Ancestry
AfghanAfricanAlaska NativeAlaskan AthabascanAlbanianAleutAlsatianAmericanApacheArabArapahoArgentineanArmenianAssyrian/Chaldean/SyriacAustralianAustrianBahamianBangladeshiBarbadianBasqueBelgianBelizeanBermudanBhutaneseBlackfeetBolivianBrazilianBritishBritish West IndianBulgarianBurmeseCajunCambodianCanadianCape VerdeanCarpatho RusynCelticCentral AmericanCentral American IndianCherokeeCheyenneChickasawChileanChineseChippewaChoctawColombianColvilleComancheCosta RicanCreeCreekCroatianCubanCypriotCzechCzechoslovakianDanishDelawareDominicanDutchDutch West IndianEastern EuropeanEcuadorianEgyptianEnglishEstonianEthiopianEuropeanFijianFilipinoFinnishFrenchFrench American IndianFrench CanadianGermanGerman RussianGhanaianGreekGuamanian/ChamorroGuatemalanGuyaneseHaitianHmongHonduranHopiHoumaHungarianIcelanderIndian (Asian)IndonesianInupiatIranianIraqiIrishIroquoisIsraeliItalianJamaicanJapaneseJordanianKenyanKiowaKoreanLaotianLatvianLebaneseLiberianLithuanianLumbeeLuxembourgerMacedonianMalaysianMalteseMarshalleseMenomineeMexicanMexican American IndianMongolianMoroccanNative HawaiianNavajoNepaleseNew ZealanderNicaraguanNigerianNorthern EuropeanNorwegianOkinawanOsageOttawaPaiutePakistaniPalestinianPanamanianParaguayanPennsylvania GermanPeruvianPimaPolishPortuguesePotawatomiPuebloPuerto RicanPuget Sound SalishRomanianRussianSalvadoranSamoanScandinavianScotch-IrishScottishSeminoleSenegaleseSerbianShoshoneSierra LeoneanSiouxSlavicSlovakSloveneSomaliSouth AfricanSouth AmericanSouth American IndianSoviet UnionSpaniardSpanishSpanish AmericanSpanish American IndianSri LankanSubsaharan AfricanSudaneseSwedishSwissSyrianTaiwaneseThaiTlingit-HaidaTohono O'OdhamTonganTrinidadian and TobagonianTsimshianTurkishU.S. Virgin IslanderUgandanUkrainianUruguayanUteVenezuelanVietnameseWelshWest IndianYakamaYaquiYugoslavianYumanYup'ikZimbabwean
Immigration
NonimmigrantsImmigrantsAfghanistanAfricaAlbaniaArgentinaArmeniaAsiaAustraliaAustriaBahamasBangladeshBarbadosBelarusBelgiumBelizeBoliviaBosnia and HerzegovinaBrazilBulgariaBurma/MyanmarCabo VerdeCambodiaCameroonCanadaCaribbeanCentral AmericaChileChinaColombiaCongoCosta RicaCroatiaCubaCzechoslovakiaDenmarkDominicaDominican RepublicEastern AfricaEastern AsiaEastern EuropeEcuadorEgyptEl SalvadorEnglandEritreaEthiopiaEuropeFijiFranceGermanyGhanaGreeceGrenadaGuatemalaGuyanaHaitiHondurasHong KongHungaryIndiaIndonesiaIranIraqIrelandIsraelItalyJamaicaJapanJordanKazakhstanKenyaKoreaKuwaitLaosLatin AmericaLatviaLebanonLiberiaLithuaniaMalaysiaMexicoMicronesiaMiddle AfricaMoldovaMoroccoNepalNetherlandsNicaraguaNigeriaNorth AmericaNorth MacedoniaNorthern AfricaNorthern EuropeNorwayOceaniaPakistanPanamaPeruPhilippinesPolandPortugalRomaniaRussiaSaudi ArabiaScotlandSenegalSerbiaSierra LeoneSingaporeSomaliaSouth AfricaSouth AmericaSouth Central AsiaSouth Eastern AsiaSouthern EuropeSpainSri LankaSt. Vincent and the GrenadinesSudanSwedenSwitzerlandSyriaTaiwanThailandTrinidad and TobagoTurkeyUgandaUkraineUruguayUzbekistanVenezuelaVietnamWest IndiesWestern AfricaWestern AsiaWestern EuropeYemenZaireZimbabweAzores
GED/Equivalency
Income
Poverty
Unemployment
Labor Participation
Family Structure
Vehicle Availability
Education Level
Disability

Crow GED/Equivalency
Tragic

83.8%
GED/EQUIVALENCY
1.1/ 100
METRIC RATING
249th/ 347
METRIC RANK

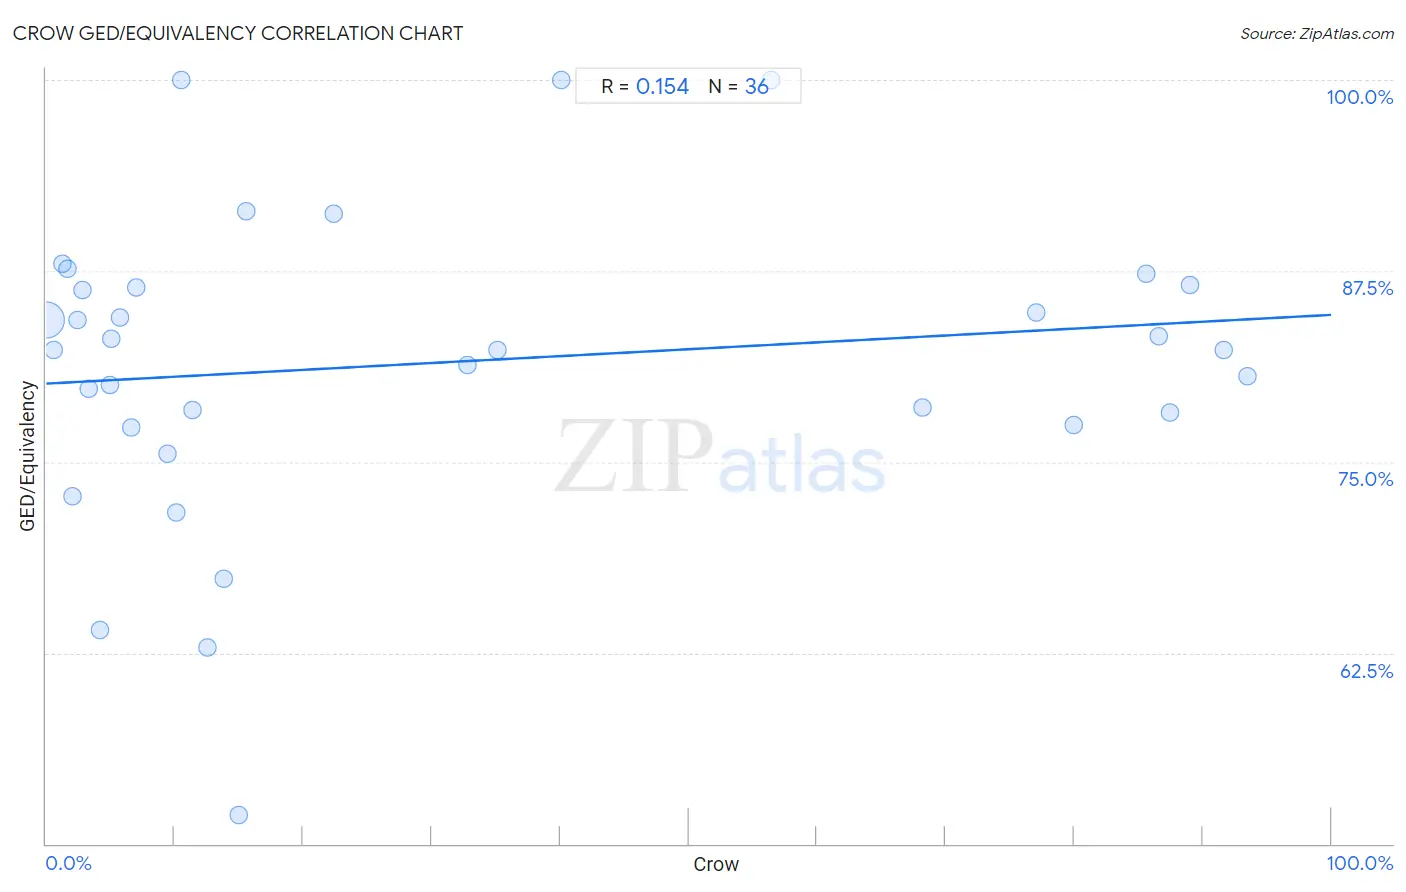
Crow GED/Equivalency Correlation Chart

The statistical analysis conducted on geographies consisting of 59,209,980 people shows a poor positive correlation between the proportion of Crow and percentage of population with at least ged/equivalency education in the United States with a correlation coefficient (R) of 0.154 and weighted average of 83.8%. On average, for every 1% (one percent) increase in Crow within a typical geography, there is an increase of 0.045% in percentage of population with at least ged/equivalency education.
Crow GED/Equivalency
It is essential to understand that the correlation between the percentage of Crow and percentage of population with at least ged/equivalency education does not imply a direct cause-and-effect relationship. It remains uncertain whether the presence of Crow influences an upward or downward trend in the level of percentage of population with at least ged/equivalency education within an area, or if Crow simply ended up residing in those areas with higher or lower levels of percentage of population with at least ged/equivalency education due to other factors.

Demographics Similar to Crow by GED/Equivalency

In terms of ged/equivalency, the demographic groups most similar to Crow are Blackfeet (83.8%, a difference of 0.010%), Immigrants from Western Africa (83.8%, a difference of 0.020%), Shoshone (83.7%, a difference of 0.020%), Chickasaw (83.8%, a difference of 0.050%), and Immigrants from Senegal (83.8%, a difference of 0.080%).
DemographicsRating | RankGED/Equivalency
Sri Lankans
1.9
/100
|
#242
Tragic
84.0%
Cherokee
1.3
/100
|
#243
Tragic
83.9%
Immigrants from Ghana
1.3
/100
|
#244
Tragic
83.9%
Immigrants from Senegal
1.2
/100
|
#245
Tragic
83.8%
Chickasaw
1.2
/100
|
#246
Tragic
83.8%
Immigrants from Western Africa
1.1
/100
|
#247
Tragic
83.8%
Blackfeet
1.1
/100
|
#248
Tragic
83.8%
Crow
1.1
/100
|
#249
Tragic
83.8%
Shoshone
1.0
/100
|
#250
Tragic
83.7%
Spanish Americans
0.8
/100
|
#251
Tragic
83.6%
Bahamians
0.8
/100
|
#252
Tragic
83.6%
Comanche
0.7
/100
|
#253
Tragic
83.6%
Creek
0.7
/100
|
#254
Tragic
83.6%
Colville
0.5
/100
|
#255
Tragic
83.4%
Africans
0.5
/100
|
#256
Tragic
83.4%

Crow GED/Equivalency Correlation Summary

MeasurementCrow DataGED/Equivalency Data
Minimum0.023%51.9%
Maximum93.4%100.0%
Range93.4%48.1%
Mean30.3%81.5%
Median11.9%82.3%
Interquartile 25% (IQ1)4.6%77.9%
Interquartile 75% (IQ3)62.3%86.5%
Interquartile Range (IQR)57.7%8.6%
Standard Deviation (Sample)34.0%9.9%
Standard Deviation (Population)33.5%9.8%

Correlation Details

Crow PercentileSample SizeGED/Equivalency
[
0.0%
-
0.5%
]
0.023%
58,544,73484.3%
[
0.5%
-
1.0%
]
0.59%
294,82782.3%
[
1.0%
-
1.5%
]
1.26%
166,10388.0%
[
1.5%
-
2.0%
]
1.61%
93,41787.6%
[
2.0%
-
2.5%
]
2.07%
7,19272.8%
[
2.0%
-
2.5%
]
2.45%
49,25384.3%
[
2.5%
-
3.0%
]
2.87%
2,12986.3%
[
3.0%
-
3.5%
]
3.26%
11,59879.8%
[
4.0%
-
4.5%
]
4.23%
1,56064.0%
[
4.5%
-
5.0%
]
4.97%
5,27680.0%
[
5.0%
-
5.5%
]
5.10%
1,01983.1%
[
5.5%
-
6.0%
]
5.79%
1,95384.5%
[
6.5%
-
7.0%
]
6.61%
4,22377.2%
[
7.0%
-
7.5%
]
7.01%
78586.4%
[
9.0%
-
9.5%
]
9.45%
2,06475.5%
[
10.0%
-
10.5%
]
10.08%
2,81771.7%
[
10.5%
-
11.0%
]
10.53%
190100.0%
[
11.0%
-
11.5%
]
11.36%
17678.4%
[
12.0%
-
12.5%
]
12.50%
4862.9%
[
13.5%
-
14.0%
]
13.79%
42867.4%
[
15.0%
-
15.5%
]
15.00%
4051.9%
[
15.5%
-
16.0%
]
15.56%
1,12591.4%
[
22.0%
-
22.5%
]
22.35%
78391.2%
[
32.5%
-
33.0%
]
32.75%
3,98581.3%
[
35.0%
-
35.5%
]
35.12%
5,19982.3%
[
40.0%
-
40.5%
]
40.12%
172100.0%
[
56.0%
-
56.5%
]
56.41%
78100.0%
[
68.0%
-
68.5%
]
68.23%
57678.6%
[
77.0%
-
77.5%
]
77.09%
1,60284.8%
[
79.5%
-
80.0%
]
79.96%
45977.4%
[
85.5%
-
86.0%
]
85.61%
66087.3%
[
86.5%
-
87.0%
]
86.61%
2,18083.2%
[
87.0%
-
87.5%
]
87.40%
26278.3%
[
89.0%
-
89.5%
]
89.03%
62986.5%
[
91.5%
-
92.0%
]
91.65%
1,96582.3%
[
93.0%
-
93.5%
]
93.45%
47380.6%