Crow 4 or more Vehicles in Household

COMPARE

Crow
Race
Ancestry
AfghanAfricanAlaska NativeAlaskan AthabascanAlbanianAleutAlsatianAmericanApacheArabArapahoArgentineanArmenianAssyrian/Chaldean/SyriacAustralianAustrianBahamianBangladeshiBarbadianBasqueBelgianBelizeanBermudanBhutaneseBlackfeetBolivianBrazilianBritishBritish West IndianBulgarianBurmeseCajunCambodianCanadianCape VerdeanCarpatho RusynCelticCentral AmericanCentral American IndianCherokeeCheyenneChickasawChileanChineseChippewaChoctawColombianColvilleComancheCosta RicanCreeCreekCroatianCrowCubanCypriotCzechCzechoslovakianDanishDelawareDominicanDutchDutch West IndianEastern EuropeanEcuadorianEgyptianEnglishEstonianEthiopianEuropeanFijianFilipinoFinnishFrenchFrench American IndianFrench CanadianGermanGerman RussianGhanaianGreekGuamanian/ChamorroGuatemalanGuyaneseHaitianHmongHonduranHopiHoumaHungarianIcelanderIndian (Asian)IndonesianInupiatIranianIraqiIrishIroquoisIsraeliItalianJamaicanJapaneseJordanianKenyanKiowaKoreanLaotianLatvianLebaneseLiberianLithuanianLumbeeLuxembourgerMacedonianMalaysianMalteseMarshalleseMenomineeMexicanMexican American IndianMongolianMoroccanNative HawaiianNavajoNepaleseNew ZealanderNicaraguanNigerianNorthern EuropeanNorwegianOkinawanOsageOttawaPaiutePakistaniPalestinianPanamanianParaguayanPennsylvania GermanPeruvianPimaPolishPortuguesePotawatomiPuebloPuerto RicanPuget Sound SalishRomanianRussianSalvadoranSamoanScandinavianScotch-IrishScottishSeminoleSenegaleseSerbianShoshoneSierra LeoneanSiouxSlavicSlovakSloveneSomaliSouth AfricanSouth AmericanSouth American IndianSoviet UnionSpaniardSpanishSpanish AmericanSpanish American IndianSri LankanSubsaharan AfricanSudaneseSwedishSwissSyrianTaiwaneseThaiTlingit-HaidaTohono O'OdhamTonganTrinidadian and TobagonianTsimshianTurkishU.S. Virgin IslanderUgandanUkrainianUruguayanUteVenezuelanVietnameseWelshWest IndianYakamaYaquiYugoslavianYumanYup'ikZimbabwean
Immigration
NonimmigrantsImmigrantsAfghanistanAfricaAlbaniaArgentinaArmeniaAsiaAustraliaAustriaBahamasBangladeshBarbadosBelarusBelgiumBelizeBoliviaBosnia and HerzegovinaBrazilBulgariaBurma/MyanmarCabo VerdeCambodiaCameroonCanadaCaribbeanCentral AmericaChileChinaColombiaCongoCosta RicaCroatiaCubaCzechoslovakiaDenmarkDominicaDominican RepublicEastern AfricaEastern AsiaEastern EuropeEcuadorEgyptEl SalvadorEnglandEritreaEthiopiaEuropeFijiFranceGermanyGhanaGreeceGrenadaGuatemalaGuyanaHaitiHondurasHong KongHungaryIndiaIndonesiaIranIraqIrelandIsraelItalyJamaicaJapanJordanKazakhstanKenyaKoreaKuwaitLaosLatin AmericaLatviaLebanonLiberiaLithuaniaMalaysiaMexicoMicronesiaMiddle AfricaMoldovaMoroccoNepalNetherlandsNicaraguaNigeriaNorth AmericaNorth MacedoniaNorthern AfricaNorthern EuropeNorwayOceaniaPakistanPanamaPeruPhilippinesPolandPortugalRomaniaRussiaSaudi ArabiaScotlandSenegalSerbiaSierra LeoneSingaporeSomaliaSouth AfricaSouth AmericaSouth Central AsiaSouth Eastern AsiaSouthern EuropeSpainSri LankaSt. Vincent and the GrenadinesSudanSwedenSwitzerlandSyriaTaiwanThailandTrinidad and TobagoTurkeyUgandaUkraineUruguayUzbekistanVenezuelaVietnamWest IndiesWestern AfricaWestern AsiaWestern EuropeYemenZaireZimbabweAzores
Select to Compare
Race
Ancestry
AfghanAfricanAlaska NativeAlaskan AthabascanAlbanianAleutAlsatianAmericanApacheArabArapahoArgentineanArmenianAssyrian/Chaldean/SyriacAustralianAustrianBahamianBangladeshiBarbadianBasqueBelgianBelizeanBermudanBhutaneseBlackfeetBolivianBrazilianBritishBritish West IndianBulgarianBurmeseCajunCambodianCanadianCape VerdeanCarpatho RusynCelticCentral AmericanCentral American IndianCherokeeCheyenneChickasawChileanChineseChippewaChoctawColombianColvilleComancheCosta RicanCreeCreekCroatianCubanCypriotCzechCzechoslovakianDanishDelawareDominicanDutchDutch West IndianEastern EuropeanEcuadorianEgyptianEnglishEstonianEthiopianEuropeanFijianFilipinoFinnishFrenchFrench American IndianFrench CanadianGermanGerman RussianGhanaianGreekGuamanian/ChamorroGuatemalanGuyaneseHaitianHmongHonduranHopiHoumaHungarianIcelanderIndian (Asian)IndonesianInupiatIranianIraqiIrishIroquoisIsraeliItalianJamaicanJapaneseJordanianKenyanKiowaKoreanLaotianLatvianLebaneseLiberianLithuanianLumbeeLuxembourgerMacedonianMalaysianMalteseMarshalleseMenomineeMexicanMexican American IndianMongolianMoroccanNative HawaiianNavajoNepaleseNew ZealanderNicaraguanNigerianNorthern EuropeanNorwegianOkinawanOsageOttawaPaiutePakistaniPalestinianPanamanianParaguayanPennsylvania GermanPeruvianPimaPolishPortuguesePotawatomiPuebloPuerto RicanPuget Sound SalishRomanianRussianSalvadoranSamoanScandinavianScotch-IrishScottishSeminoleSenegaleseSerbianShoshoneSierra LeoneanSiouxSlavicSlovakSloveneSomaliSouth AfricanSouth AmericanSouth American IndianSoviet UnionSpaniardSpanishSpanish AmericanSpanish American IndianSri LankanSubsaharan AfricanSudaneseSwedishSwissSyrianTaiwaneseThaiTlingit-HaidaTohono O'OdhamTonganTrinidadian and TobagonianTsimshianTurkishU.S. Virgin IslanderUgandanUkrainianUruguayanUteVenezuelanVietnameseWelshWest IndianYakamaYaquiYugoslavianYumanYup'ikZimbabwean
Immigration
NonimmigrantsImmigrantsAfghanistanAfricaAlbaniaArgentinaArmeniaAsiaAustraliaAustriaBahamasBangladeshBarbadosBelarusBelgiumBelizeBoliviaBosnia and HerzegovinaBrazilBulgariaBurma/MyanmarCabo VerdeCambodiaCameroonCanadaCaribbeanCentral AmericaChileChinaColombiaCongoCosta RicaCroatiaCubaCzechoslovakiaDenmarkDominicaDominican RepublicEastern AfricaEastern AsiaEastern EuropeEcuadorEgyptEl SalvadorEnglandEritreaEthiopiaEuropeFijiFranceGermanyGhanaGreeceGrenadaGuatemalaGuyanaHaitiHondurasHong KongHungaryIndiaIndonesiaIranIraqIrelandIsraelItalyJamaicaJapanJordanKazakhstanKenyaKoreaKuwaitLaosLatin AmericaLatviaLebanonLiberiaLithuaniaMalaysiaMexicoMicronesiaMiddle AfricaMoldovaMoroccoNepalNetherlandsNicaraguaNigeriaNorth AmericaNorth MacedoniaNorthern AfricaNorthern EuropeNorwayOceaniaPakistanPanamaPeruPhilippinesPolandPortugalRomaniaRussiaSaudi ArabiaScotlandSenegalSerbiaSierra LeoneSingaporeSomaliaSouth AfricaSouth AmericaSouth Central AsiaSouth Eastern AsiaSouthern EuropeSpainSri LankaSt. Vincent and the GrenadinesSudanSwedenSwitzerlandSyriaTaiwanThailandTrinidad and TobagoTurkeyUgandaUkraineUruguayUzbekistanVenezuelaVietnamWest IndiesWestern AfricaWestern AsiaWestern EuropeYemenZaireZimbabweAzores
4 or more Vehicles in Household
Income
Poverty
Unemployment
Labor Participation
Family Structure
Vehicle Availability
Education Level
Disability

Crow 4 or more Vehicles in Household
Exceptional

7.8%
4+ VEHICLES AVAILABLE
100.0/ 100
METRIC RATING
46th/ 347
METRIC RANK

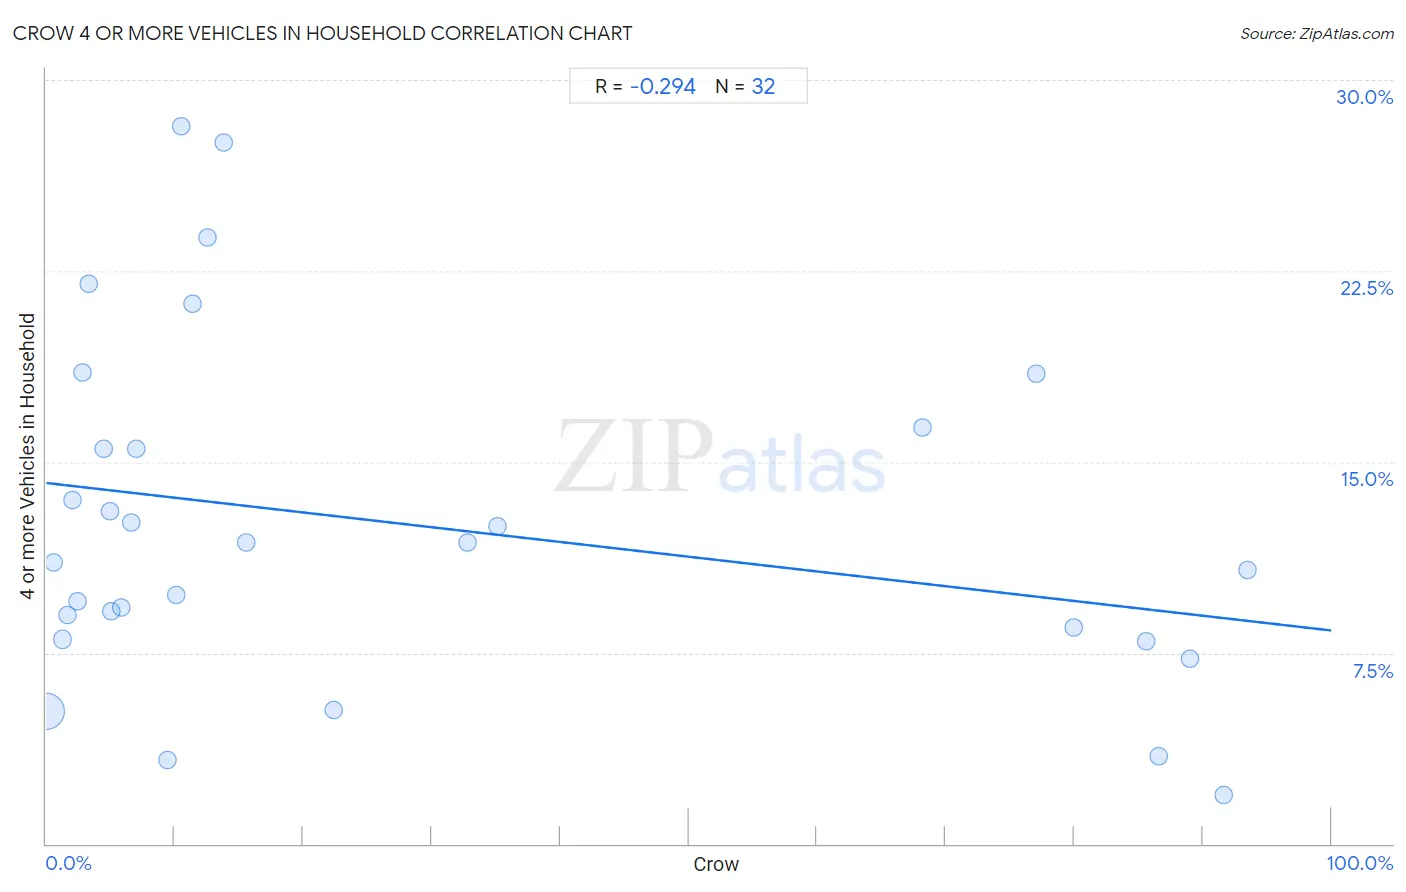
Crow 4 or more Vehicles in Household Correlation Chart

The statistical analysis conducted on geographies consisting of 59,198,453 people shows a weak negative correlation between the proportion of Crow and percentage of households with 4 or more vehicles available in the United States with a correlation coefficient (R) of -0.294 and weighted average of 7.8%. On average, for every 1% (one percent) increase in Crow within a typical geography, there is a decrease of 0.058% in percentage of households with 4 or more vehicles available.
Crow 4 or more Vehicles in Household
It is essential to understand that the correlation between the percentage of Crow and percentage of households with 4 or more vehicles available does not imply a direct cause-and-effect relationship. It remains uncertain whether the presence of Crow influences an upward or downward trend in the level of percentage of households with 4 or more vehicles available within an area, or if Crow simply ended up residing in those areas with higher or lower levels of percentage of households with 4 or more vehicles available due to other factors.

Demographics Similar to Crow by 4 or more Vehicles in Household

In terms of 4 or more vehicles in household, the demographic groups most similar to Crow are Osage (7.8%, a difference of 0.16%), Choctaw (7.8%, a difference of 0.17%), Bhutanese (7.8%, a difference of 0.22%), Swiss (7.8%, a difference of 0.34%), and Fijian (7.8%, a difference of 0.49%).
DemographicsRating | Rank4 or more Vehicles in Household
Spanish Americans
100.0
/100
|
#39
Exceptional
8.0%
Spanish
100.0
/100
|
#40
Exceptional
7.9%
Pima
100.0
/100
|
#41
Exceptional
7.9%
Salvadorans
100.0
/100
|
#42
Exceptional
7.8%
Fijians
100.0
/100
|
#43
Exceptional
7.8%
Bhutanese
100.0
/100
|
#44
Exceptional
7.8%
Choctaw
100.0
/100
|
#45
Exceptional
7.8%
Crow
100.0
/100
|
#46
Exceptional
7.8%
Osage
100.0
/100
|
#47
Exceptional
7.8%
Swiss
100.0
/100
|
#48
Exceptional
7.8%
Cherokee
100.0
/100
|
#49
Exceptional
7.7%
Immigrants from El Salvador
100.0
/100
|
#50
Exceptional
7.7%
Immigrants from Laos
100.0
/100
|
#51
Exceptional
7.7%
Japanese
100.0
/100
|
#52
Exceptional
7.7%
Malaysians
100.0
/100
|
#53
Exceptional
7.7%

Crow 4 or more Vehicles in Household Correlation Summary

MeasurementCrow Data4 or more Vehicles in Household Data
Minimum0.023%1.9%
Maximum93.4%28.2%
Range93.4%26.3%
Mean27.9%12.6%
Median10.3%11.4%
Interquartile 25% (IQ1)3.9%8.3%
Interquartile 75% (IQ3)51.7%15.9%
Interquartile Range (IQR)47.8%7.7%
Standard Deviation (Sample)34.1%6.7%
Standard Deviation (Population)33.5%6.6%

Correlation Details

Crow PercentileSample Size4 or more Vehicles in Household
[
0.0%
-
0.5%
]
0.023%
58,539,0505.2%
[
0.5%
-
1.0%
]
0.59%
293,50911.0%
[
1.0%
-
1.5%
]
1.26%
164,6308.0%
[
1.5%
-
2.0%
]
1.61%
92,7619.0%
[
2.0%
-
2.5%
]
2.07%
7,19213.5%
[
2.0%
-
2.5%
]
2.45%
49,1709.5%
[
2.5%
-
3.0%
]
2.86%
2,06518.5%
[
3.0%
-
3.5%
]
3.26%
11,59822.0%
[
4.0%
-
4.5%
]
4.46%
20215.5%
[
4.5%
-
5.0%
]
4.97%
5,27613.1%
[
5.0%
-
5.5%
]
5.10%
1,0199.1%
[
5.5%
-
6.0%
]
5.79%
1,7969.3%
[
6.5%
-
7.0%
]
6.61%
4,22312.6%
[
7.0%
-
7.5%
]
7.01%
78515.5%
[
9.0%
-
9.5%
]
9.45%
2,0643.3%
[
10.0%
-
10.5%
]
10.08%
2,8179.8%
[
10.5%
-
11.0%
]
10.53%
19028.2%
[
11.0%
-
11.5%
]
11.36%
17621.2%
[
12.0%
-
12.5%
]
12.50%
4823.8%
[
13.5%
-
14.0%
]
13.79%
42827.6%
[
15.5%
-
16.0%
]
15.56%
1,12511.8%
[
22.0%
-
22.5%
]
22.35%
7835.2%
[
32.5%
-
33.0%
]
32.74%
3,80311.8%
[
35.0%
-
35.5%
]
35.12%
5,19912.5%
[
68.0%
-
68.5%
]
68.23%
57616.3%
[
77.0%
-
77.5%
]
77.09%
1,60218.4%
[
79.5%
-
80.0%
]
79.96%
4598.5%
[
85.5%
-
86.0%
]
85.61%
6607.9%
[
86.5%
-
87.0%
]
86.61%
2,1803.4%
[
89.0%
-
89.5%
]
89.03%
6297.2%
[
91.5%
-
92.0%
]
91.65%
1,9651.9%
[
93.0%
-
93.5%
]
93.45%
47310.8%