Crow Male Disability
COMPARE
Crow
Select to Compare
Male Disability
Crow Male Disability
13.1%
DISABILITY | MALES
0.0/ 100
METRIC RATING
302nd/ 347
METRIC RANK
Crow Male Disability Correlation Chart
The statistical analysis conducted on geographies consisting of 59,204,441 people shows a mild negative correlation between the proportion of Crow and percentage of males with a disability in the United States with a correlation coefficient (R) of -0.363 and weighted average of 13.1%. On average, for every 1% (one percent) increase in Crow within a typical geography, there is a decrease of 0.071% in percentage of males with a disability.
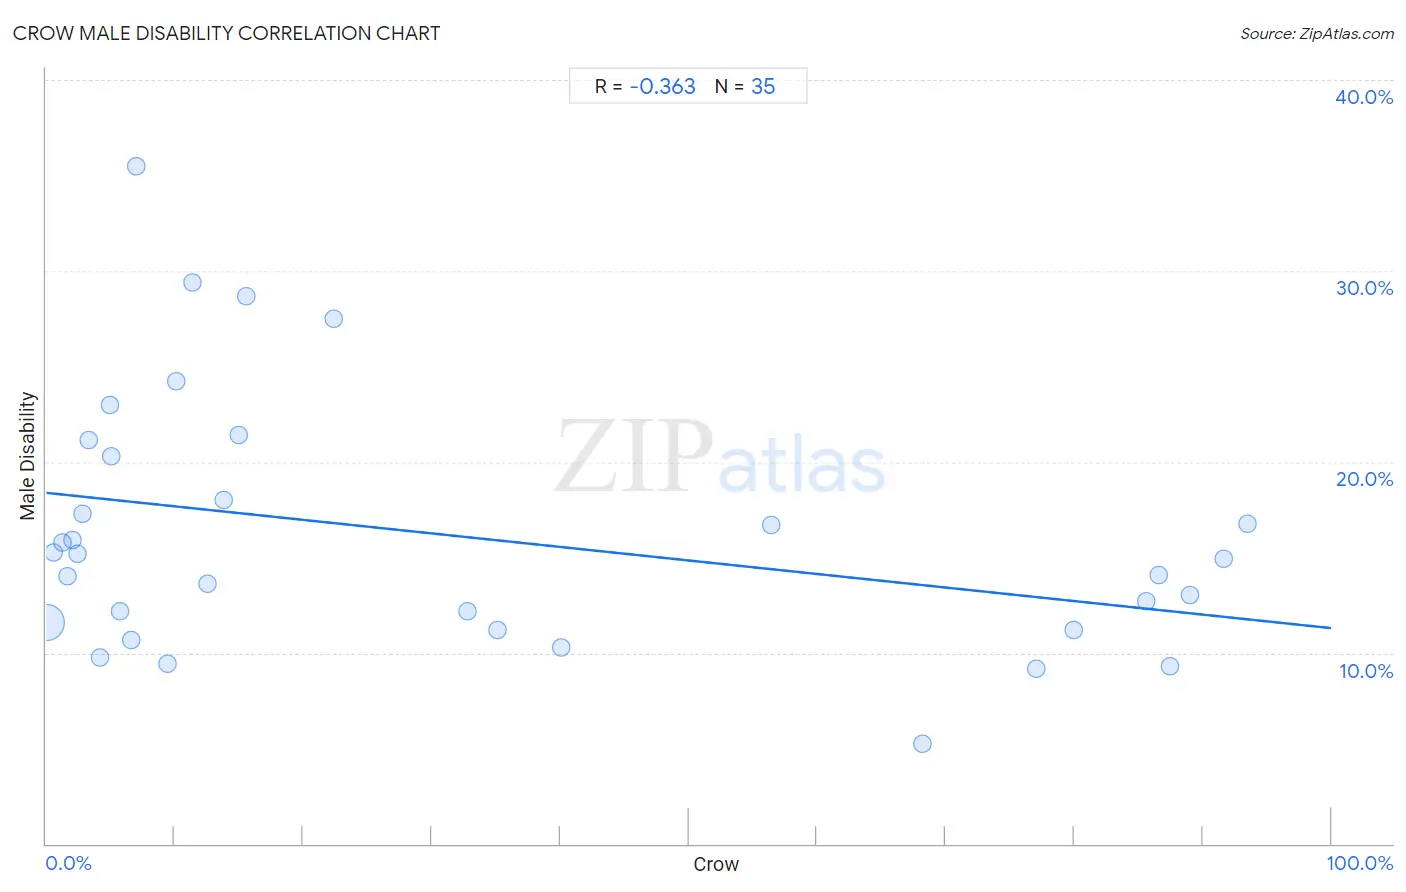
It is essential to understand that the correlation between the percentage of Crow and percentage of males with a disability does not imply a direct cause-and-effect relationship. It remains uncertain whether the presence of Crow influences an upward or downward trend in the level of percentage of males with a disability within an area, or if Crow simply ended up residing in those areas with higher or lower levels of percentage of males with a disability due to other factors.
Demographics Similar to Crow by Male Disability
In terms of male disability, the demographic groups most similar to Crow are Scotch-Irish (13.2%, a difference of 0.54%), French (13.0%, a difference of 0.58%), Cheyenne (13.0%, a difference of 0.63%), Celtic (13.0%, a difference of 0.72%), and Black/African American (13.2%, a difference of 0.87%).
| Demographics | Rating | Rank | Male Disability |
| Immigrants from Micronesia | 0.0 /100 | #295 | Tragic 12.9% |
| Nonimmigrants | 0.0 /100 | #296 | Tragic 12.9% |
| Inupiat | 0.0 /100 | #297 | Tragic 13.0% |
| Pennsylvania Germans | 0.0 /100 | #298 | Tragic 13.0% |
| Celtics | 0.0 /100 | #299 | Tragic 13.0% |
| Cheyenne | 0.0 /100 | #300 | Tragic 13.0% |
| French | 0.0 /100 | #301 | Tragic 13.0% |
| Crow | 0.0 /100 | #302 | Tragic 13.1% |
| Scotch-Irish | 0.0 /100 | #303 | Tragic 13.2% |
| Blacks/African Americans | 0.0 /100 | #304 | Tragic 13.2% |
| French Canadians | 0.0 /100 | #305 | Tragic 13.3% |
| Spanish Americans | 0.0 /100 | #306 | Tragic 13.3% |
| Arapaho | 0.0 /100 | #307 | Tragic 13.3% |
| French American Indians | 0.0 /100 | #308 | Tragic 13.4% |
| Blackfeet | 0.0 /100 | #309 | Tragic 13.4% |
Crow Male Disability Correlation Summary
| Measurement | Crow Data | Male Disability Data |
| Minimum | 0.023% | 5.2% |
| Maximum | 93.4% | 35.5% |
| Range | 93.4% | 30.2% |
| Mean | 30.9% | 16.2% |
| Median | 12.5% | 14.9% |
| Interquartile 25% (IQ1) | 4.2% | 11.2% |
| Interquartile 75% (IQ3) | 68.2% | 20.3% |
| Interquartile Range (IQR) | 64.0% | 9.1% |
| Standard Deviation (Sample) | 34.3% | 6.7% |
| Standard Deviation (Population) | 33.8% | 6.6% |
Correlation Details
| Crow Percentile | Sample Size | Male Disability |
[ 0.0% - 0.5% ] 0.023% | 58,539,702 | 11.6% |
[ 0.5% - 1.0% ] 0.59% | 294,827 | 15.2% |
[ 1.0% - 1.5% ] 1.26% | 166,103 | 15.8% |
[ 1.5% - 2.0% ] 1.61% | 93,100 | 14.0% |
[ 2.0% - 2.5% ] 2.07% | 7,192 | 15.9% |
[ 2.0% - 2.5% ] 2.45% | 49,253 | 15.2% |
[ 2.5% - 3.0% ] 2.87% | 2,129 | 17.3% |
[ 3.0% - 3.5% ] 3.26% | 11,598 | 21.2% |
[ 4.0% - 4.5% ] 4.23% | 1,560 | 9.8% |
[ 4.5% - 5.0% ] 4.97% | 5,276 | 23.0% |
[ 5.0% - 5.5% ] 5.10% | 1,019 | 20.3% |
[ 5.5% - 6.0% ] 5.79% | 1,953 | 12.2% |
[ 6.5% - 7.0% ] 6.61% | 4,223 | 10.7% |
[ 7.0% - 7.5% ] 7.01% | 785 | 35.5% |
[ 9.0% - 9.5% ] 9.45% | 2,064 | 9.5% |
[ 10.0% - 10.5% ] 10.08% | 2,817 | 24.2% |
[ 11.0% - 11.5% ] 11.36% | 176 | 29.4% |
[ 12.0% - 12.5% ] 12.50% | 48 | 13.6% |
[ 13.5% - 14.0% ] 13.79% | 428 | 18.0% |
[ 15.0% - 15.5% ] 15.00% | 40 | 21.4% |
[ 15.5% - 16.0% ] 15.56% | 1,125 | 28.7% |
[ 22.0% - 22.5% ] 22.35% | 783 | 27.5% |
[ 32.5% - 33.0% ] 32.75% | 3,985 | 12.2% |
[ 35.0% - 35.5% ] 35.12% | 5,199 | 11.2% |
[ 40.0% - 40.5% ] 40.12% | 172 | 10.3% |
[ 56.0% - 56.5% ] 56.41% | 78 | 16.7% |
[ 68.0% - 68.5% ] 68.23% | 576 | 5.2% |
[ 77.0% - 77.5% ] 77.09% | 1,602 | 9.2% |
[ 79.5% - 80.0% ] 79.96% | 459 | 11.2% |
[ 85.5% - 86.0% ] 85.61% | 660 | 12.7% |
[ 86.5% - 87.0% ] 86.61% | 2,180 | 14.0% |
[ 87.0% - 87.5% ] 87.40% | 262 | 9.3% |
[ 89.0% - 89.5% ] 89.03% | 629 | 13.0% |
[ 91.5% - 92.0% ] 91.65% | 1,965 | 14.9% |
[ 93.0% - 93.5% ] 93.45% | 473 | 16.7% |