Zip Codes with the Highest Percentage of Households with Income Above $100,000 in West Virginia
RELATED REPORTS & OPTIONS
Household Income | $100k+
West Virginia
Compare Zip Codes
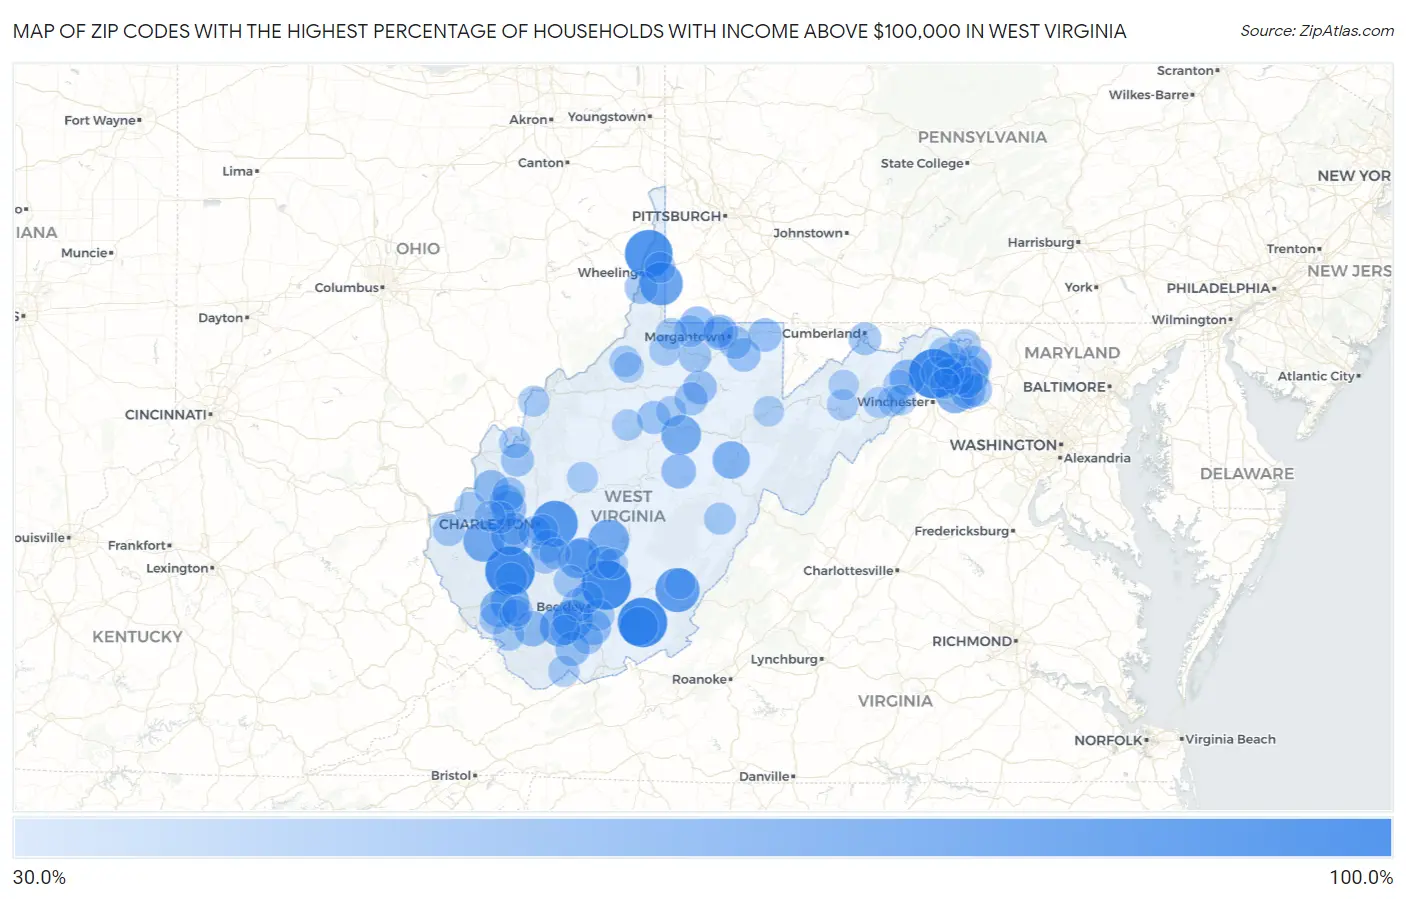
Map of Zip Codes with the Highest Percentage of Households with Income Above $100,000 in West Virginia
30.0%
100.0%
Zip Codes with the Highest Percentage of Households with Income Above $100,000 in West Virginia
| Zip Code | Households with Income > $100k | vs State | vs National | |
| 1. | 25203 | 100.0% | 24.4%(+75.6)#1 | 37.3%(+62.7)#22 |
| 2. | 24962 | 100.0% | 24.4%(+75.6)#2 | 37.3%(+62.7)#77 |
| 3. | 25421 | 100.0% | 24.4%(+75.6)#3 | 37.3%(+62.7)#122 |
| 4. | 25936 | 100.0% | 24.4%(+75.6)#4 | 37.3%(+62.7)#145 |
| 5. | 26058 | 93.5% | 24.4%(+69.1)#5 | 37.3%(+56.2)#158 |
| 6. | 25201 | 87.0% | 24.4%(+62.6)#6 | 37.3%(+49.7)#203 |
| 7. | 24957 | 80.9% | 24.4%(+56.5)#7 | 37.3%(+43.6)#317 |
| 8. | 26036 | 77.6% | 24.4%(+53.2)#8 | 37.3%(+40.3)#440 |
| 9. | 25544 | 70.0% | 24.4%(+45.6)#9 | 37.3%(+32.7)#974 |
| 10. | 26667 | 70.0% | 24.4%(+45.6)#10 | 37.3%(+32.7)#976 |
| 11. | 25876 | 67.9% | 24.4%(+43.5)#11 | 37.3%(+30.6)#1,183 |
| 12. | 25920 | 67.8% | 24.4%(+43.4)#12 | 37.3%(+30.5)#1,194 |
| 13. | 26372 | 65.6% | 24.4%(+41.2)#13 | 37.3%(+28.3)#1,453 |
| 14. | 25654 | 63.0% | 24.4%(+38.6)#14 | 37.3%(+25.7)#1,855 |
| 15. | 24981 | 62.3% | 24.4%(+37.9)#15 | 37.3%(+25.0)#1,966 |
| 16. | 25139 | 62.2% | 24.4%(+37.8)#16 | 37.3%(+24.9)#1,977 |
| 17. | 25446 | 62.0% | 24.4%(+37.6)#17 | 37.3%(+24.7)#2,012 |
| 18. | 25564 | 60.4% | 24.4%(+36.0)#18 | 37.3%(+23.1)#2,297 |
| 19. | 25442 | 58.4% | 24.4%(+34.0)#19 | 37.3%(+21.1)#2,693 |
| 20. | 26293 | 58.4% | 24.4%(+34.0)#20 | 37.3%(+21.1)#2,696 |
| 21. | 25612 | 56.1% | 24.4%(+31.7)#21 | 37.3%(+18.8)#3,182 |
| 22. | 26817 | 52.2% | 24.4%(+27.8)#22 | 37.3%(+14.9)#4,202 |
| 23. | 25443 | 51.2% | 24.4%(+26.8)#23 | 37.3%(+13.9)#4,489 |
| 24. | 26546 | 51.1% | 24.4%(+26.7)#24 | 37.3%(+13.8)#4,524 |
| 25. | 24822 | 51.0% | 24.4%(+26.6)#25 | 37.3%(+13.7)#4,555 |
| 26. | 25560 | 50.3% | 24.4%(+25.9)#26 | 37.3%(+13.0)#4,749 |
| 27. | 25414 | 49.8% | 24.4%(+25.4)#27 | 37.3%(+12.5)#4,919 |
| 28. | 25040 | 49.8% | 24.4%(+25.4)#28 | 37.3%(+12.5)#4,941 |
| 29. | 25082 | 49.5% | 24.4%(+25.1)#29 | 37.3%(+12.2)#5,034 |
| 30. | 25843 | 48.7% | 24.4%(+24.3)#30 | 37.3%(+11.4)#5,280 |
| 31. | 26521 | 48.3% | 24.4%(+23.9)#31 | 37.3%(+11.0)#5,410 |
| 32. | 26215 | 48.2% | 24.4%(+23.8)#32 | 37.3%(+10.9)#5,444 |
| 33. | 24719 | 46.9% | 24.4%(+22.5)#33 | 37.3%(+9.60)#5,891 |
| 34. | 25425 | 45.9% | 24.4%(+21.5)#34 | 37.3%(+8.60)#6,260 |
| 35. | 26330 | 45.1% | 24.4%(+20.7)#35 | 37.3%(+7.80)#6,580 |
| 36. | 26525 | 44.8% | 24.4%(+20.4)#36 | 37.3%(+7.50)#6,709 |
| 37. | 25213 | 44.7% | 24.4%(+20.3)#37 | 37.3%(+7.40)#6,752 |
| 38. | 26520 | 44.6% | 24.4%(+20.2)#38 | 37.3%(+7.30)#6,804 |
| 39. | 25836 | 44.3% | 24.4%(+19.9)#39 | 37.3%(+7.00)#6,906 |
| 40. | 26338 | 43.7% | 24.4%(+19.3)#40 | 37.3%(+6.40)#7,145 |
| 41. | 26508 | 43.1% | 24.4%(+18.7)#41 | 37.3%(+5.80)#7,372 |
| 42. | 26038 | 43.1% | 24.4%(+18.7)#42 | 37.3%(+5.80)#7,396 |
| 43. | 25168 | 43.1% | 24.4%(+18.7)#43 | 37.3%(+5.80)#7,398 |
| 44. | 26408 | 43.1% | 24.4%(+18.7)#44 | 37.3%(+5.80)#7,400 |
| 45. | 25241 | 43.1% | 24.4%(+18.7)#45 | 37.3%(+5.80)#7,407 |
| 46. | 25314 | 42.6% | 24.4%(+18.2)#46 | 37.3%(+5.30)#7,618 |
| 47. | 25430 | 42.1% | 24.4%(+17.7)#47 | 37.3%(+4.80)#7,854 |
| 48. | 26767 | 42.0% | 24.4%(+17.6)#48 | 37.3%(+4.70)#7,909 |
| 49. | 25214 | 41.7% | 24.4%(+17.3)#49 | 37.3%(+4.40)#8,051 |
| 50. | 26576 | 41.6% | 24.4%(+17.2)#50 | 37.3%(+4.30)#8,097 |
| 51. | 25008 | 41.0% | 24.4%(+16.6)#51 | 37.3%(+3.70)#8,430 |
| 52. | 25862 | 41.0% | 24.4%(+16.6)#52 | 37.3%(+3.70)#8,431 |
| 53. | 25108 | 40.9% | 24.4%(+16.5)#53 | 37.3%(+3.60)#8,489 |
| 54. | 25202 | 40.7% | 24.4%(+16.3)#54 | 37.3%(+3.40)#8,576 |
| 55. | 25526 | 40.2% | 24.4%(+15.8)#55 | 37.3%(+2.90)#8,789 |
| 56. | 25049 | 40.0% | 24.4%(+15.6)#56 | 37.3%(+2.70)#8,927 |
| 57. | 25535 | 39.8% | 24.4%(+15.4)#57 | 37.3%(+2.50)#9,038 |
| 58. | 26209 | 39.4% | 24.4%(+15.0)#58 | 37.3%(+2.10)#9,262 |
| 59. | 26590 | 39.0% | 24.4%(+14.6)#59 | 37.3%(+1.70)#9,451 |
| 60. | 25262 | 38.3% | 24.4%(+13.9)#60 | 37.3%(+1.000)#9,840 |
| 61. | 25419 | 38.2% | 24.4%(+13.8)#61 | 37.3%(+0.900)#9,872 |
| 62. | 25608 | 38.2% | 24.4%(+13.8)#62 | 37.3%(+0.900)#9,900 |
| 63. | 25420 | 38.1% | 24.4%(+13.7)#63 | 37.3%(+0.800)#9,940 |
| 64. | 25832 | 37.8% | 24.4%(+13.4)#64 | 37.3%(+0.500)#10,107 |
| 65. | 25405 | 37.7% | 24.4%(+13.3)#65 | 37.3%(+0.400)#10,143 |
| 66. | 25304 | 37.7% | 24.4%(+13.3)#66 | 37.3%(+0.400)#10,152 |
| 67. | 26562 | 37.7% | 24.4%(+13.3)#67 | 37.3%(+0.400)#10,183 |
| 68. | 25403 | 37.6% | 24.4%(+13.2)#68 | 37.3%(+0.300)#10,207 |
| 69. | 26437 | 37.6% | 24.4%(+13.2)#69 | 37.3%(+0.300)#10,231 |
| 70. | 25545 | 37.4% | 24.4%(+13.0)#70 | 37.3%(+0.100)#10,338 |
| 71. | 25644 | 37.3% | 24.4%(+12.9)#71 | 37.3%(=0.000)#10,398 |
| 72. | 25635 | 37.1% | 24.4%(+12.7)#72 | 37.3%(-0.200)#10,512 |
| 73. | 24808 | 37.0% | 24.4%(+12.6)#73 | 37.3%(-0.300)#10,597 |
| 74. | 26060 | 36.9% | 24.4%(+12.5)#74 | 37.3%(-0.400)#10,655 |
| 75. | 26845 | 36.9% | 24.4%(+12.5)#75 | 37.3%(-0.400)#10,663 |
| 76. | 25259 | 36.8% | 24.4%(+12.4)#76 | 37.3%(-0.500)#10,729 |
| 77. | 26149 | 36.6% | 24.4%(+12.2)#77 | 37.3%(-0.700)#10,835 |
| 78. | 25134 | 36.6% | 24.4%(+12.2)#78 | 37.3%(-0.700)#10,849 |
| 79. | 25909 | 36.5% | 24.4%(+12.1)#79 | 37.3%(-0.800)#10,893 |
| 80. | 25902 | 36.5% | 24.4%(+12.1)#80 | 37.3%(-0.800)#10,901 |
| 81. | 26342 | 36.4% | 24.4%(+12.0)#81 | 37.3%(-0.900)#10,957 |
| 82. | 25438 | 36.3% | 24.4%(+11.9)#82 | 37.3%(-1.00)#10,987 |
| 83. | 26181 | 36.1% | 24.4%(+11.7)#83 | 37.3%(-1.20)#11,086 |
| 84. | 24938 | 35.8% | 24.4%(+11.4)#84 | 37.3%(-1.50)#11,291 |
| 85. | 26711 | 35.7% | 24.4%(+11.3)#85 | 37.3%(-1.60)#11,339 |
| 86. | 26714 | 35.7% | 24.4%(+11.3)#86 | 37.3%(-1.60)#11,359 |
| 87. | 25617 | 35.6% | 24.4%(+11.2)#87 | 37.3%(-1.70)#11,420 |
| 88. | 25510 | 35.5% | 24.4%(+11.1)#88 | 37.3%(-1.80)#11,461 |
| 89. | 25868 | 35.1% | 24.4%(+10.7)#89 | 37.3%(-2.20)#11,750 |
| 90. | 25428 | 34.8% | 24.4%(+10.4)#90 | 37.3%(-2.50)#11,893 |
| 91. | 26541 | 34.8% | 24.4%(+10.4)#91 | 37.3%(-2.50)#11,912 |
| 92. | 25413 | 34.6% | 24.4%(+10.2)#92 | 37.3%(-2.70)#12,025 |
| 93. | 26378 | 34.6% | 24.4%(+10.2)#93 | 37.3%(-2.70)#12,034 |
| 94. | 26269 | 34.5% | 24.4%(+10.1)#94 | 37.3%(-2.80)#12,115 |
| 95. | 25427 | 34.3% | 24.4%(+9.90)#95 | 37.3%(-3.00)#12,203 |
| 96. | 26710 | 34.2% | 24.4%(+9.80)#96 | 37.3%(-3.10)#12,286 |
| 97. | 26320 | 34.2% | 24.4%(+9.80)#97 | 37.3%(-3.10)#12,302 |
| 98. | 25882 | 34.1% | 24.4%(+9.70)#98 | 37.3%(-3.20)#12,365 |
| 99. | 26865 | 33.9% | 24.4%(+9.50)#99 | 37.3%(-3.40)#12,552 |
| 100. | 26808 | 33.8% | 24.4%(+9.40)#100 | 37.3%(-3.50)#12,619 |
Common Questions
What are the Top 10 Zip Codes with the Highest Percentage of Households with Income Above $100,000 in West Virginia?
Top 10 Zip Codes with the Highest Percentage of Households with Income Above $100,000 in West Virginia are:
What zip code has the Highest Percentage of Households with Income Above $100,000 in West Virginia?
25203 has the Highest Percentage of Households with Income Above $100,000 in West Virginia with 100.0%.
What is the Percentage of Households with Income Above $100,000 in the State of West Virginia?
Percentage of Households with Income Above $100,000 in West Virginia is 24.4%.
What is the Percentage of Households with Income Above $100,000 in the United States?
Percentage of Households with Income Above $100,000 in the United States is 37.3%.