Zip Codes with the Highest Percentage of Spanish Population in West Virginia
RELATED REPORTS & OPTIONS
Spanish
West Virginia
Compare Zip Codes
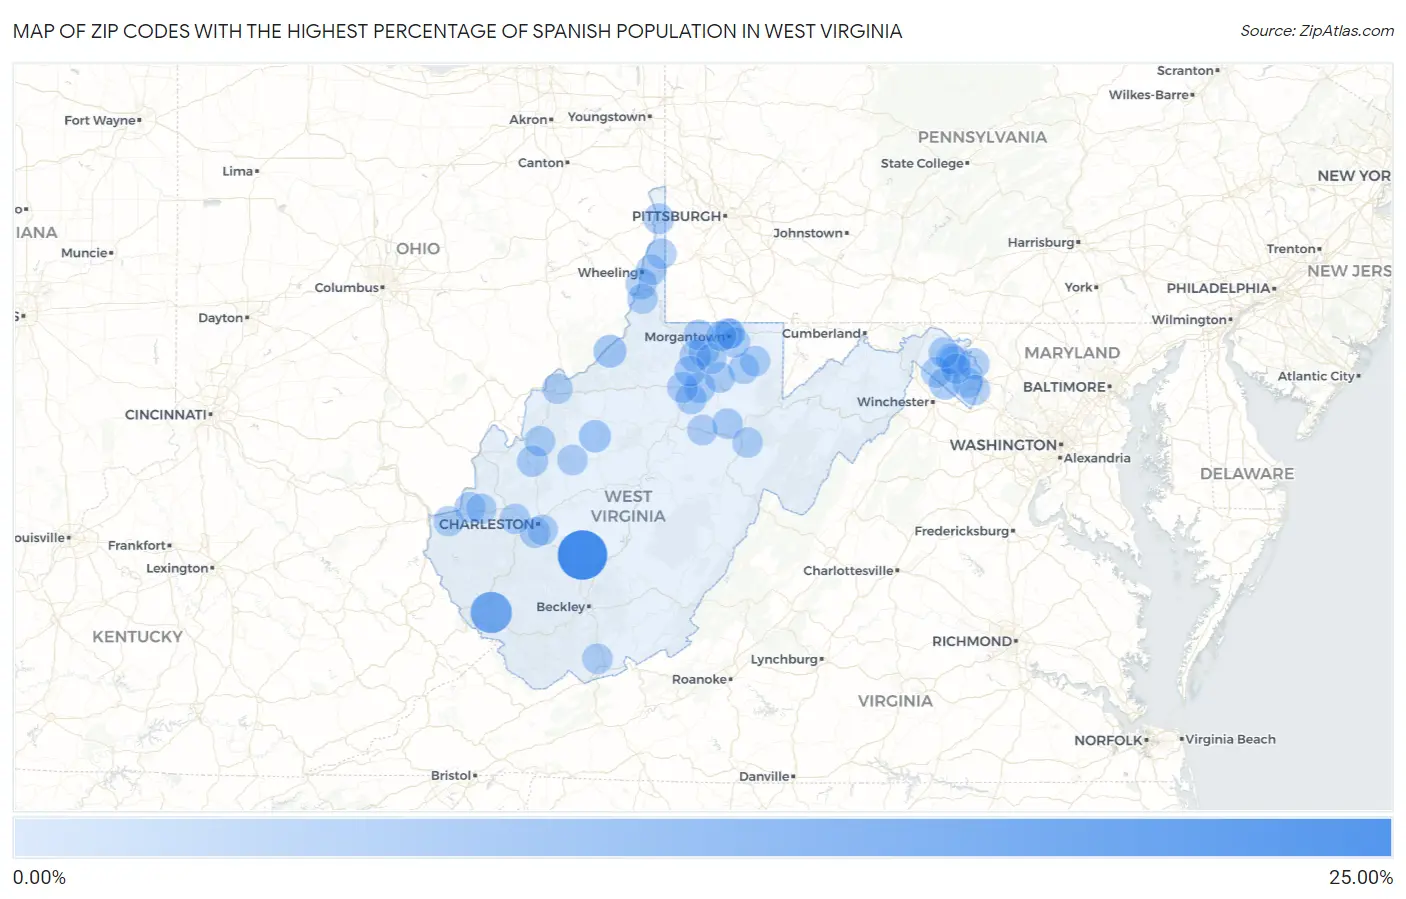
Map of Zip Codes with the Highest Percentage of Spanish Population in West Virginia
0.00%
25.00%
Zip Codes with the Highest Percentage of Spanish Population in West Virginia
| Zip Code | Spanish | vs State | vs National | |
| 1. | 25040 | 23.99% | 0.10%(+23.9)#1 | 0.23%(+23.8)#29 |
| 2. | 25638 | 13.68% | 0.10%(+13.6)#2 | 0.23%(+13.4)#68 |
| 3. | 26175 | 2.92% | 0.10%(+2.82)#3 | 0.23%(+2.69)#356 |
| 4. | 26136 | 2.37% | 0.10%(+2.26)#4 | 0.23%(+2.13)#449 |
| 5. | 25413 | 1.79% | 0.10%(+1.68)#5 | 0.23%(+1.55)#600 |
| 6. | 26576 | 1.22% | 0.10%(+1.12)#6 | 0.23%(+0.987)#973 |
| 7. | 25443 | 1.10% | 0.10%(+1.00)#7 | 0.23%(+0.870)#1,089 |
| 8. | 26040 | 1.06% | 0.10%(+0.956)#8 | 0.23%(+0.824)#1,148 |
| 9. | 26330 | 0.80% | 0.10%(+0.697)#9 | 0.23%(+0.565)#1,539 |
| 10. | 26408 | 0.80% | 0.10%(+0.694)#10 | 0.23%(+0.562)#1,547 |
| 11. | 25271 | 0.78% | 0.10%(+0.676)#11 | 0.23%(+0.544)#1,587 |
| 12. | 26559 | 0.65% | 0.10%(+0.546)#12 | 0.23%(+0.414)#1,961 |
| 13. | 26301 | 0.61% | 0.10%(+0.506)#13 | 0.23%(+0.374)#2,110 |
| 14. | 26062 | 0.55% | 0.10%(+0.446)#14 | 0.23%(+0.314)#2,333 |
| 15. | 26431 | 0.53% | 0.10%(+0.425)#15 | 0.23%(+0.293)#2,440 |
| 16. | 25545 | 0.48% | 0.10%(+0.380)#16 | 0.23%(+0.248)#2,696 |
| 17. | 26506 | 0.48% | 0.10%(+0.380)#17 | 0.23%(+0.248)#2,698 |
| 18. | 25401 | 0.41% | 0.10%(+0.309)#18 | 0.23%(+0.177)#3,147 |
| 19. | 26570 | 0.40% | 0.10%(+0.300)#19 | 0.23%(+0.168)#3,206 |
| 20. | 26250 | 0.40% | 0.10%(+0.297)#20 | 0.23%(+0.165)#3,223 |
| 21. | 26003 | 0.34% | 0.10%(+0.241)#21 | 0.23%(+0.109)#3,660 |
| 22. | 25314 | 0.34% | 0.10%(+0.233)#22 | 0.23%(+0.101)#3,729 |
| 23. | 26410 | 0.31% | 0.10%(+0.212)#23 | 0.23%(+0.080)#3,932 |
| 24. | 25275 | 0.27% | 0.10%(+0.166)#24 | 0.23%(+0.034)#4,420 |
| 25. | 26537 | 0.25% | 0.10%(+0.152)#25 | 0.23%(+0.020)#4,583 |
| 26. | 25304 | 0.24% | 0.10%(+0.137)#26 | 0.23%(+0.005)#4,816 |
| 27. | 25420 | 0.23% | 0.10%(+0.127)#27 | 0.23%(-0.005)#4,974 |
| 28. | 26354 | 0.18% | 0.10%(+0.075)#28 | 0.23%(-0.057)#5,794 |
| 29. | 24740 | 0.18% | 0.10%(+0.073)#29 | 0.23%(-0.059)#5,840 |
| 30. | 26032 | 0.17% | 0.10%(+0.065)#30 | 0.23%(-0.067)#6,000 |
| 31. | 25438 | 0.17% | 0.10%(+0.064)#31 | 0.23%(-0.068)#6,033 |
| 32. | 26104 | 0.15% | 0.10%(+0.047)#32 | 0.23%(-0.085)#6,350 |
| 33. | 25425 | 0.10% | 0.10%(+0.002)#33 | 0.23%(-0.130)#7,403 |
| 34. | 26508 | 0.099% | 0.10%(-0.004)#34 | 0.23%(-0.136)#7,524 |
| 35. | 26554 | 0.098% | 0.10%(-0.005)#35 | 0.23%(-0.137)#7,553 |
| 36. | 26201 | 0.097% | 0.10%(-0.006)#36 | 0.23%(-0.138)#7,576 |
| 37. | 26505 | 0.089% | 0.10%(-0.013)#37 | 0.23%(-0.145)#7,758 |
| 38. | 26241 | 0.086% | 0.10%(-0.017)#38 | 0.23%(-0.149)#7,857 |
| 39. | 25403 | 0.081% | 0.10%(-0.021)#39 | 0.23%(-0.153)#7,993 |
| 40. | 25276 | 0.079% | 0.10%(-0.024)#40 | 0.23%(-0.156)#8,078 |
| 41. | 25541 | 0.076% | 0.10%(-0.027)#41 | 0.23%(-0.159)#8,163 |
| 42. | 26501 | 0.073% | 0.10%(-0.030)#42 | 0.23%(-0.162)#8,234 |
| 43. | 25405 | 0.052% | 0.10%(-0.050)#43 | 0.23%(-0.182)#8,889 |
| 44. | 25177 | 0.039% | 0.10%(-0.064)#44 | 0.23%(-0.196)#9,295 |
| 45. | 25427 | 0.038% | 0.10%(-0.065)#45 | 0.23%(-0.197)#9,338 |
| 46. | 25701 | 0.032% | 0.10%(-0.070)#46 | 0.23%(-0.202)#9,497 |
| 47. | 26041 | 0.032% | 0.10%(-0.071)#47 | 0.23%(-0.203)#9,499 |
Common Questions
What are the Top 10 Zip Codes with the Highest Percentage of Spanish Population in West Virginia?
Top 10 Zip Codes with the Highest Percentage of Spanish Population in West Virginia are:
What zip code has the Highest Percentage of Spanish Population in West Virginia?
25040 has the Highest Percentage of Spanish Population in West Virginia with 23.99%.
What is the Percentage of Spanish Population in the State of West Virginia?
Percentage of Spanish Population in West Virginia is 0.10%.
What is the Percentage of Spanish Population in the United States?
Percentage of Spanish Population in the United States is 0.23%.