Zip Codes with the Highest Percentage of Population with a Degree in Literature and Languages in Charlottesville, VA

RELATED REPORTS & OPTIONS

Literature and Languages
Population
Families and Households
Female Fertility
Female Fertility (Unmarried)
Race (Community Size)
Race (Percentage)
Ancestry (Community Size)
AfghanAfricanAlbanianAmericanApacheArabArgentineanArmenianAustralianAustrianBasqueBelgianBhutaneseBolivianBrazilianBritishBulgarianBurmeseCanadianCentral AmericanCentral American IndianCherokeeChileanColombianCroatianCubanCzechCzechoslovakianDanishDominicanDutchEastern EuropeanEcuadorianEgyptianEnglishEthiopianEuropeanFilipinoFinnishFrenchFrench CanadianGermanGhanaianGreekGuamanian / ChamorroGuatemalanHonduranHungarianIndian (Asian)IranianIraqiIrishIroquoisItalianJamaicanJapaneseKenyanKoreanLaotianLatvianLebaneseLithuanianLumbeeMexicanMoroccanNative HawaiianNicaraguanNigerianNorthern EuropeanNorwegianPalestinianPanamanianPennsylvania GermanPeruvianPolishPortuguesePuerto RicanRomanianRussianSalvadoranSamoanScandinavianScotch-IrishScottishSerbianSlavicSlovakSloveneSouth AmericanSpaniardSpanishSri LankanSubsaharan AfricanSudaneseSwedishSwissSyrianThaiTrinidadian and TobagonianTurkishUkrainianVenezuelanVietnameseWelshWest IndianYugoslavian
Ancestry (Percentage)
AfghanAfricanAlbanianAmericanApacheArabArgentineanArmenianAustralianAustrianBasqueBelgianBhutaneseBolivianBrazilianBritishBulgarianBurmeseCanadianCentral AmericanCentral American IndianCherokeeChileanColombianCroatianCubanCzechCzechoslovakianDanishDominicanDutchEastern EuropeanEcuadorianEgyptianEnglishEthiopianEuropeanFilipinoFinnishFrenchFrench CanadianGermanGhanaianGreekGuamanian / ChamorroGuatemalanHonduranHungarianIndian (Asian)IranianIraqiIrishIroquoisItalianJamaicanJapaneseKenyanKoreanLaotianLatvianLebaneseLithuanianLumbeeMexicanMoroccanNative HawaiianNicaraguanNigerianNorthern EuropeanNorwegianPalestinianPanamanianPennsylvania GermanPeruvianPolishPortuguesePuerto RicanRomanianRussianSalvadoranSamoanScandinavianScotch-IrishScottishSerbianSlavicSlovakSloveneSouth AmericanSpaniardSpanishSri LankanSubsaharan AfricanSudaneseSwedishSwissSyrianThaiTrinidadian and TobagonianTurkishUkrainianVenezuelanVietnameseWelshWest IndianYugoslavian
Immigrant Origin (Total)
Immigrant Origin (Percentage)
Income
Income (Families)
Income (Households)
Poverty
Poverty (Families)
Unemployment
Employment Occupations
Employment Industries
Employer Class
Commute Time
Commute Means
School Enrollment
Education by Degree Field
Occupancy
Finances
Physical Characteristics
Charlottesville
Compare Zip Codes
Comparison Subject

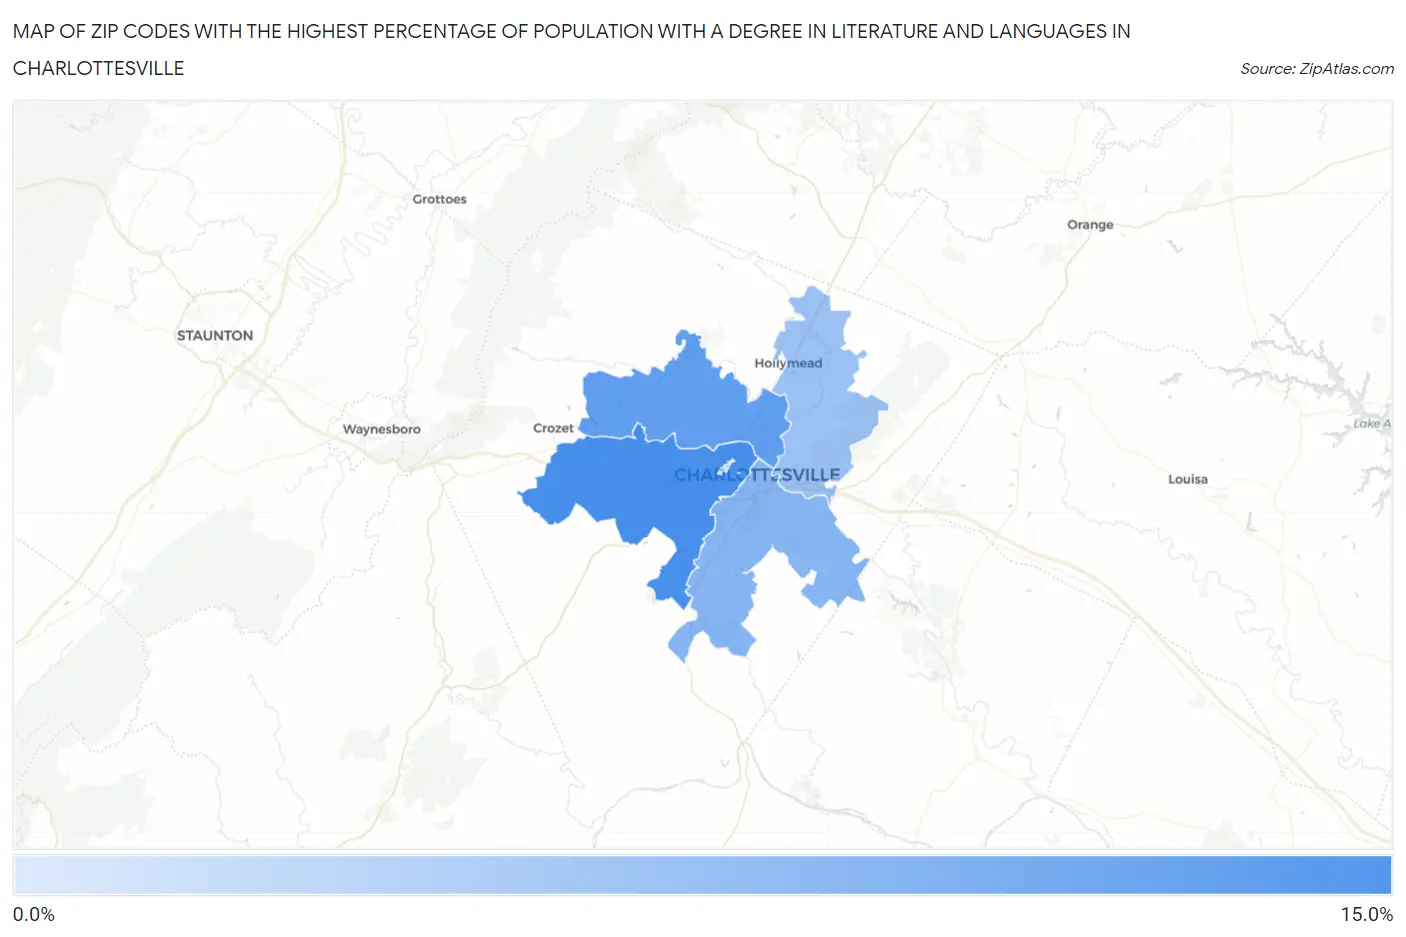
Map of Zip Codes with the Highest Percentage of Population with a Degree in Literature and Languages in Charlottesville

0.0%
15.0%
Zip Codes with the Highest Percentage of Population with a Degree in Literature and Languages in Charlottesville Map

Zip Codes with the Highest Percentage of Population with a Degree in Literature and Languages in Charlottesville, VA

Zip Code % Graduates vs State vs National
1.2290310.7%5.2%(+5.49)#604.4%(+6.33)#1,547
2.229019.2%5.2%(+3.95)#864.4%(+4.79)#2,212
3.229026.9%5.2%(+1.67)#1774.4%(+2.51)#4,085
4.229115.6%5.2%(+0.366)#2564.4%(+1.21)#6,103
5.229041.9%5.2%(-3.35)#5414.4%(-2.51)#17,417

Common Questions

What are the Top 3 Zip Codes with the Highest Percentage of Population with a Degree in Literature and Languages in Charlottesville, VA?
Top 3 Zip Codes with the Highest Percentage of Population with a Degree in Literature and Languages in Charlottesville, VA are:
#1
10.7%
#2
9.2%
#3
6.9%
What zip code has the Highest Percentage of Population with a Degree in Literature and Languages in Charlottesville, VA?
22903 has the Highest Percentage of Population with a Degree in Literature and Languages in Charlottesville, VA with 10.7%.
What is the Percentage of Population with a Degree in Literature and Languages in Charlottesville, VA?
Percentage of Population with a Degree in Literature and Languages in Charlottesville is 11.4%.
What is the Percentage of Population with a Degree in Literature and Languages in Virginia?
Percentage of Population with a Degree in Literature and Languages in Virginia is 5.2%.
What is the Percentage of Population with a Degree in Literature and Languages in the United States?
Percentage of Population with a Degree in Literature and Languages in the United States is 4.4%.