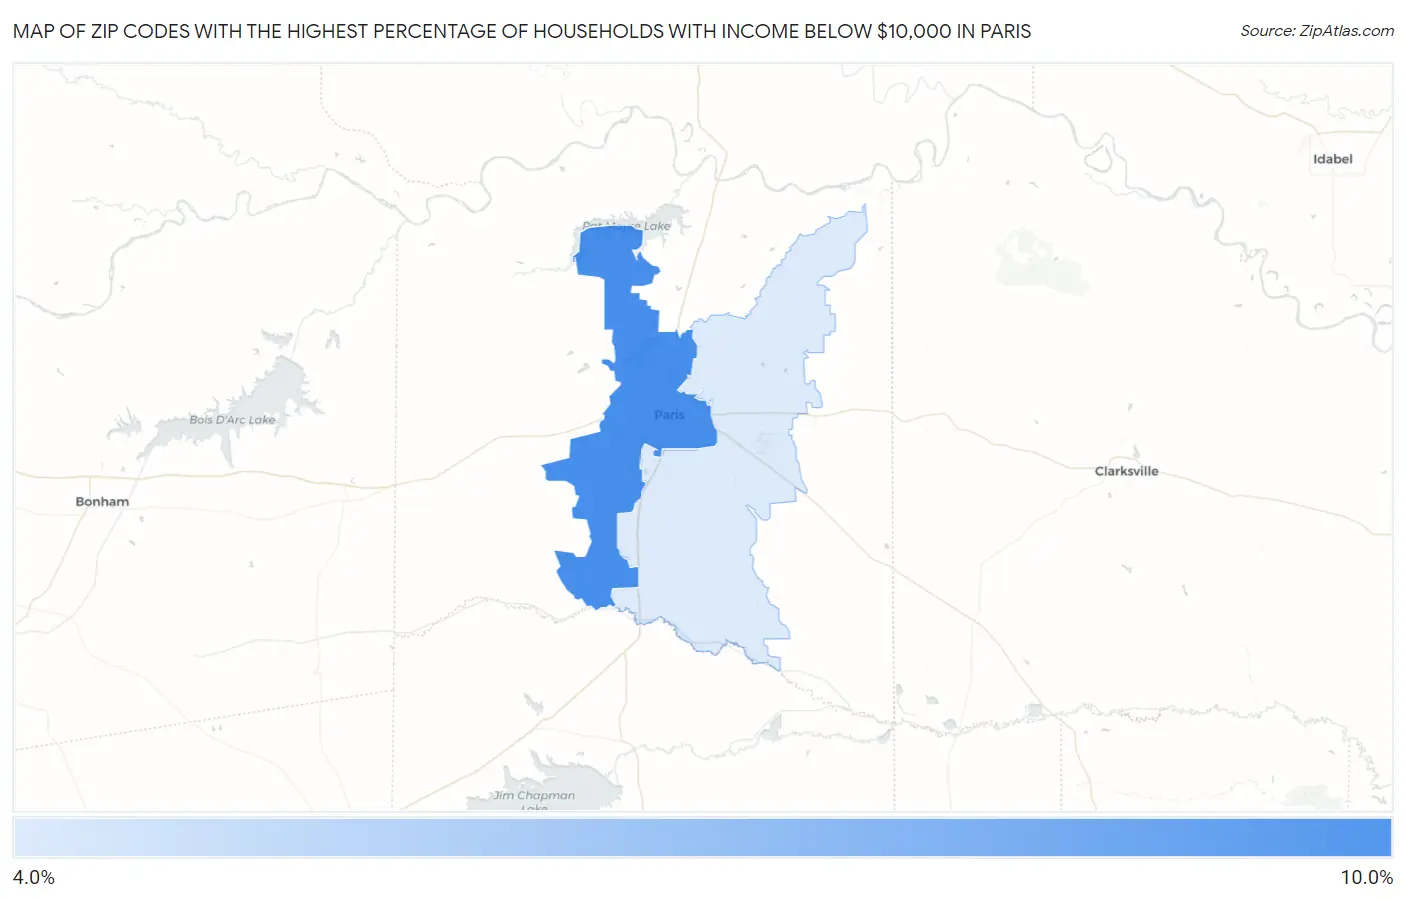
Zip Codes with the Highest Percentage of Households with Income Below $10,000 in Paris, TX
RELATED REPORTS & OPTIONS
Household Income | $0-10k
Paris
Compare Zip Codes
Map of Zip Codes with the Highest Percentage of Households with Income Below $10,000 in Paris
4.8%
8.7%
Zip Codes with the Highest Percentage of Households with Income Below $10,000 in Paris, TX
| Zip Code | Households with Income < $10k | vs State | vs National | |
| 1. | 75460 | 8.7% | 5.1%(+3.60)#300 | 4.9%(+3.80)#4,725 |
| 2. | 75462 | 4.8% | 5.1%(-0.300)#824 | 4.9%(-0.100)#12,388 |
1
Common Questions
What are the Top Zip Codes with the Highest Percentage of Households with Income Below $10,000 in Paris, TX?
Top Zip Codes with the Highest Percentage of Households with Income Below $10,000 in Paris, TX are:
What zip code has the Highest Percentage of Households with Income Below $10,000 in Paris, TX?
75460 has the Highest Percentage of Households with Income Below $10,000 in Paris, TX with 8.7%.
What is the Percentage of Households with Income Below $10,000 in Paris, TX?
Percentage of Households with Income Below $10,000 in Paris is 7.9%.
What is the Percentage of Households with Income Below $10,000 in Texas?
Percentage of Households with Income Below $10,000 in Texas is 5.1%.
What is the Percentage of Households with Income Below $10,000 in the United States?
Percentage of Households with Income Below $10,000 in the United States is 4.9%.