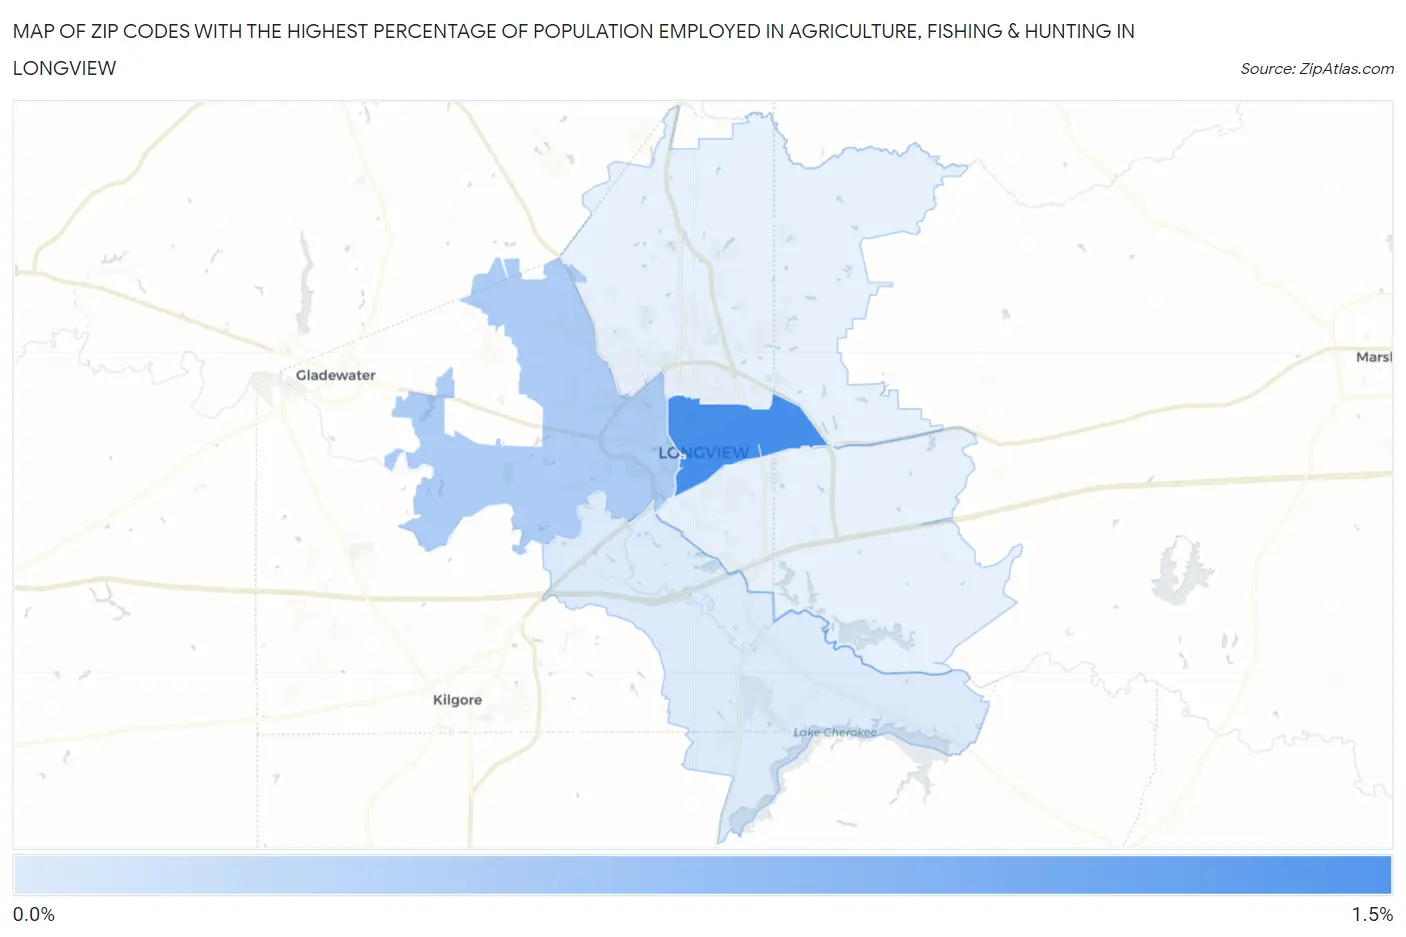
Zip Codes with the Highest Percentage of Population Employed in Agriculture, Fishing & Hunting in Longview, TX
RELATED REPORTS & OPTIONS
Agriculture, Fishing & Hunting
Longview
Compare Zip Codes
Map of Zip Codes with the Highest Percentage of Population Employed in Agriculture, Fishing & Hunting in Longview
0.14%
1.2%
Zip Codes with the Highest Percentage of Population Employed in Agriculture, Fishing & Hunting in Longview, TX
| Zip Code | % Employed | vs State | vs National | |
| 1. | 75601 | 1.2% | 0.75%(+0.429)#819 | 1.2%(-0.019)#15,468 |
| 2. | 75604 | 0.46% | 0.75%(-0.287)#1,058 | 1.2%(-0.735)#19,577 |
| 3. | 75603 | 0.14% | 0.75%(-0.615)#1,316 | 1.2%(-1.06)#23,204 |
1
Common Questions
What are the Top 3 Zip Codes with the Highest Percentage of Population Employed in Agriculture, Fishing & Hunting in Longview, TX?
Top 3 Zip Codes with the Highest Percentage of Population Employed in Agriculture, Fishing & Hunting in Longview, TX are:
What zip code has the Highest Percentage of Population Employed in Agriculture, Fishing & Hunting in Longview, TX?
75601 has the Highest Percentage of Population Employed in Agriculture, Fishing & Hunting in Longview, TX with 1.2%.
What is the Percentage of Population Employed in Agriculture, Fishing & Hunting in Longview, TX?
Percentage of Population Employed in Agriculture, Fishing & Hunting in Longview is 0.38%.
What is the Percentage of Population Employed in Agriculture, Fishing & Hunting in Texas?
Percentage of Population Employed in Agriculture, Fishing & Hunting in Texas is 0.75%.
What is the Percentage of Population Employed in Agriculture, Fishing & Hunting in the United States?
Percentage of Population Employed in Agriculture, Fishing & Hunting in the United States is 1.2%.