Zip Codes with the Highest Percentage of Population with a Degree in Liberal Arts and History in Chattanooga, TN
RELATED REPORTS & OPTIONS
Liberal Arts and History
Chattanooga
Compare Zip Codes
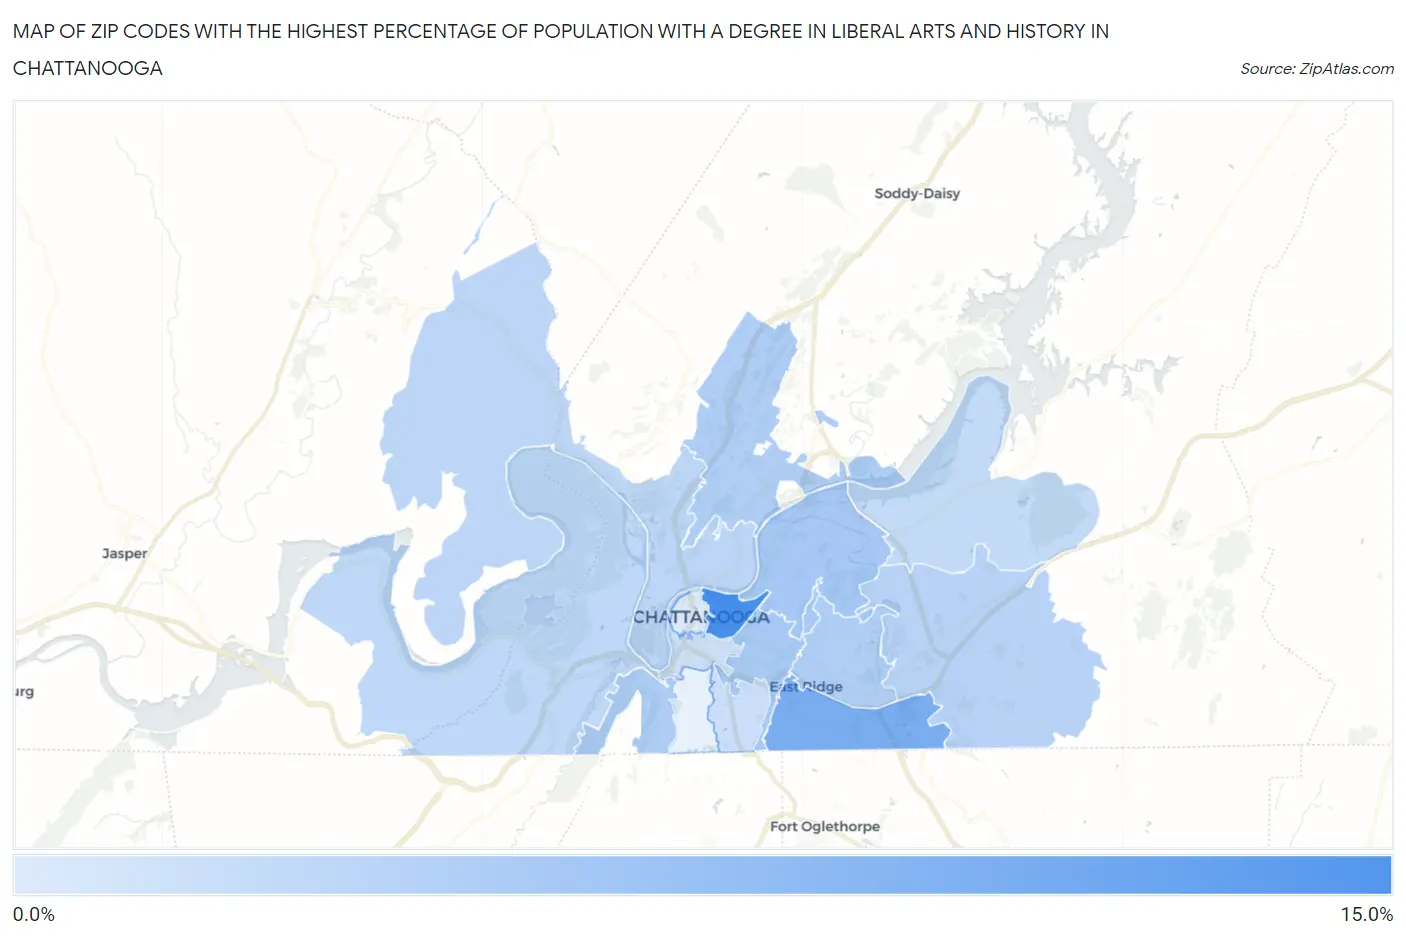
Map of Zip Codes with the Highest Percentage of Population with a Degree in Liberal Arts and History in Chattanooga
1.9%
13.4%
Zip Codes with the Highest Percentage of Population with a Degree in Liberal Arts and History in Chattanooga, TN
| Zip Code | % Graduates | vs State | vs National | |
| 1. | 37403 | 13.4% | 4.9%(+8.56)#37 | 4.9%(+8.57)#1,787 |
| 2. | 37412 | 9.3% | 4.9%(+4.45)#69 | 4.9%(+4.46)#3,576 |
| 3. | 37406 | 6.0% | 4.9%(+1.10)#174 | 4.9%(+1.10)#8,587 |
| 4. | 37404 | 5.8% | 4.9%(+0.912)#184 | 4.9%(+0.919)#9,056 |
| 5. | 37409 | 5.4% | 4.9%(+0.514)#204 | 4.9%(+0.521)#10,152 |
| 6. | 37411 | 5.3% | 4.9%(+0.404)#206 | 4.9%(+0.410)#10,487 |
| 7. | 37415 | 5.3% | 4.9%(+0.386)#207 | 4.9%(+0.392)#10,538 |
| 8. | 37421 | 4.7% | 4.9%(-0.182)#245 | 4.9%(-0.176)#12,328 |
| 9. | 37405 | 4.3% | 4.9%(-0.542)#277 | 4.9%(-0.535)#13,515 |
| 10. | 37419 | 4.2% | 4.9%(-0.710)#287 | 4.9%(-0.703)#14,138 |
| 11. | 37416 | 3.7% | 4.9%(-1.16)#318 | 4.9%(-1.15)#15,813 |
| 12. | 37407 | 3.3% | 4.9%(-1.58)#342 | 4.9%(-1.57)#17,300 |
| 13. | 37408 | 3.0% | 4.9%(-1.91)#364 | 4.9%(-1.91)#18,485 |
| 14. | 37402 | 1.9% | 4.9%(-2.99)#423 | 4.9%(-2.99)#21,652 |
1
Common Questions
What are the Top 10 Zip Codes with the Highest Percentage of Population with a Degree in Liberal Arts and History in Chattanooga, TN?
Top 10 Zip Codes with the Highest Percentage of Population with a Degree in Liberal Arts and History in Chattanooga, TN are:
What zip code has the Highest Percentage of Population with a Degree in Liberal Arts and History in Chattanooga, TN?
37403 has the Highest Percentage of Population with a Degree in Liberal Arts and History in Chattanooga, TN with 13.4%.
What is the Percentage of Population with a Degree in Liberal Arts and History in Chattanooga, TN?
Percentage of Population with a Degree in Liberal Arts and History in Chattanooga is 5.0%.
What is the Percentage of Population with a Degree in Liberal Arts and History in Tennessee?
Percentage of Population with a Degree in Liberal Arts and History in Tennessee is 4.9%.
What is the Percentage of Population with a Degree in Liberal Arts and History in the United States?
Percentage of Population with a Degree in Liberal Arts and History in the United States is 4.9%.