Duque, PR Map & Demographics
Duque Map
Duque Overview
$12,621
PER CAPITA INCOME
$20,108
AVG FAMILY INCOME
$21,326
AVG HOUSEHOLD INCOME
11.8%
WAGE / INCOME GAP [ % ]
88.2¢/ $1
WAGE / INCOME GAP [ $ ]
0.35
INEQUALITY / GINI INDEX
1,313
TOTAL POPULATION
583
MALE POPULATION
730
FEMALE POPULATION
79.86
MALES / 100 FEMALES
125.21
FEMALES / 100 MALES
53.6
MEDIAN AGE
2.8
AVG FAMILY SIZE
2.3
AVG HOUSEHOLD SIZE
422
LABOR FORCE [ PEOPLE ]
35.7%
PERCENT IN LABOR FORCE
32.0%
UNEMPLOYMENT RATE
Income in Duque
Income Overview in Duque
Per Capita Income in Duque is $12,621, while median incomes of families and households are $20,108 and $21,326 respectively.
| Characteristic | Number | Measure |
| Per Capita Income | 1,313 | $12,621 |
| Median Family Income | 323 | $20,108 |
| Mean Family Income | 323 | $27,219 |
| Median Household Income | 551 | $21,326 |
| Mean Household Income | 551 | $27,075 |
| Income Deficit | 323 | $0 |
| Wage / Income Gap (%) | 1,313 | 11.77% |
| Wage / Income Gap ($) | 1,313 | 88.23¢ per $1 |
| Gini / Inequality Index | 1,313 | 0.35 |
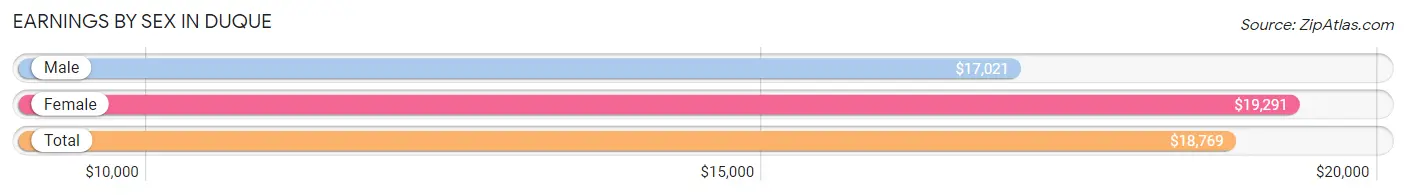
Earnings by Sex in Duque
Average Earnings in Duque are $18,769, $17,021 for men and $19,291 for women, a difference of 11.8%.
| Sex | Number | Average Earnings |
| Male | 118 (30.9%) | $17,021 |
| Female | 264 (69.1%) | $19,291 |
| Total | 382 (100.0%) | $18,769 |
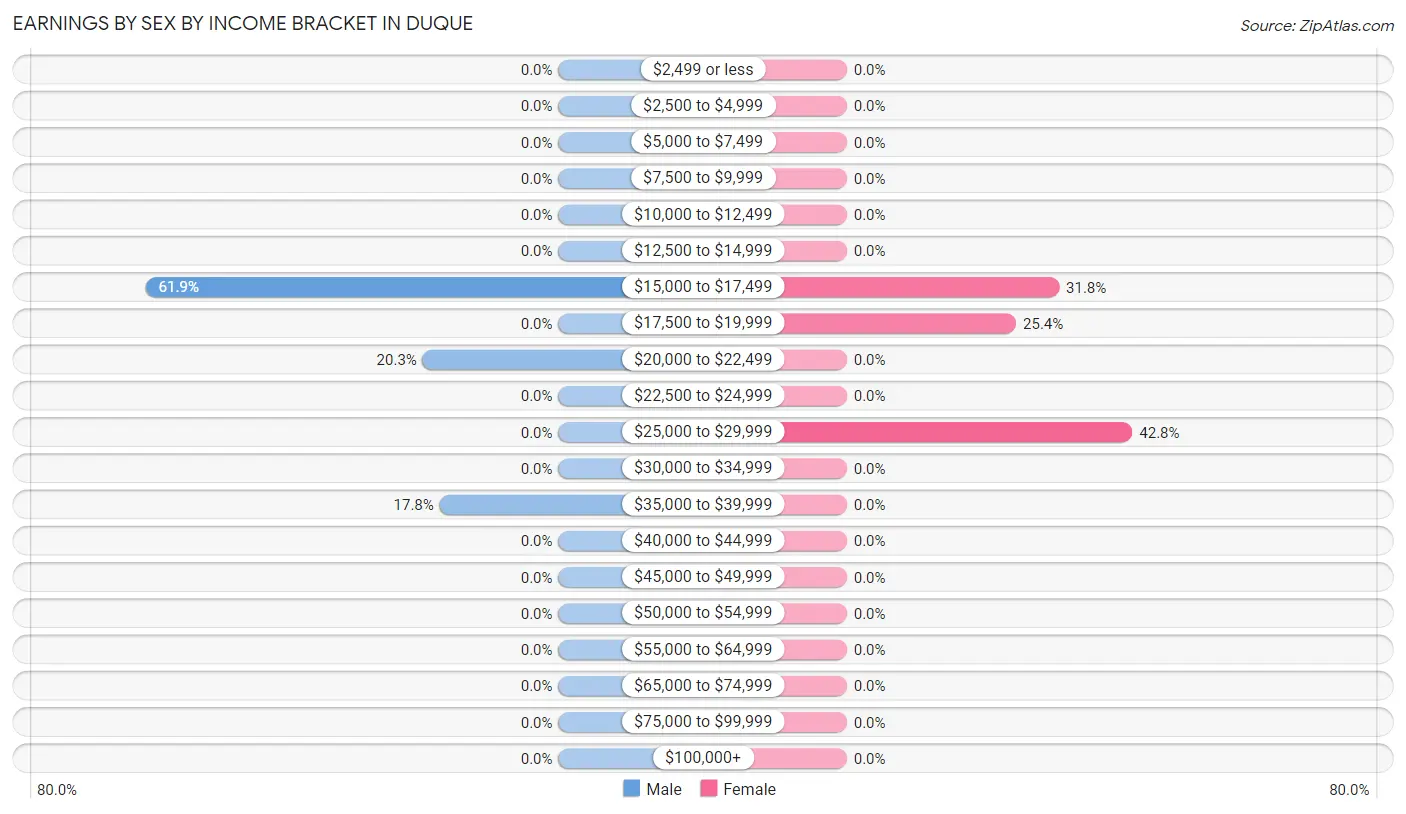
Earnings by Sex by Income Bracket in Duque
The most common earnings brackets in Duque are $15,000 to $17,499 for men (73 | 61.9%) and $25,000 to $29,999 for women (113 | 42.8%).
| Income | Male | Female |
| $2,499 or less | 0 (0.0%) | 0 (0.0%) |
| $2,500 to $4,999 | 0 (0.0%) | 0 (0.0%) |
| $5,000 to $7,499 | 0 (0.0%) | 0 (0.0%) |
| $7,500 to $9,999 | 0 (0.0%) | 0 (0.0%) |
| $10,000 to $12,499 | 0 (0.0%) | 0 (0.0%) |
| $12,500 to $14,999 | 0 (0.0%) | 0 (0.0%) |
| $15,000 to $17,499 | 73 (61.9%) | 84 (31.8%) |
| $17,500 to $19,999 | 0 (0.0%) | 67 (25.4%) |
| $20,000 to $22,499 | 24 (20.3%) | 0 (0.0%) |
| $22,500 to $24,999 | 0 (0.0%) | 0 (0.0%) |
| $25,000 to $29,999 | 0 (0.0%) | 113 (42.8%) |
| $30,000 to $34,999 | 0 (0.0%) | 0 (0.0%) |
| $35,000 to $39,999 | 21 (17.8%) | 0 (0.0%) |
| $40,000 to $44,999 | 0 (0.0%) | 0 (0.0%) |
| $45,000 to $49,999 | 0 (0.0%) | 0 (0.0%) |
| $50,000 to $54,999 | 0 (0.0%) | 0 (0.0%) |
| $55,000 to $64,999 | 0 (0.0%) | 0 (0.0%) |
| $65,000 to $74,999 | 0 (0.0%) | 0 (0.0%) |
| $75,000 to $99,999 | 0 (0.0%) | 0 (0.0%) |
| $100,000+ | 0 (0.0%) | 0 (0.0%) |
| Total | 118 (100.0%) | 264 (100.0%) |
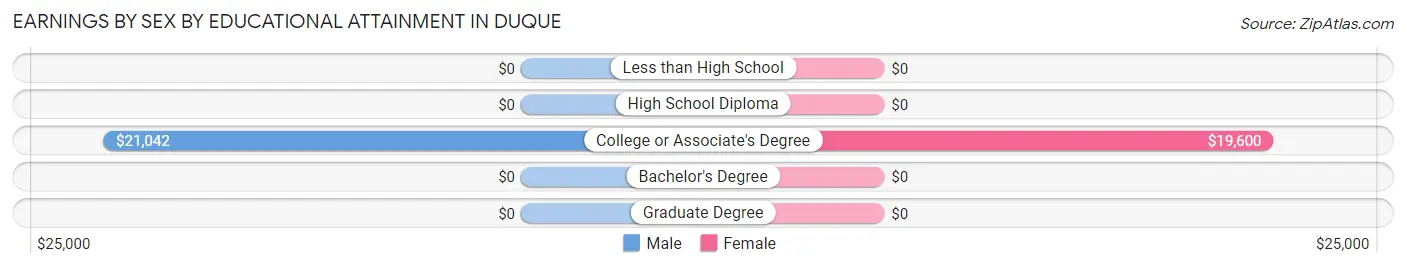
Earnings by Sex by Educational Attainment in Duque
Average earnings in Duque are $17,021 for men and $19,475 for women, a difference of 12.6%. Men with an educational attainment of college or associate's degree enjoy the highest average annual earnings of $21,042, while those with college or associate's degree education earn the least with $21,042. Women with an educational attainment of college or associate's degree earn the most with the average annual earnings of $19,600, while those with college or associate's degree education have the smallest earnings of $19,600.
| Educational Attainment | Male Income | Female Income |
| Less than High School | - | - |
| High School Diploma | - | - |
| College or Associate's Degree | $21,042 | $19,600 |
| Bachelor's Degree | - | - |
| Graduate Degree | - | - |
| Total | $17,021 | $19,475 |
Family Income in Duque
Family Income Brackets in Duque
According to the Duque family income data, there are 83 families falling into the $15,000 to $24,999 income range, which is the most common income bracket and makes up 25.7% of all families.
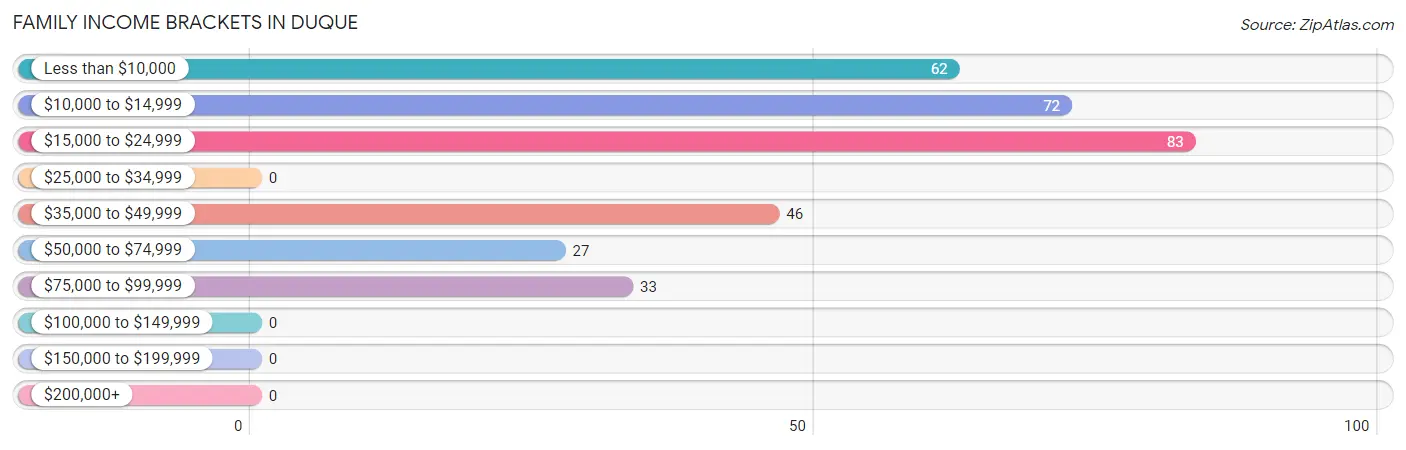
| Income Bracket | # Families | % Families |
| Less than $10,000 | 62 | 19.2% |
| $10,000 to $14,999 | 72 | 22.3% |
| $15,000 to $24,999 | 83 | 25.7% |
| $25,000 to $34,999 | 0 | 0.0% |
| $35,000 to $49,999 | 46 | 14.2% |
| $50,000 to $74,999 | 27 | 8.4% |
| $75,000 to $99,999 | 33 | 10.2% |
| $100,000 to $149,999 | 0 | 0.0% |
| $150,000 to $199,999 | 0 | 0.0% |
| $200,000+ | 0 | 0.0% |
Family Income by Famaliy Size in Duque
2-person families (231 | 71.5%) account for the highest median family income in Duque with $20,108 per family, while 2-person families (231 | 71.5%) have the highest median income of $10,054 per family member.
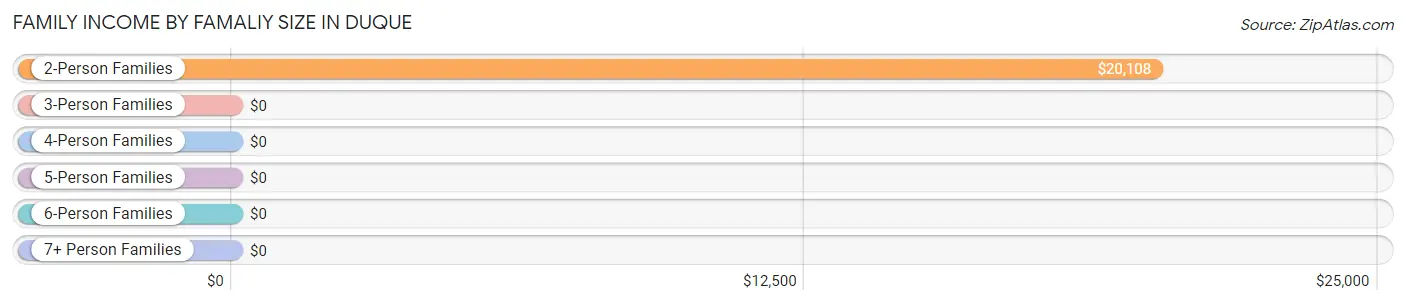
| Income Bracket | # Families | Median Income |
| 2-Person Families | 231 (71.5%) | $20,108 |
| 3-Person Families | 67 (20.7%) | $0 |
| 4-Person Families | 25 (7.7%) | $0 |
| 5-Person Families | 0 (0.0%) | $0 |
| 6-Person Families | 0 (0.0%) | $0 |
| 7+ Person Families | 0 (0.0%) | $0 |
| Total | 323 (100.0%) | $20,108 |
Family Income by Number of Earners in Duque
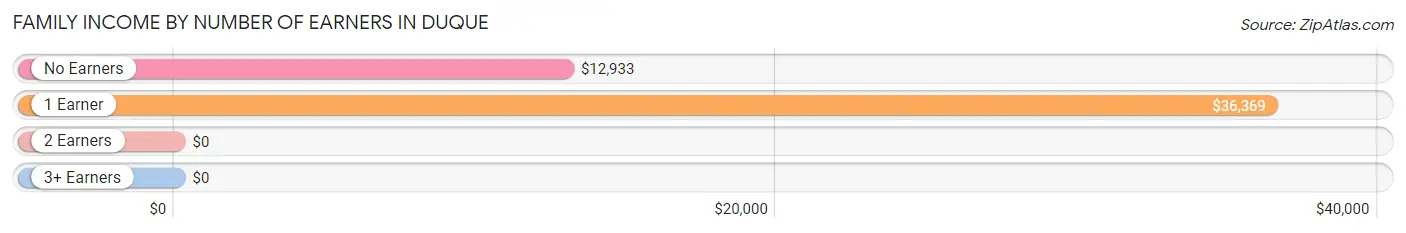
| Number of Earners | # Families | Median Income |
| No Earners | 225 (69.7%) | $12,933 |
| 1 Earner | 73 (22.6%) | $36,369 |
| 2 Earners | 25 (7.7%) | $0 |
| 3+ Earners | 0 (0.0%) | $0 |
| Total | 323 (100.0%) | $20,108 |
Household Income in Duque
Household Income Brackets in Duque
With 180 households falling in the category, the $15,000 to $24,999 income range is the most frequent in Duque, accounting for 32.7% of all households.
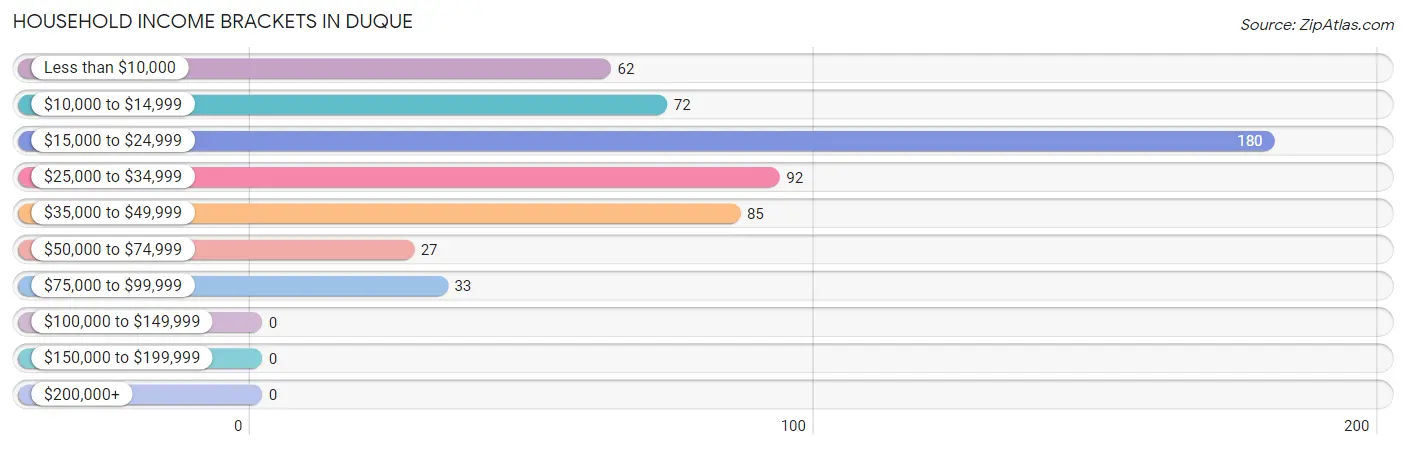
| Income Bracket | # Households | % Households |
| Less than $10,000 | 62 | 11.3% |
| $10,000 to $14,999 | 72 | 13.1% |
| $15,000 to $24,999 | 180 | 32.7% |
| $25,000 to $34,999 | 92 | 16.7% |
| $35,000 to $49,999 | 85 | 15.4% |
| $50,000 to $74,999 | 27 | 4.9% |
| $75,000 to $99,999 | 33 | 6.0% |
| $100,000 to $149,999 | 0 | 0.0% |
| $150,000 to $199,999 | 0 | 0.0% |
| $200,000+ | 0 | 0.0% |
Household Income by Householder Age in Duque
The median household income in Duque is $21,326, with the highest median household income of $40,481 found in the 65+ years age bracket for the primary householder. A total of 183 households (33.2%) fall into this category. Meanwhile, the 15 to 24 years age bracket for the primary householder has the lowest median household income of $0, with 17 households (3.1%) in this group.
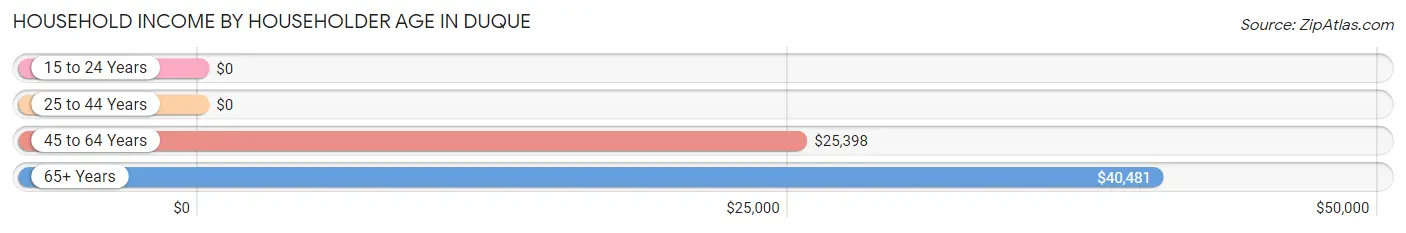
| Income Bracket | # Households | Median Income |
| 15 to 24 Years | 17 (3.1%) | $0 |
| 25 to 44 Years | 89 (16.2%) | $0 |
| 45 to 64 Years | 262 (47.5%) | $25,398 |
| 65+ Years | 183 (33.2%) | $40,481 |
| Total | 551 (100.0%) | $21,326 |
Poverty in Duque
Income Below Poverty by Sex and Age in Duque
With 56.6% poverty level for males and 29.0% for females among the residents of Duque, 6 to 11 year old males and 25 to 34 year old females are the most vulnerable to poverty, with 66 males (100.0%) and 40 females (100.0%) in their respective age groups living below the poverty level.

| Age Bracket | Male | Female |
| Under 5 Years | 0 (0.0%) | 0 (0.0%) |
| 5 Years | 0 (0.0%) | 0 (0.0%) |
| 6 to 11 Years | 66 (100.0%) | 0 (0.0%) |
| 12 to 14 Years | 0 (0.0%) | 0 (0.0%) |
| 15 Years | 0 (0.0%) | 0 (0.0%) |
| 16 and 17 Years | 0 (0.0%) | 0 (0.0%) |
| 18 to 24 Years | 0 (0.0%) | 17 (23.9%) |
| 25 to 34 Years | 0 (0.0%) | 40 (100.0%) |
| 35 to 44 Years | 113 (82.5%) | 0 (0.0%) |
| 45 to 54 Years | 44 (47.8%) | 25 (15.9%) |
| 55 to 64 Years | 66 (58.9%) | 94 (75.2%) |
| 65 to 74 Years | 0 (0.0%) | 26 (20.0%) |
| 75 Years and over | 35 (51.5%) | 8 (19.1%) |
| Total | 324 (56.6%) | 210 (29.0%) |
Income Above Poverty by Sex and Age in Duque
According to the poverty statistics in Duque, males aged 65 to 74 years and females aged 6 to 11 years are the age groups that are most secure financially, with 100.0% of males and 100.0% of females in these age groups living above the poverty line.
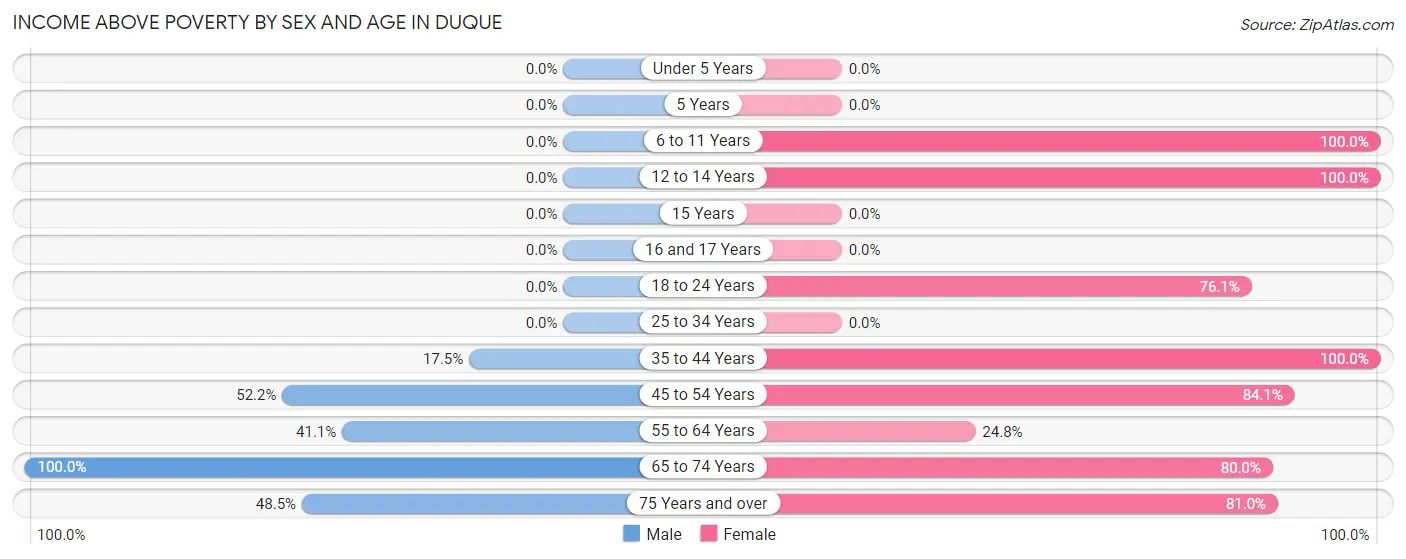
| Age Bracket | Male | Female |
| Under 5 Years | 0 (0.0%) | 0 (0.0%) |
| 5 Years | 0 (0.0%) | 0 (0.0%) |
| 6 to 11 Years | 0 (0.0%) | 32 (100.0%) |
| 12 to 14 Years | 0 (0.0%) | 32 (100.0%) |
| 15 Years | 0 (0.0%) | 0 (0.0%) |
| 16 and 17 Years | 0 (0.0%) | 0 (0.0%) |
| 18 to 24 Years | 0 (0.0%) | 54 (76.1%) |
| 25 to 34 Years | 0 (0.0%) | 0 (0.0%) |
| 35 to 44 Years | 24 (17.5%) | 95 (100.0%) |
| 45 to 54 Years | 48 (52.2%) | 132 (84.1%) |
| 55 to 64 Years | 46 (41.1%) | 31 (24.8%) |
| 65 to 74 Years | 97 (100.0%) | 104 (80.0%) |
| 75 Years and over | 33 (48.5%) | 34 (80.9%) |
| Total | 248 (43.4%) | 514 (71.0%) |
Income Below Poverty Among Married-Couple Families in Duque
The poverty statistics for married-couple families in Duque show that 40.7% or 94 of the total 231 families live below the poverty line. Families with no children have the highest poverty rate of 45.6%, comprising of 94 families. On the other hand, families with 1 or 2 children have the lowest poverty rate of 0.0%, which includes 0 families.
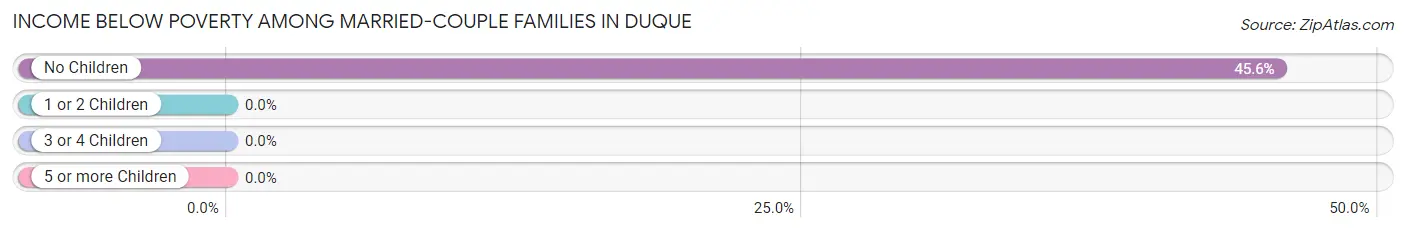
| Children | Above Poverty | Below Poverty |
| No Children | 112 (54.4%) | 94 (45.6%) |
| 1 or 2 Children | 25 (100.0%) | 0 (0.0%) |
| 3 or 4 Children | 0 (0.0%) | 0 (0.0%) |
| 5 or more Children | 0 (0.0%) | 0 (0.0%) |
| Total | 137 (59.3%) | 94 (40.7%) |
Income Below Poverty Among Single-Parent Households in Duque
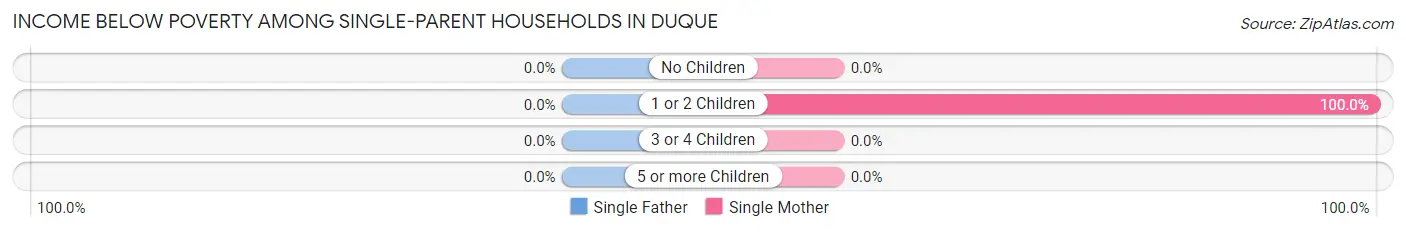
| Children | Single Father | Single Mother |
| No Children | 0 (0.0%) | 0 (0.0%) |
| 1 or 2 Children | 0 (0.0%) | 65 (100.0%) |
| 3 or 4 Children | 0 (0.0%) | 0 (0.0%) |
| 5 or more Children | 0 (0.0%) | 0 (0.0%) |
| Total | 0 (0.0%) | 65 (70.7%) |
Income Below Poverty Among Married-Couple vs Single-Parent Households in Duque
The poverty data for Duque shows that 94 of the married-couple family households (40.7%) and 65 of the single-parent households (70.7%) are living below the poverty level. Within the married-couple family households, those with no children have the highest poverty rate, with 94 households (45.6%) falling below the poverty line. Among the single-parent households, those with 1 or 2 children have the highest poverty rate, with 65 household (100.0%) living below poverty.
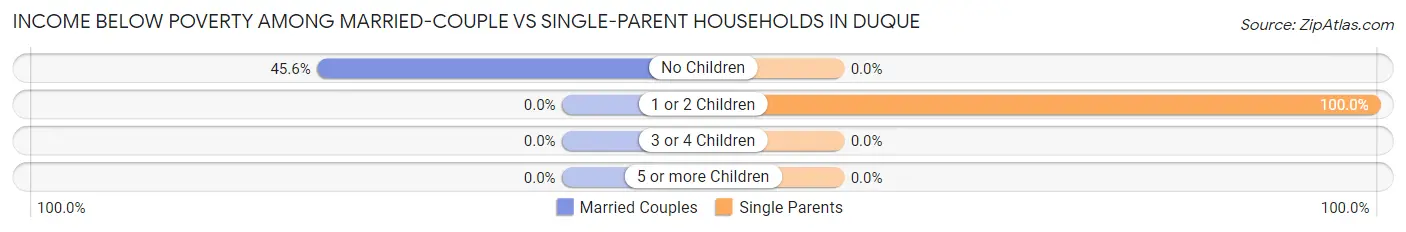
| Children | Married-Couple Families | Single-Parent Households |
| No Children | 94 (45.6%) | 0 (0.0%) |
| 1 or 2 Children | 0 (0.0%) | 65 (100.0%) |
| 3 or 4 Children | 0 (0.0%) | 0 (0.0%) |
| 5 or more Children | 0 (0.0%) | 0 (0.0%) |
| Total | 94 (40.7%) | 65 (70.7%) |
Race in Duque
The most populous races in Duque are Hispanic or Latino (1,313 | 100.0%), Some other Race (902 | 68.7%), and White / Caucasian (286 | 21.8%).
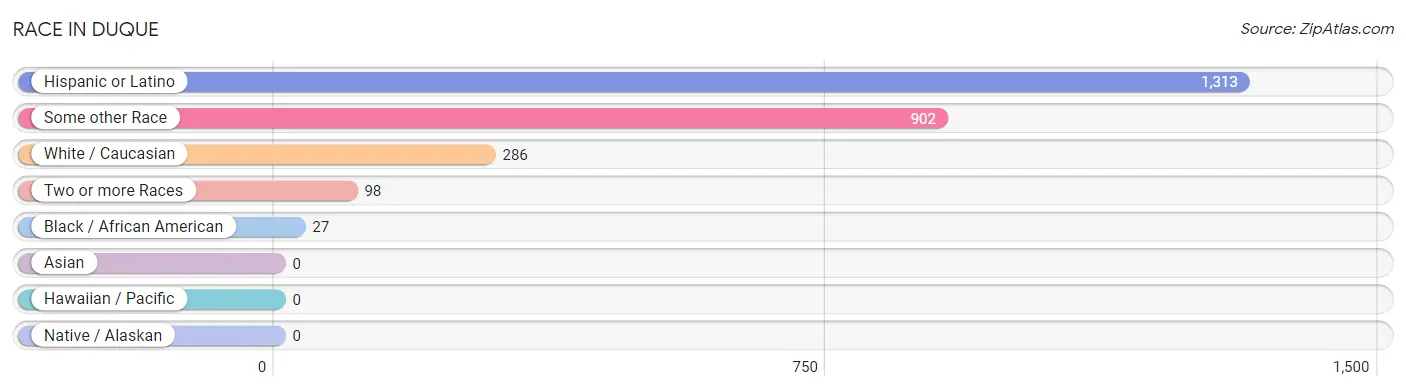
| Race | # Population | % Population |
| Asian | 0 | 0.0% |
| Black / African American | 27 | 2.1% |
| Hawaiian / Pacific | 0 | 0.0% |
| Hispanic or Latino | 1,313 | 100.0% |
| Native / Alaskan | 0 | 0.0% |
| White / Caucasian | 286 | 21.8% |
| Two or more Races | 98 | 7.5% |
| Some other Race | 902 | 68.7% |
| Total | 1,313 | 100.0% |
Ancestry in Duque
The most populous ancestries reported in Duque are , and Puerto Rican (1,313 | 100.0%), together accounting for 100.0% of all Duque residents.

| Ancestry | # Population | % Population |
| Puerto Rican | 1,313 | 100.0% | View All 1 Rows |
Immigrants in Duque

| Immigration Origin | # Population | % Population | View All 0 Rows |
Sex and Age in Duque
Sex and Age in Duque
The most populous age groups in Duque are 35 to 39 Years (113 | 19.4%) for men and 50 to 54 Years (132 | 18.1%) for women.
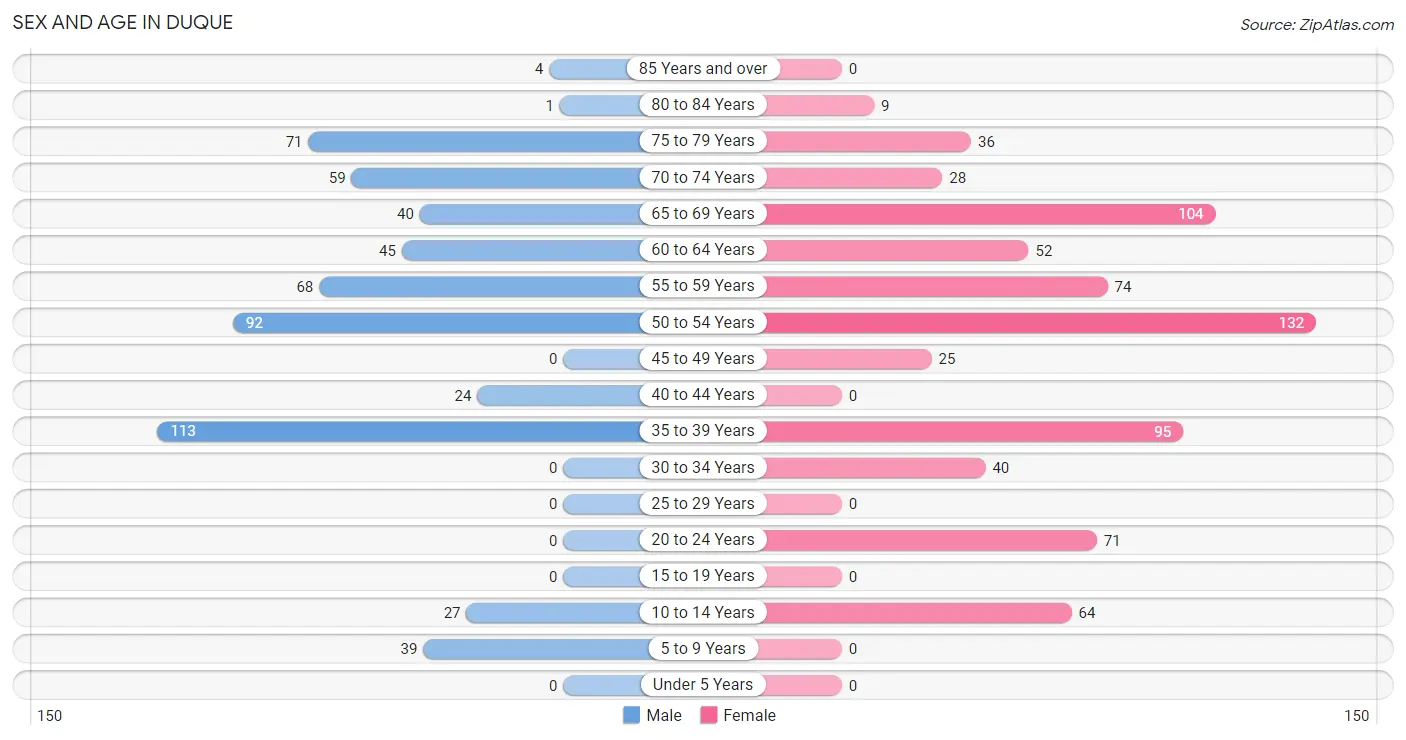
| Age Bracket | Male | Female |
| Under 5 Years | 0 (0.0%) | 0 (0.0%) |
| 5 to 9 Years | 39 (6.7%) | 0 (0.0%) |
| 10 to 14 Years | 27 (4.6%) | 64 (8.8%) |
| 15 to 19 Years | 0 (0.0%) | 0 (0.0%) |
| 20 to 24 Years | 0 (0.0%) | 71 (9.7%) |
| 25 to 29 Years | 0 (0.0%) | 0 (0.0%) |
| 30 to 34 Years | 0 (0.0%) | 40 (5.5%) |
| 35 to 39 Years | 113 (19.4%) | 95 (13.0%) |
| 40 to 44 Years | 24 (4.1%) | 0 (0.0%) |
| 45 to 49 Years | 0 (0.0%) | 25 (3.4%) |
| 50 to 54 Years | 92 (15.8%) | 132 (18.1%) |
| 55 to 59 Years | 68 (11.7%) | 74 (10.1%) |
| 60 to 64 Years | 45 (7.7%) | 52 (7.1%) |
| 65 to 69 Years | 40 (6.9%) | 104 (14.2%) |
| 70 to 74 Years | 59 (10.1%) | 28 (3.8%) |
| 75 to 79 Years | 71 (12.2%) | 36 (4.9%) |
| 80 to 84 Years | 1 (0.2%) | 9 (1.2%) |
| 85 Years and over | 4 (0.7%) | 0 (0.0%) |
| Total | 583 (100.0%) | 730 (100.0%) |
Families and Households in Duque
Median Family Size in Duque
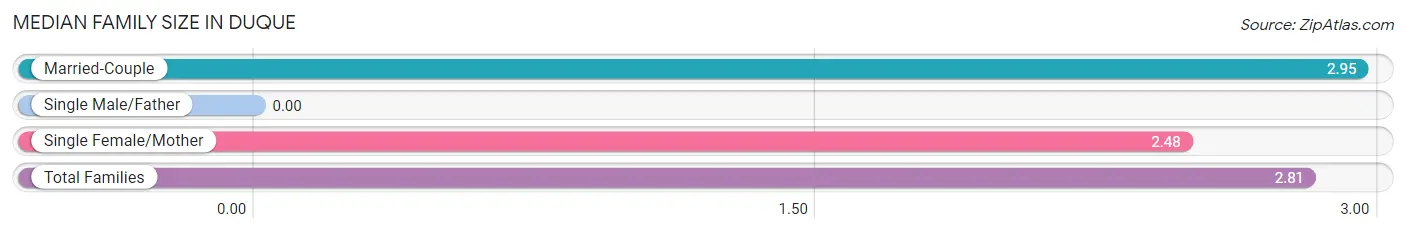
| Family Type | # Families | Family Size |
| Married-Couple | 231 (71.5%) | 2.95 |
| Single Male/Father | 0 (0.0%) | - |
| Single Female/Mother | 92 (28.5%) | 2.48 |
| Total Families | 323 (100.0%) | 2.81 |
Median Household Size in Duque
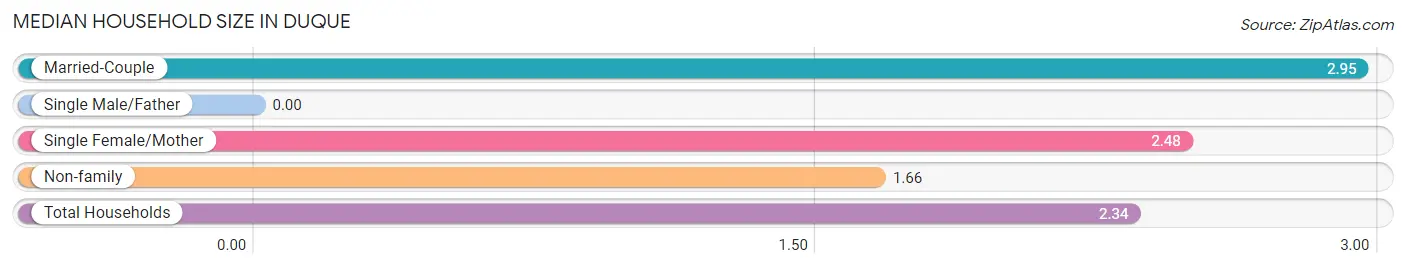
| Household Type | # Households | Household Size |
| Married-Couple | 231 (41.9%) | 2.95 |
| Single Male/Father | 0 (0.0%) | - |
| Single Female/Mother | 92 (16.7%) | 2.48 |
| Non-family | 228 (41.4%) | 1.66 |
| Total Households | 551 (100.0%) | 2.34 |
Household Size by Marriage Status in Duque
Out of a total of 551 households in Duque, 323 (58.6%) are family households, while 228 (41.4%) are nonfamily households. The most numerous type of family households are 2-person households, comprising 231, and the most common type of nonfamily households are 2-person households, comprising 148.
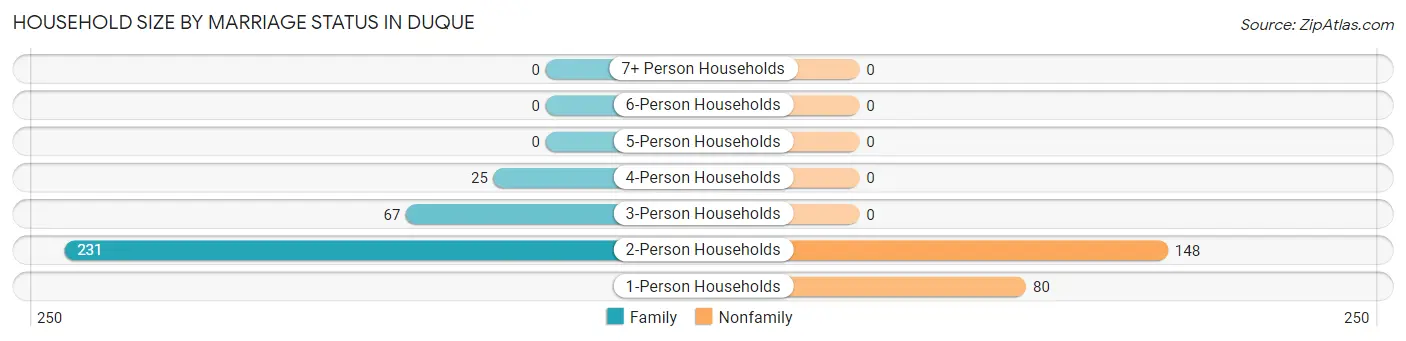
| Household Size | Family Households | Nonfamily Households |
| 1-Person Households | - | 80 (14.5%) |
| 2-Person Households | 231 (41.9%) | 148 (26.9%) |
| 3-Person Households | 67 (12.2%) | 0 (0.0%) |
| 4-Person Households | 25 (4.5%) | 0 (0.0%) |
| 5-Person Households | 0 (0.0%) | 0 (0.0%) |
| 6-Person Households | 0 (0.0%) | 0 (0.0%) |
| 7+ Person Households | 0 (0.0%) | 0 (0.0%) |
| Total | 323 (58.6%) | 228 (41.4%) |
Female Fertility in Duque
Fertility by Age in Duque
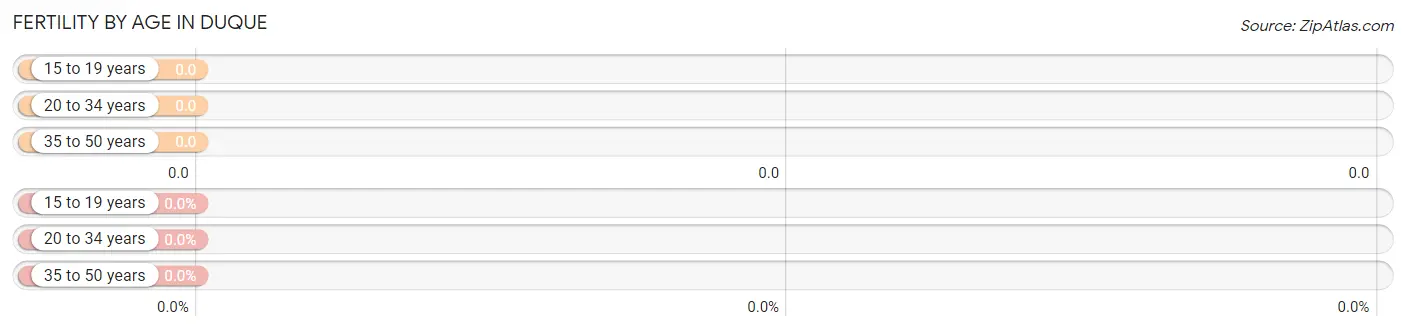
| Age Bracket | Women with Births | Births / 1,000 Women |
| 15 to 19 years | 0 (0.0%) | 0.0 |
| 20 to 34 years | 0 (0.0%) | 0.0 |
| 35 to 50 years | 0 (0.0%) | 0.0 |
| Total | 0 (0.0%) | 0.0 |
Fertility by Age by Marriage Status in Duque
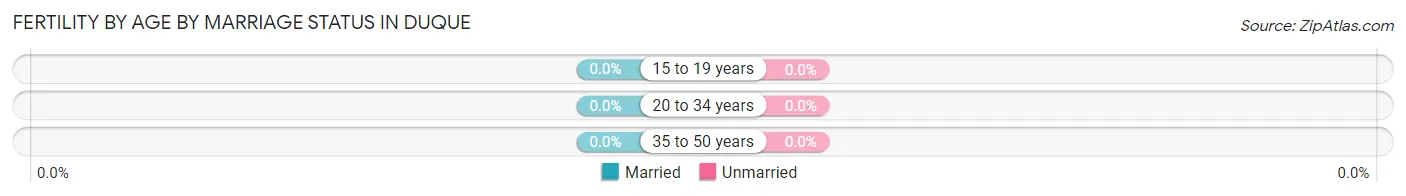
| Age Bracket | Married | Unmarried |
| 15 to 19 years | 0 (0.0%) | 0 (0.0%) |
| 20 to 34 years | 0 (0.0%) | 0 (0.0%) |
| 35 to 50 years | 0 (0.0%) | 0 (0.0%) |
| Total | 0 (0.0%) | 0 (0.0%) |
Fertility by Education in Duque
| Educational Attainment | Women with Births | Births / 1,000 Women |
| Less than High School | 0 (0.0%) | 0.0 |
| High School Diploma | 0 (0.0%) | 0.0 |
| College or Associate's Degree | 0 (0.0%) | 0.0 |
| Bachelor's Degree | 0 (0.0%) | 0.0 |
| Graduate Degree | 0 (0.0%) | 0.0 |
| Total | 0 (0.0%) | 0.0 |
Fertility by Education by Marriage Status in Duque
| Educational Attainment | Married | Unmarried |
| Less than High School | 0 (0.0%) | 0 (0.0%) |
| High School Diploma | 0 (0.0%) | 0 (0.0%) |
| College or Associate's Degree | 0 (0.0%) | 0 (0.0%) |
| Bachelor's Degree | 0 (0.0%) | 0 (0.0%) |
| Graduate Degree | 0 (0.0%) | 0 (0.0%) |
| Total | 0 (0.0%) | 0 (0.0%) |
Employment Characteristics in Duque
Employment by Class of Employer in Duque
Among the 287 employed individuals in Duque, private company employees (185 | 64.5%), self-employed (not incorporated) (56 | 19.5%), and local government employees (25 | 8.7%) make up the most common classes of employment.
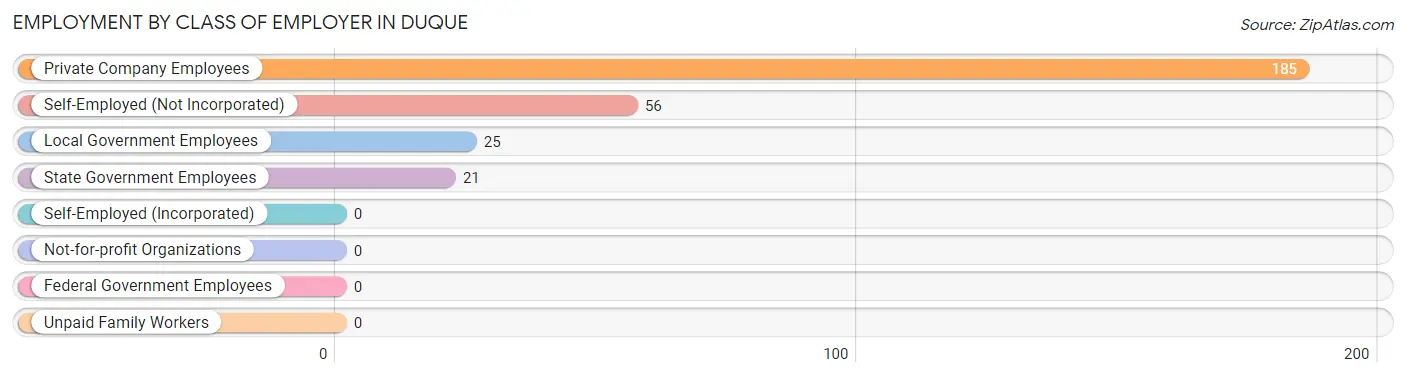
| Employer Class | # Employees | % Employees |
| Private Company Employees | 185 | 64.5% |
| Self-Employed (Incorporated) | 0 | 0.0% |
| Self-Employed (Not Incorporated) | 56 | 19.5% |
| Not-for-profit Organizations | 0 | 0.0% |
| Local Government Employees | 25 | 8.7% |
| State Government Employees | 21 | 7.3% |
| Federal Government Employees | 0 | 0.0% |
| Unpaid Family Workers | 0 | 0.0% |
| Total | 287 | 100.0% |
Employment Status by Age in Duque
According to the labor force statistics for Duque, out of the total population over 16 years of age (1,183), 35.7% or 422 individuals are in the labor force, with 32.0% or 135 of them unemployed. The age group with the highest labor force participation rate is 35 to 44 years, with 69.8% or 162 individuals in the labor force. Within the labor force, the 35 to 44 years age range has the highest percentage of unemployed individuals, with 69.8% or 113 of them being unemployed.
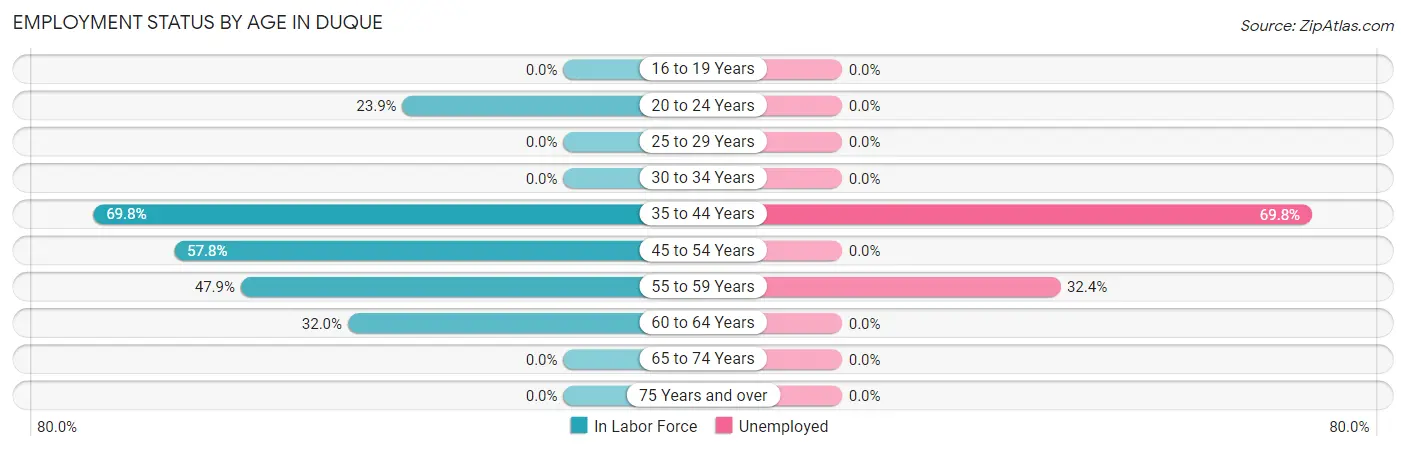
| Age Bracket | In Labor Force | Unemployed |
| 16 to 19 Years | 0 (0.0%) | 0 (0.0%) |
| 20 to 24 Years | 17 (23.9%) | 0 (0.0%) |
| 25 to 29 Years | 0 (0.0%) | 0 (0.0%) |
| 30 to 34 Years | 0 (0.0%) | 0 (0.0%) |
| 35 to 44 Years | 162 (69.8%) | 113 (69.8%) |
| 45 to 54 Years | 144 (57.8%) | 0 (0.0%) |
| 55 to 59 Years | 68 (47.9%) | 22 (32.4%) |
| 60 to 64 Years | 31 (32.0%) | 0 (0.0%) |
| 65 to 74 Years | 0 (0.0%) | 0 (0.0%) |
| 75 Years and over | 0 (0.0%) | 0 (0.0%) |
| Total | 422 (35.7%) | 135 (32.0%) |
Employment Status by Educational Attainment in Duque
According to labor force statistics for Duque, 53.3% of individuals (405) out of the total population between 25 and 64 years of age (760) are in the labor force, with 33.3% or 135 of them being unemployed. The group with the highest labor force participation rate are those with the educational attainment of high school diploma, with 61.5% or 144 individuals in the labor force. Within the labor force, individuals with high school diploma education have the highest percentage of unemployment, with 78.5% or 113 of them being unemployed.
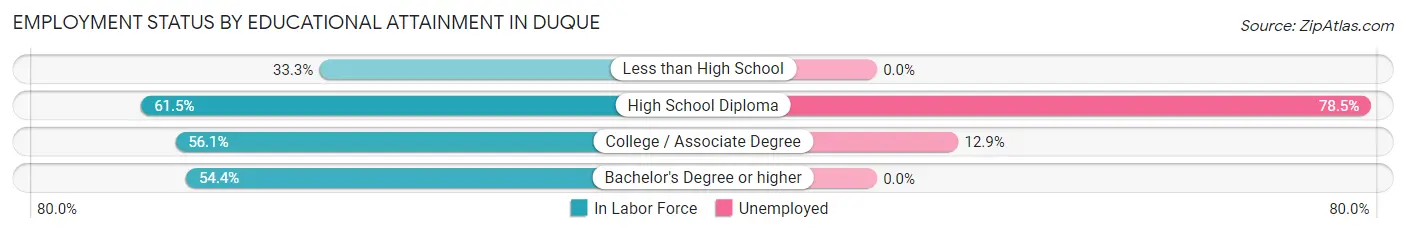
| Educational Attainment | In Labor Force | Unemployed |
| Less than High School | 48 (33.3%) | 0 (0.0%) |
| High School Diploma | 144 (61.5%) | 184 (78.5%) |
| College / Associate Degree | 170 (56.1%) | 39 (12.9%) |
| Bachelor's Degree or higher | 43 (54.4%) | 0 (0.0%) |
| Total | 405 (53.3%) | 253 (33.3%) |
Employment Occupations by Sex in Duque
Management, Business, Science and Arts Occupations
The most common Management, Business, Science and Arts occupations in Duque are , and Business & Financial (43 | 15.0%).
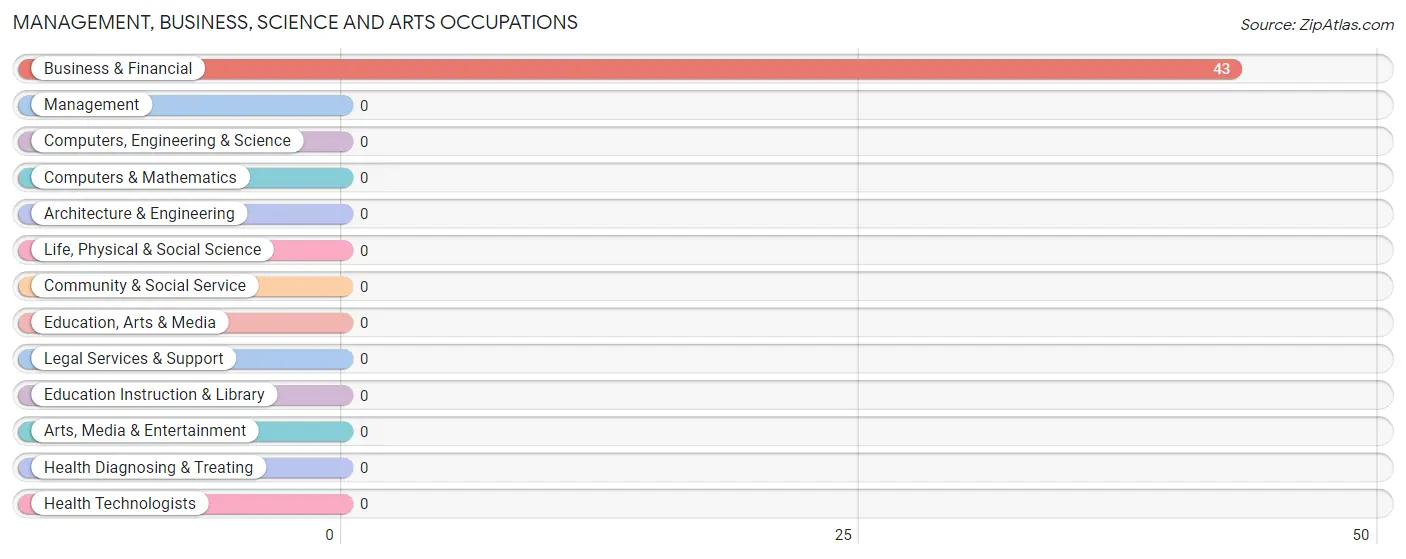
Management, Business, Science and Arts Occupations by Sex
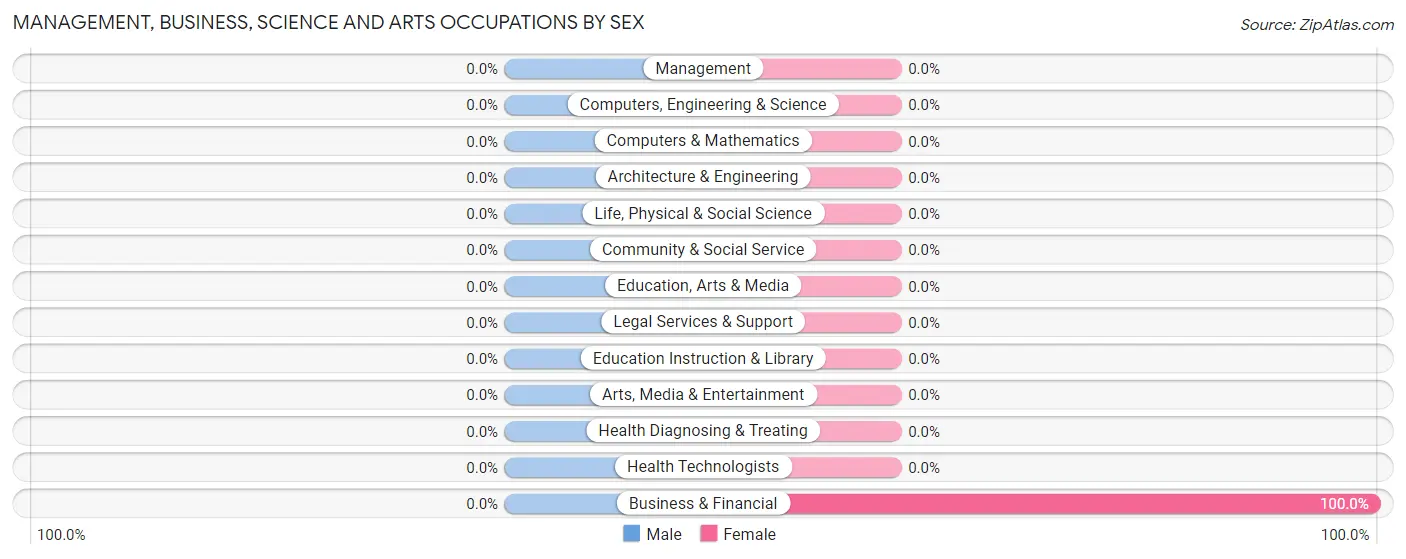
| Occupation | Male | Female |
| Management | 0 (0.0%) | 0 (0.0%) |
| Business & Financial | 0 (0.0%) | 43 (100.0%) |
| Computers, Engineering & Science | 0 (0.0%) | 0 (0.0%) |
| Computers & Mathematics | 0 (0.0%) | 0 (0.0%) |
| Architecture & Engineering | 0 (0.0%) | 0 (0.0%) |
| Life, Physical & Social Science | 0 (0.0%) | 0 (0.0%) |
| Community & Social Service | 0 (0.0%) | 0 (0.0%) |
| Education, Arts & Media | 0 (0.0%) | 0 (0.0%) |
| Legal Services & Support | 0 (0.0%) | 0 (0.0%) |
| Education Instruction & Library | 0 (0.0%) | 0 (0.0%) |
| Arts, Media & Entertainment | 0 (0.0%) | 0 (0.0%) |
| Health Diagnosing & Treating | 0 (0.0%) | 0 (0.0%) |
| Health Technologists | 0 (0.0%) | 0 (0.0%) |
| Total (Category) | 0 (0.0%) | 43 (100.0%) |
| Total (Overall) | 118 (41.1%) | 169 (58.9%) |
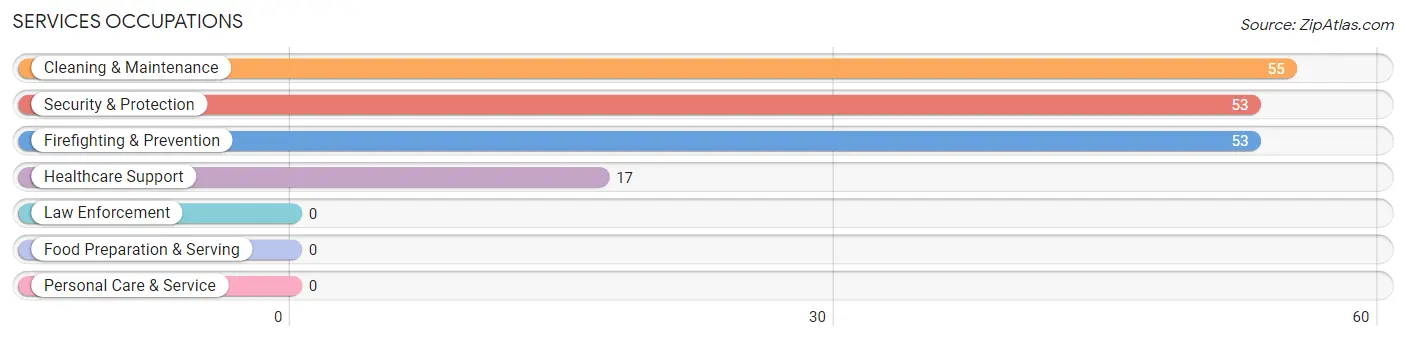
Services Occupations
The most common Services occupations in Duque are Cleaning & Maintenance (55 | 19.2%), Security & Protection (53 | 18.5%), Firefighting & Prevention (53 | 18.5%), and Healthcare Support (17 | 5.9%).
Services Occupations by Sex
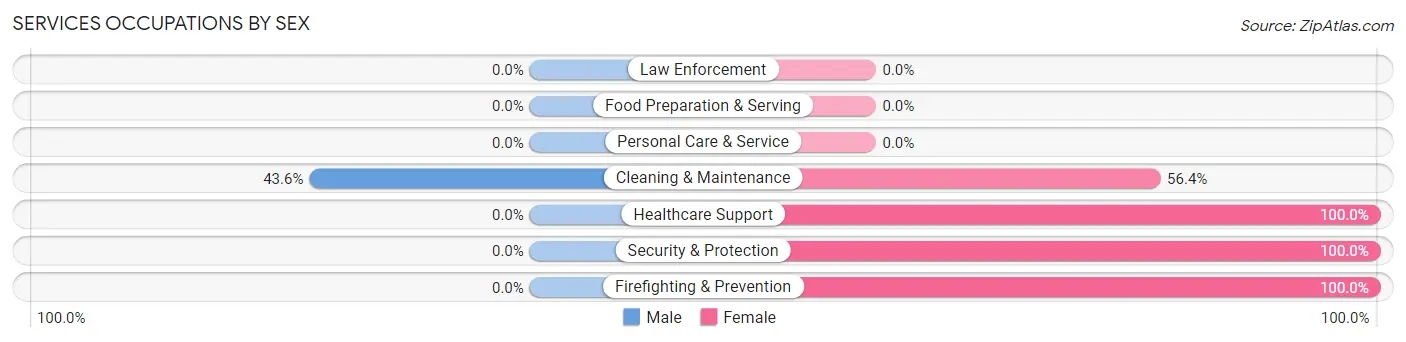
| Occupation | Male | Female |
| Healthcare Support | 0 (0.0%) | 17 (100.0%) |
| Security & Protection | 0 (0.0%) | 53 (100.0%) |
| Firefighting & Prevention | 0 (0.0%) | 53 (100.0%) |
| Law Enforcement | 0 (0.0%) | 0 (0.0%) |
| Food Preparation & Serving | 0 (0.0%) | 0 (0.0%) |
| Cleaning & Maintenance | 24 (43.6%) | 31 (56.4%) |
| Personal Care & Service | 0 (0.0%) | 0 (0.0%) |
| Total (Category) | 24 (19.2%) | 101 (80.8%) |
| Total (Overall) | 118 (41.1%) | 169 (58.9%) |
Sales and Office Occupations
The most common Sales and Office occupations in Duque are Office & Administration (46 | 16.0%), and Sales & Related (25 | 8.7%).

Sales and Office Occupations by Sex

| Occupation | Male | Female |
| Sales & Related | 25 (100.0%) | 0 (0.0%) |
| Office & Administration | 21 (45.7%) | 25 (54.3%) |
| Total (Category) | 46 (64.8%) | 25 (35.2%) |
| Total (Overall) | 118 (41.1%) | 169 (58.9%) |
Natural Resources, Construction and Maintenance Occupations
The most common Natural Resources, Construction and Maintenance occupations in Duque are , and Construction & Extraction (48 | 16.7%).
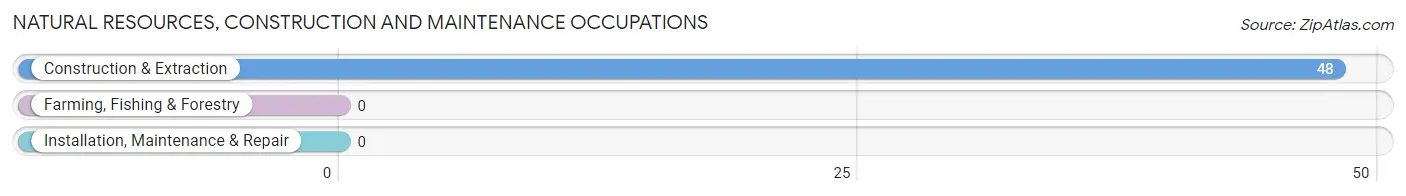
Natural Resources, Construction and Maintenance Occupations by Sex
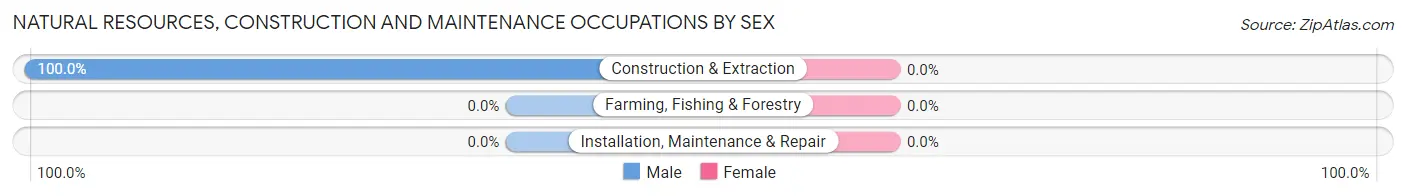
| Occupation | Male | Female |
| Farming, Fishing & Forestry | 0 (0.0%) | 0 (0.0%) |
| Construction & Extraction | 48 (100.0%) | 0 (0.0%) |
| Installation, Maintenance & Repair | 0 (0.0%) | 0 (0.0%) |
| Total (Category) | 48 (100.0%) | 0 (0.0%) |
| Total (Overall) | 118 (41.1%) | 169 (58.9%) |
Production, Transportation and Moving Occupations
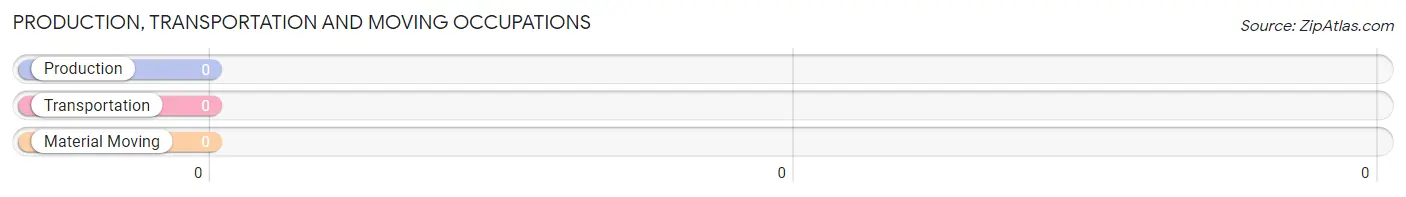
Production, Transportation and Moving Occupations by Sex
| Occupation | Male | Female |
| Production | 0 (0.0%) | 0 (0.0%) |
| Transportation | 0 (0.0%) | 0 (0.0%) |
| Material Moving | 0 (0.0%) | 0 (0.0%) |
| Total (Category) | 0 (0.0%) | 0 (0.0%) |
| Total (Overall) | 118 (41.1%) | 169 (58.9%) |
Employment Industries by Sex in Duque
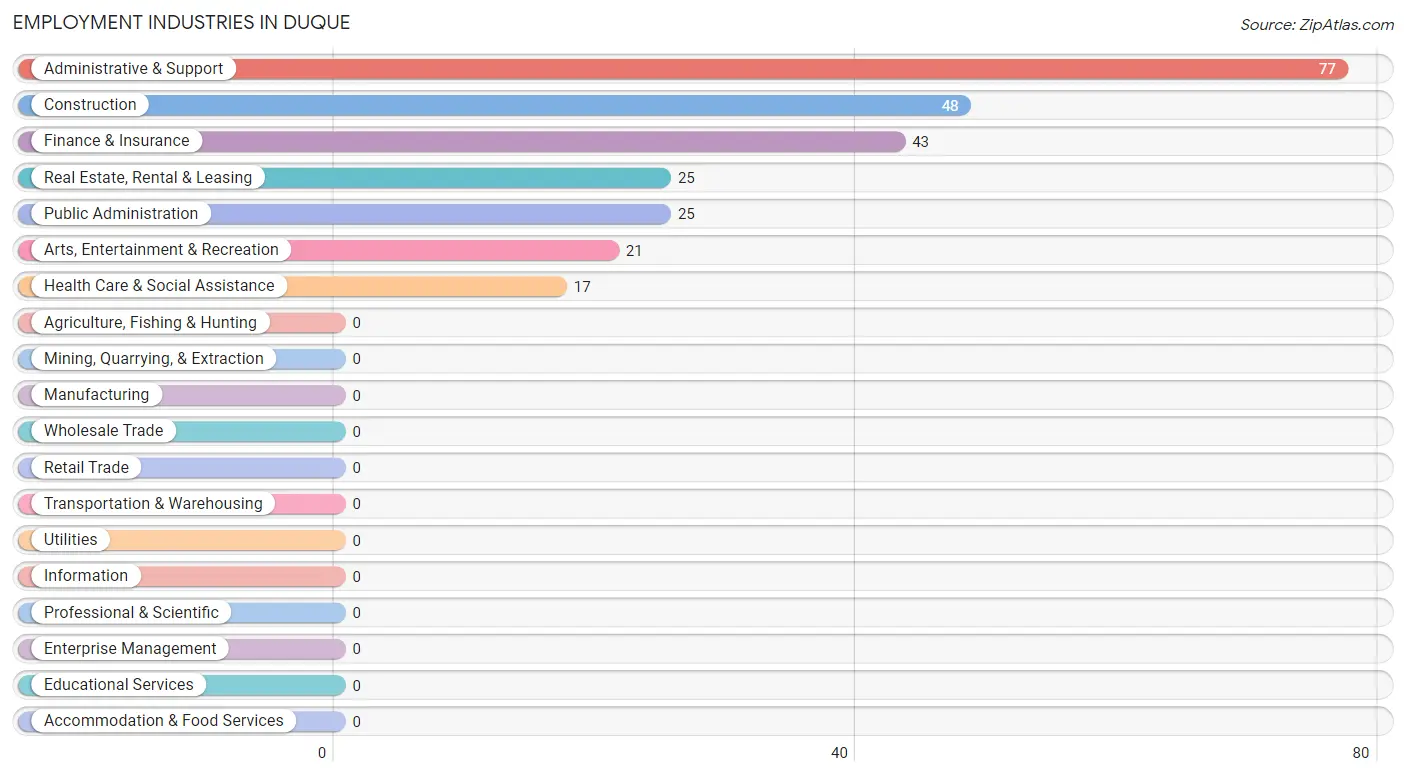
Employment Industries in Duque
The major employment industries in Duque include Administrative & Support (77 | 26.8%), Construction (48 | 16.7%), Finance & Insurance (43 | 15.0%), Real Estate, Rental & Leasing (25 | 8.7%), and Public Administration (25 | 8.7%).
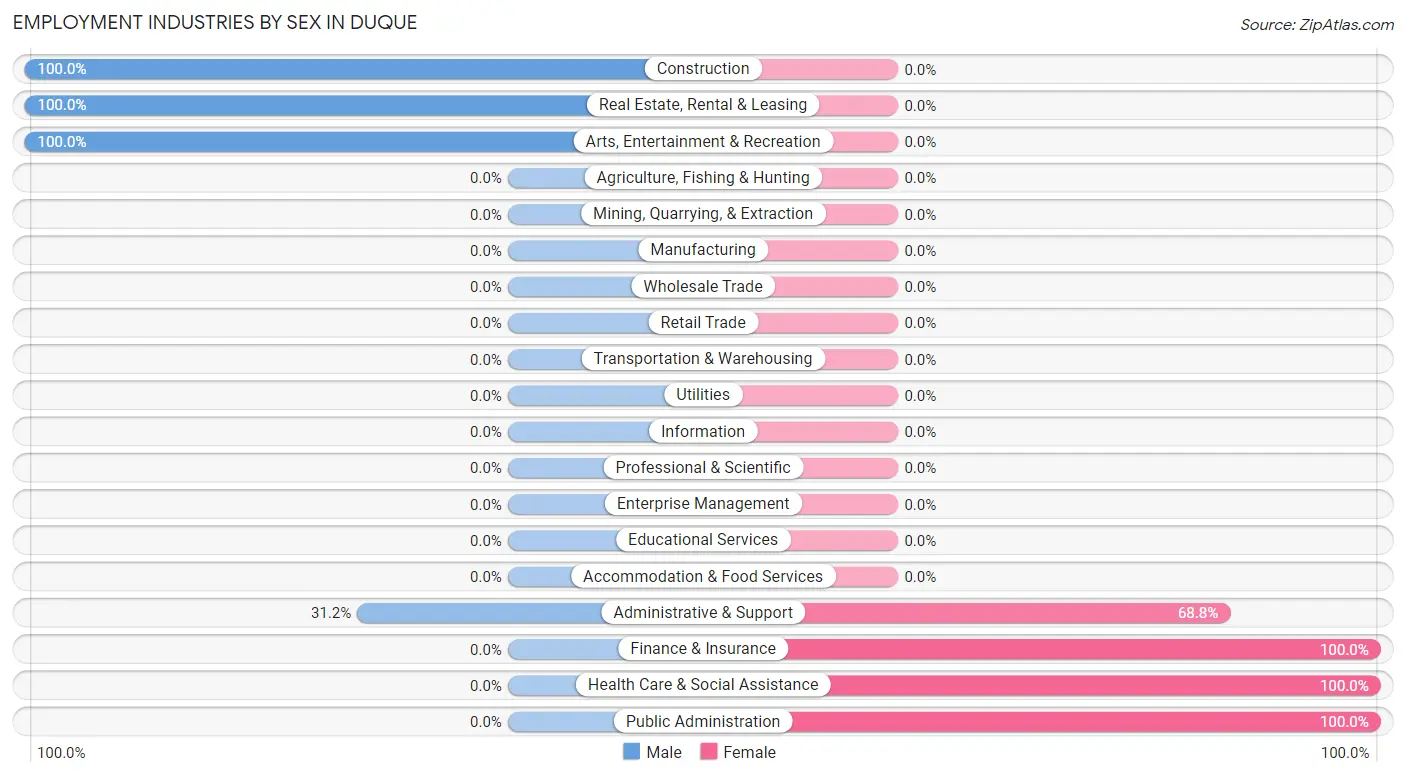
Employment Industries by Sex in Duque
The Duque industries that see more men than women are Construction (100.0%), Real Estate, Rental & Leasing (100.0%), and Arts, Entertainment & Recreation (100.0%), whereas the industries that tend to have a higher number of women are Finance & Insurance (100.0%), Health Care & Social Assistance (100.0%), and Public Administration (100.0%).
| Industry | Male | Female |
| Agriculture, Fishing & Hunting | 0 (0.0%) | 0 (0.0%) |
| Mining, Quarrying, & Extraction | 0 (0.0%) | 0 (0.0%) |
| Construction | 48 (100.0%) | 0 (0.0%) |
| Manufacturing | 0 (0.0%) | 0 (0.0%) |
| Wholesale Trade | 0 (0.0%) | 0 (0.0%) |
| Retail Trade | 0 (0.0%) | 0 (0.0%) |
| Transportation & Warehousing | 0 (0.0%) | 0 (0.0%) |
| Utilities | 0 (0.0%) | 0 (0.0%) |
| Information | 0 (0.0%) | 0 (0.0%) |
| Finance & Insurance | 0 (0.0%) | 43 (100.0%) |
| Real Estate, Rental & Leasing | 25 (100.0%) | 0 (0.0%) |
| Professional & Scientific | 0 (0.0%) | 0 (0.0%) |
| Enterprise Management | 0 (0.0%) | 0 (0.0%) |
| Administrative & Support | 24 (31.2%) | 53 (68.8%) |
| Educational Services | 0 (0.0%) | 0 (0.0%) |
| Health Care & Social Assistance | 0 (0.0%) | 17 (100.0%) |
| Arts, Entertainment & Recreation | 21 (100.0%) | 0 (0.0%) |
| Accommodation & Food Services | 0 (0.0%) | 0 (0.0%) |
| Public Administration | 0 (0.0%) | 25 (100.0%) |
| Total | 118 (41.1%) | 169 (58.9%) |
Education in Duque
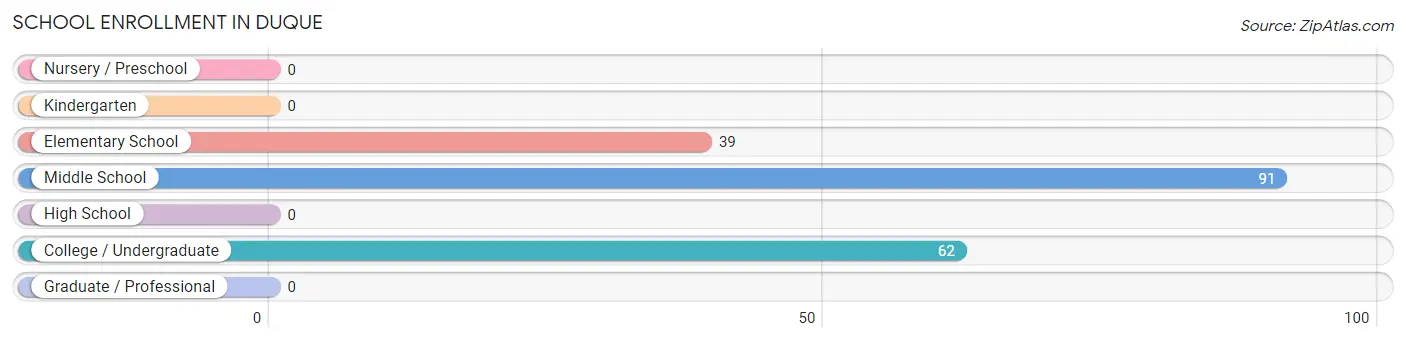
School Enrollment in Duque
The most common levels of schooling among the 192 students in Duque are middle school (91 | 47.4%), college / undergraduate (62 | 32.3%), and elementary school (39 | 20.3%).
| School Level | # Students | % Students |
| Nursery / Preschool | 0 | 0.0% |
| Kindergarten | 0 | 0.0% |
| Elementary School | 39 | 20.3% |
| Middle School | 91 | 47.4% |
| High School | 0 | 0.0% |
| College / Undergraduate | 62 | 32.3% |
| Graduate / Professional | 0 | 0.0% |
| Total | 192 | 100.0% |
School Enrollment by Age by Funding Source in Duque
Out of a total of 192 students who are enrolled in schools in Duque, 62 (32.3%) attend a private institution, while the remaining 130 (67.7%) are enrolled in public schools. The age group of 20 to 24 year olds has the highest likelihood of being enrolled in private schools, with 37 (100.0% in the age bracket) enrolled. Conversely, the age group of 5 to 9 year old has the lowest likelihood of being enrolled in a private school, with 39 (100.0% in the age bracket) attending a public institution.
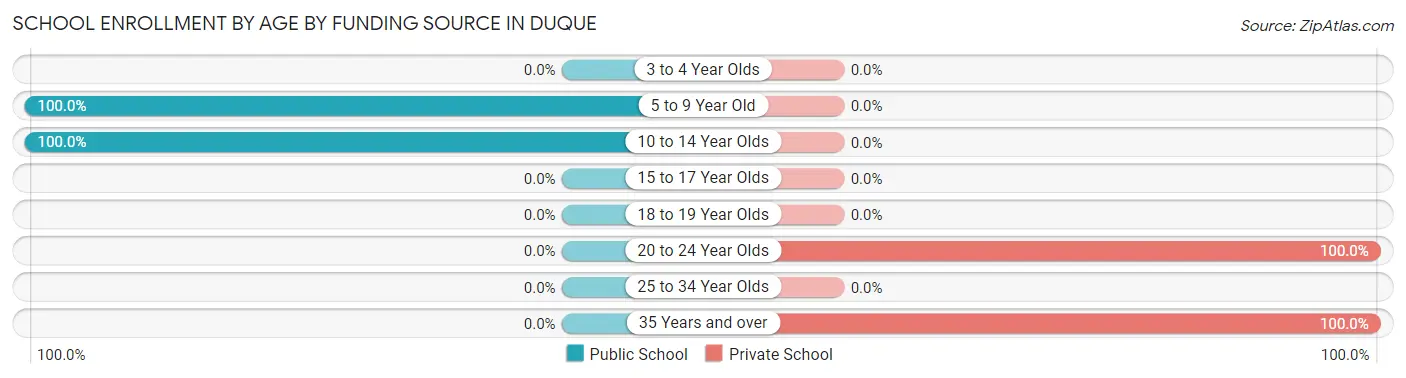
| Age Bracket | Public School | Private School |
| 3 to 4 Year Olds | 0 (0.0%) | 0 (0.0%) |
| 5 to 9 Year Old | 39 (100.0%) | 0 (0.0%) |
| 10 to 14 Year Olds | 91 (100.0%) | 0 (0.0%) |
| 15 to 17 Year Olds | 0 (0.0%) | 0 (0.0%) |
| 18 to 19 Year Olds | 0 (0.0%) | 0 (0.0%) |
| 20 to 24 Year Olds | 0 (0.0%) | 37 (100.0%) |
| 25 to 34 Year Olds | 0 (0.0%) | 0 (0.0%) |
| 35 Years and over | 0 (0.0%) | 25 (100.0%) |
| Total | 130 (67.7%) | 62 (32.3%) |
Educational Attainment by Field of Study in Duque
Education (110 | 57.6%), business (44 | 23.0%), physical & health sciences (36 | 18.9%), and social sciences (1 | 0.5%) are the most common fields of study among 191 individuals in Duque who have obtained a bachelor's degree or higher.
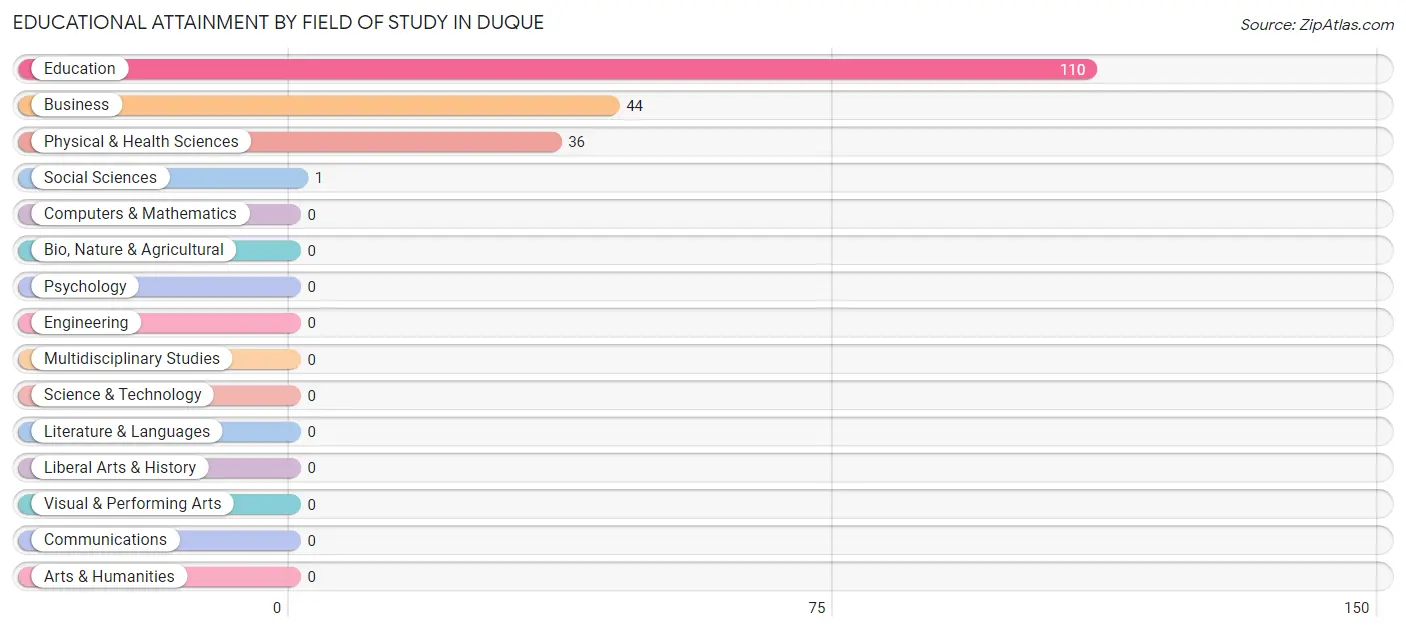
| Field of Study | # Graduates | % Graduates |
| Computers & Mathematics | 0 | 0.0% |
| Bio, Nature & Agricultural | 0 | 0.0% |
| Physical & Health Sciences | 36 | 18.9% |
| Psychology | 0 | 0.0% |
| Social Sciences | 1 | 0.5% |
| Engineering | 0 | 0.0% |
| Multidisciplinary Studies | 0 | 0.0% |
| Science & Technology | 0 | 0.0% |
| Business | 44 | 23.0% |
| Education | 110 | 57.6% |
| Literature & Languages | 0 | 0.0% |
| Liberal Arts & History | 0 | 0.0% |
| Visual & Performing Arts | 0 | 0.0% |
| Communications | 0 | 0.0% |
| Arts & Humanities | 0 | 0.0% |
| Total | 191 | 100.0% |
Transportation & Commute in Duque
Vehicle Availability by Sex in Duque
The most prevalent vehicle ownership categories in Duque are males with 2 vehicles (48, accounting for 40.7%) and females with 2 vehicles (70, making up 28.4%).
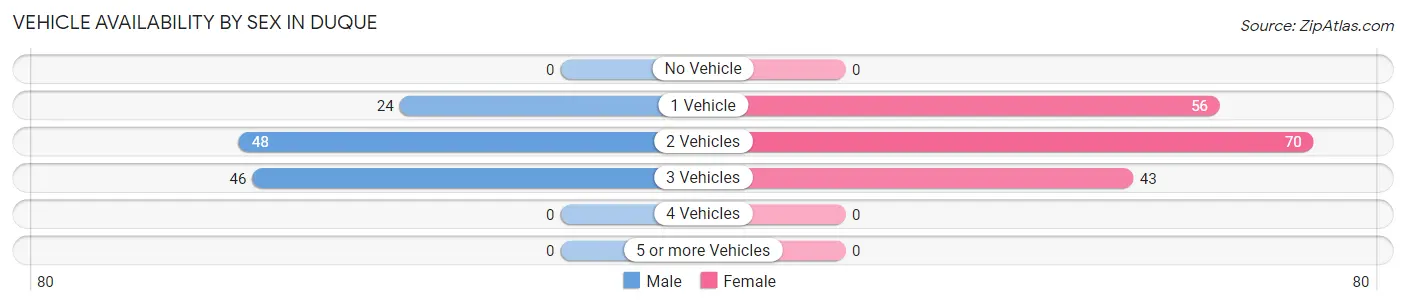
| Vehicles Available | Male | Female |
| No Vehicle | 0 (0.0%) | 0 (0.0%) |
| 1 Vehicle | 24 (20.3%) | 56 (33.1%) |
| 2 Vehicles | 48 (40.7%) | 70 (41.4%) |
| 3 Vehicles | 46 (39.0%) | 43 (25.4%) |
| 4 Vehicles | 0 (0.0%) | 0 (0.0%) |
| 5 or more Vehicles | 0 (0.0%) | 0 (0.0%) |
| Total | 118 (100.0%) | 169 (100.0%) |
Commute Time in Duque
The most frequently occuring commute durations in Duque are 60 to 89 minutes (133 commuters, 46.3%), 30 to 34 minutes (98 commuters, 34.2%), and 20 to 24 minutes (31 commuters, 10.8%).
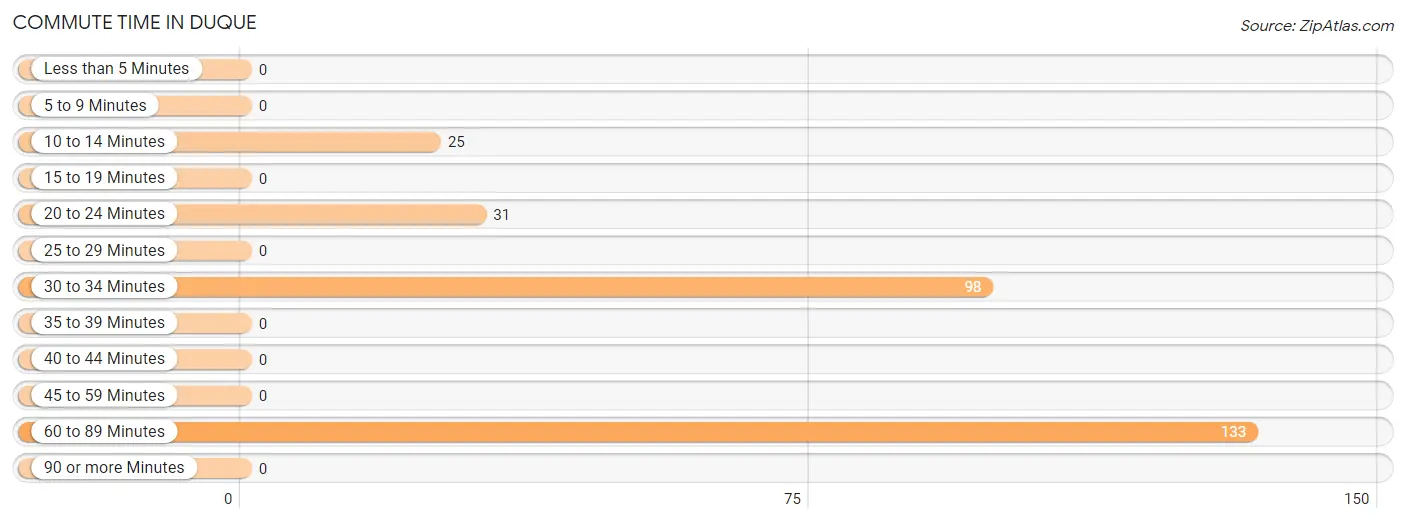
| Commute Time | # Commuters | % Commuters |
| Less than 5 Minutes | 0 | 0.0% |
| 5 to 9 Minutes | 0 | 0.0% |
| 10 to 14 Minutes | 25 | 8.7% |
| 15 to 19 Minutes | 0 | 0.0% |
| 20 to 24 Minutes | 31 | 10.8% |
| 25 to 29 Minutes | 0 | 0.0% |
| 30 to 34 Minutes | 98 | 34.2% |
| 35 to 39 Minutes | 0 | 0.0% |
| 40 to 44 Minutes | 0 | 0.0% |
| 45 to 59 Minutes | 0 | 0.0% |
| 60 to 89 Minutes | 133 | 46.3% |
| 90 or more Minutes | 0 | 0.0% |
Commute Time by Sex in Duque
The most common commute times in Duque are 60 to 89 minutes (73 commuters, 61.9%) for males and 60 to 89 minutes (60 commuters, 35.5%) for females.
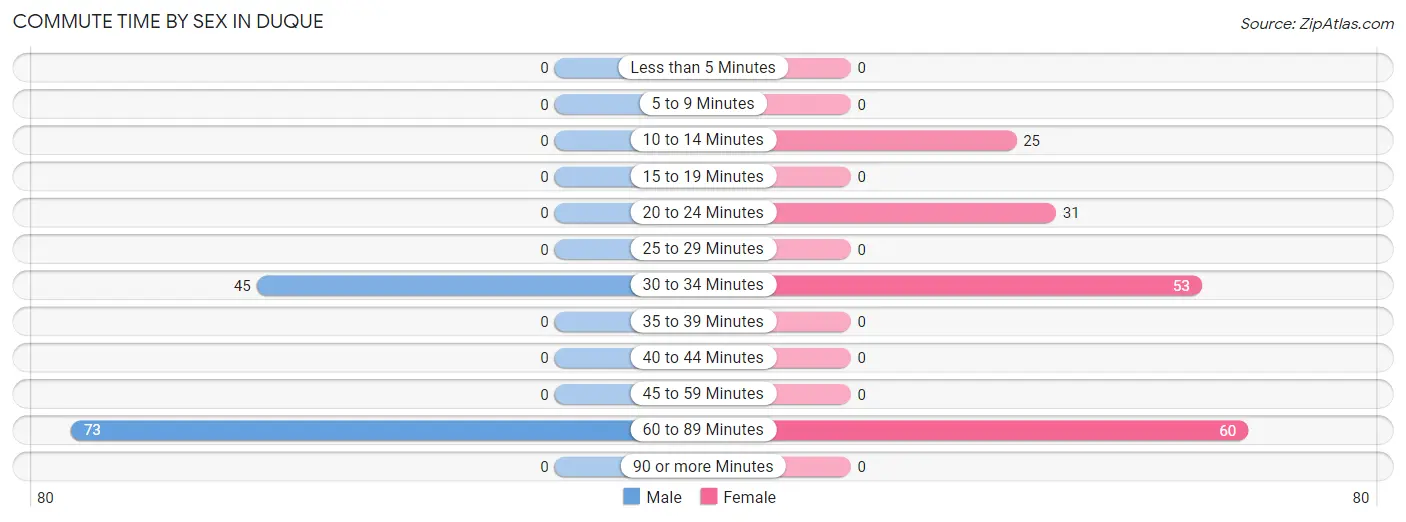
| Commute Time | Male | Female |
| Less than 5 Minutes | 0 (0.0%) | 0 (0.0%) |
| 5 to 9 Minutes | 0 (0.0%) | 0 (0.0%) |
| 10 to 14 Minutes | 0 (0.0%) | 25 (14.8%) |
| 15 to 19 Minutes | 0 (0.0%) | 0 (0.0%) |
| 20 to 24 Minutes | 0 (0.0%) | 31 (18.3%) |
| 25 to 29 Minutes | 0 (0.0%) | 0 (0.0%) |
| 30 to 34 Minutes | 45 (38.1%) | 53 (31.4%) |
| 35 to 39 Minutes | 0 (0.0%) | 0 (0.0%) |
| 40 to 44 Minutes | 0 (0.0%) | 0 (0.0%) |
| 45 to 59 Minutes | 0 (0.0%) | 0 (0.0%) |
| 60 to 89 Minutes | 73 (61.9%) | 60 (35.5%) |
| 90 or more Minutes | 0 (0.0%) | 0 (0.0%) |
Time of Departure to Work by Sex in Duque
The most frequent times of departure to work in Duque are 5:00 AM to 5:29 AM (48, 40.7%) for males and 7:30 AM to 7:59 AM (60, 35.5%) for females.
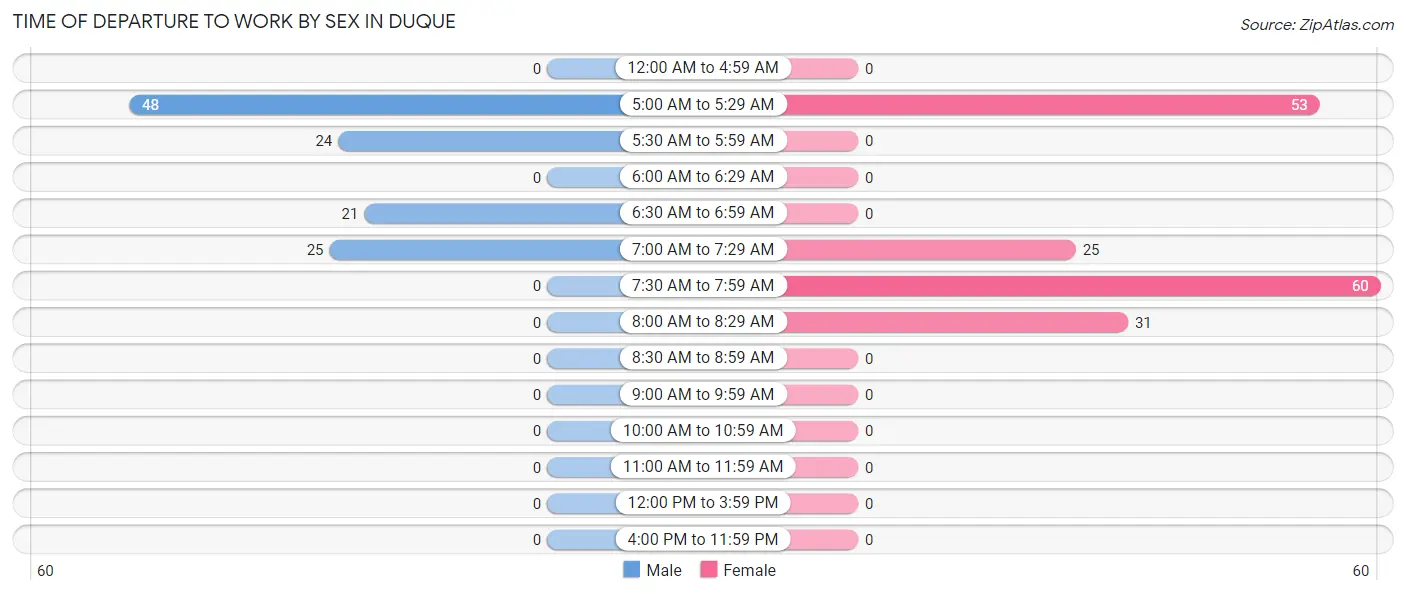
| Time of Departure | Male | Female |
| 12:00 AM to 4:59 AM | 0 (0.0%) | 0 (0.0%) |
| 5:00 AM to 5:29 AM | 48 (40.7%) | 53 (31.4%) |
| 5:30 AM to 5:59 AM | 24 (20.3%) | 0 (0.0%) |
| 6:00 AM to 6:29 AM | 0 (0.0%) | 0 (0.0%) |
| 6:30 AM to 6:59 AM | 21 (17.8%) | 0 (0.0%) |
| 7:00 AM to 7:29 AM | 25 (21.2%) | 25 (14.8%) |
| 7:30 AM to 7:59 AM | 0 (0.0%) | 60 (35.5%) |
| 8:00 AM to 8:29 AM | 0 (0.0%) | 31 (18.3%) |
| 8:30 AM to 8:59 AM | 0 (0.0%) | 0 (0.0%) |
| 9:00 AM to 9:59 AM | 0 (0.0%) | 0 (0.0%) |
| 10:00 AM to 10:59 AM | 0 (0.0%) | 0 (0.0%) |
| 11:00 AM to 11:59 AM | 0 (0.0%) | 0 (0.0%) |
| 12:00 PM to 3:59 PM | 0 (0.0%) | 0 (0.0%) |
| 4:00 PM to 11:59 PM | 0 (0.0%) | 0 (0.0%) |
| Total | 118 (100.0%) | 169 (100.0%) |
Housing Occupancy in Duque
Occupancy by Ownership in Duque
Of the total 551 dwellings in Duque, owner-occupied units account for 413 (75.0%), while renter-occupied units make up 138 (25.1%).
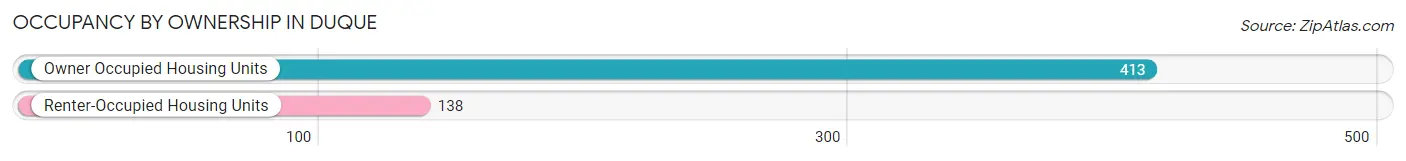
| Occupancy | # Housing Units | % Housing Units |
| Owner Occupied Housing Units | 413 | 75.0% |
| Renter-Occupied Housing Units | 138 | 25.1% |
| Total Occupied Housing Units | 551 | 100.0% |
Occupancy by Household Size in Duque
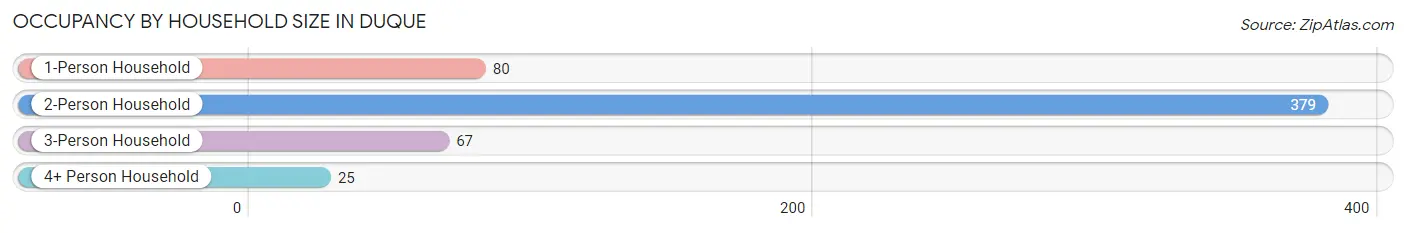
| Household Size | # Housing Units | % Housing Units |
| 1-Person Household | 80 | 14.5% |
| 2-Person Household | 379 | 68.8% |
| 3-Person Household | 67 | 12.2% |
| 4+ Person Household | 25 | 4.5% |
| Total Housing Units | 551 | 100.0% |
Occupancy by Ownership by Household Size in Duque
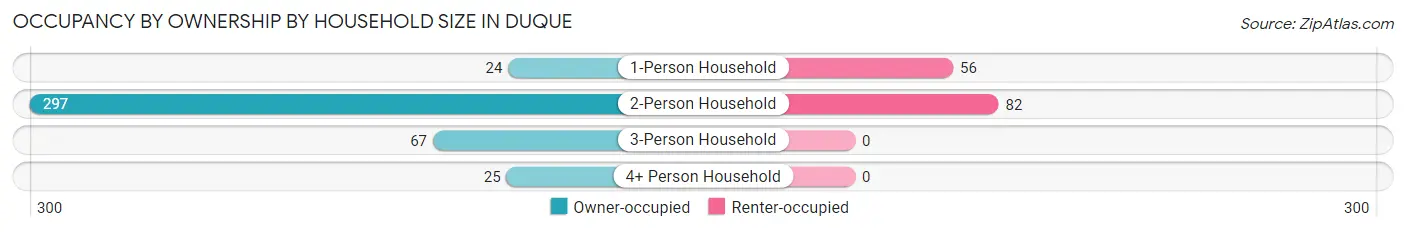
| Household Size | Owner-occupied | Renter-occupied |
| 1-Person Household | 24 (30.0%) | 56 (70.0%) |
| 2-Person Household | 297 (78.4%) | 82 (21.6%) |
| 3-Person Household | 67 (100.0%) | 0 (0.0%) |
| 4+ Person Household | 25 (100.0%) | 0 (0.0%) |
| Total Housing Units | 413 (75.0%) | 138 (25.1%) |
Occupancy by Educational Attainment in Duque
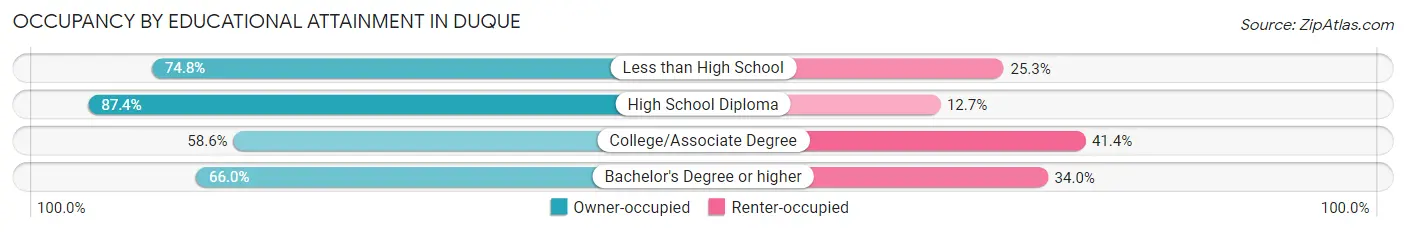
| Household Size | Owner-occupied | Renter-occupied |
| Less than High School | 74 (74.8%) | 25 (25.3%) |
| High School Diploma | 214 (87.4%) | 31 (12.7%) |
| College/Associate Degree | 92 (58.6%) | 65 (41.4%) |
| Bachelor's Degree or higher | 33 (66.0%) | 17 (34.0%) |
Occupancy by Age of Householder in Duque
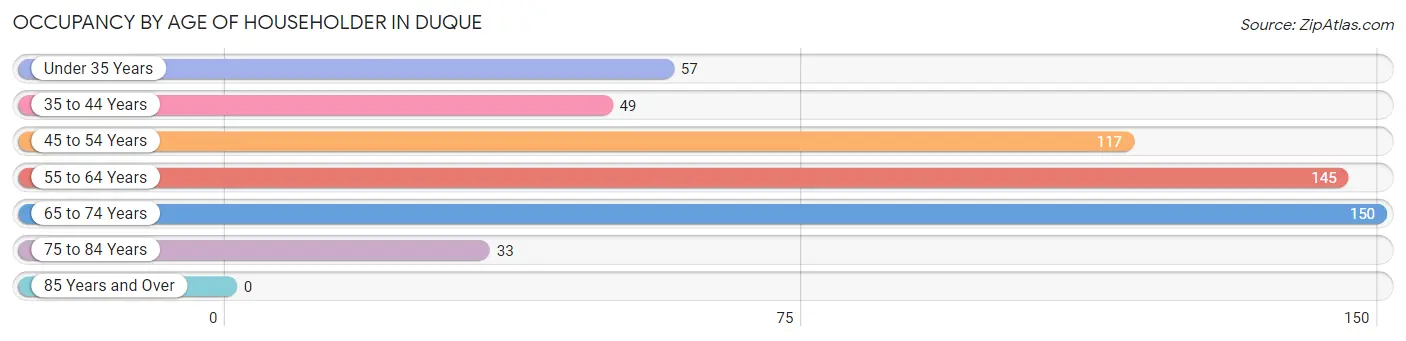
| Age Bracket | # Households | % Households |
| Under 35 Years | 57 | 10.3% |
| 35 to 44 Years | 49 | 8.9% |
| 45 to 54 Years | 117 | 21.2% |
| 55 to 64 Years | 145 | 26.3% |
| 65 to 74 Years | 150 | 27.2% |
| 75 to 84 Years | 33 | 6.0% |
| 85 Years and Over | 0 | 0.0% |
| Total | 551 | 100.0% |
Housing Finances in Duque
Median Income by Occupancy in Duque
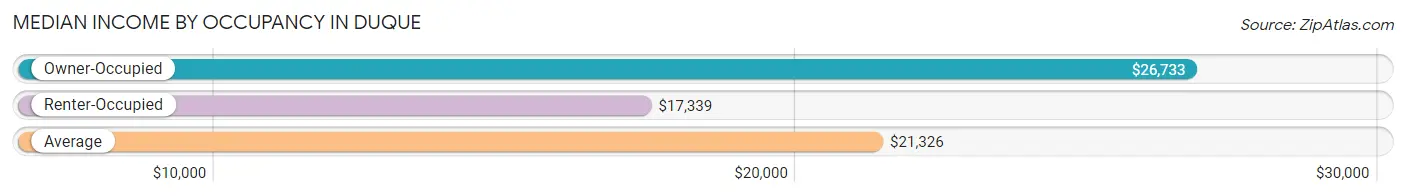
| Occupancy Type | # Households | Median Income |
| Owner-Occupied | 413 (75.0%) | $26,733 |
| Renter-Occupied | 138 (25.1%) | $17,339 |
| Average | 551 (100.0%) | $21,326 |
Occupancy by Householder Income Bracket in Duque
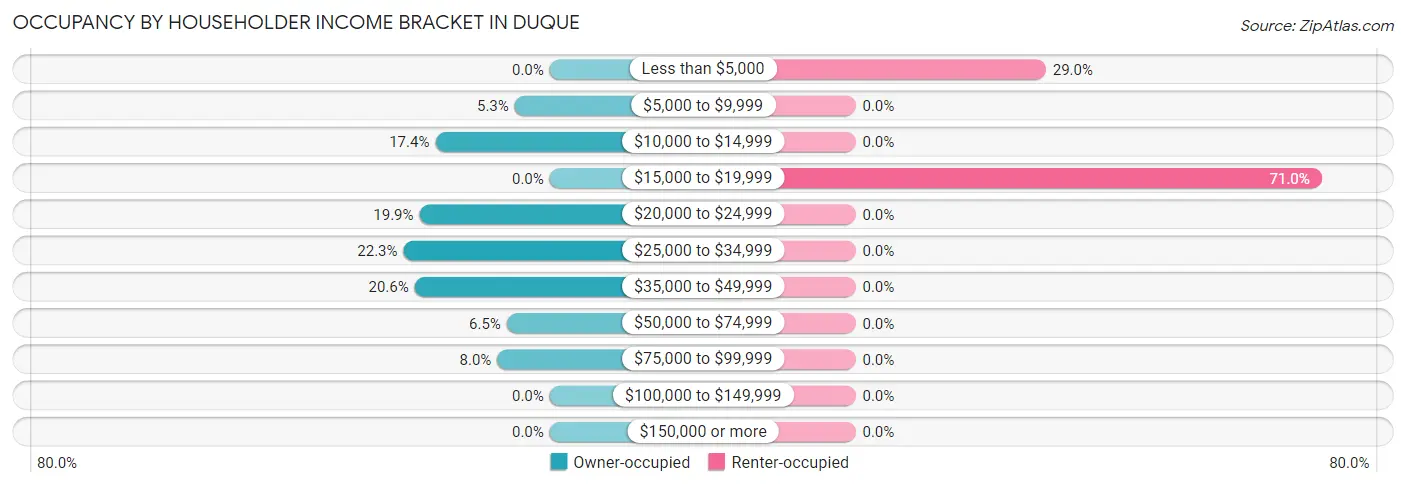
| Income Bracket | Owner-occupied | Renter-occupied |
| Less than $5,000 | 0 (0.0%) | 40 (29.0%) |
| $5,000 to $9,999 | 22 (5.3%) | 0 (0.0%) |
| $10,000 to $14,999 | 72 (17.4%) | 0 (0.0%) |
| $15,000 to $19,999 | 0 (0.0%) | 98 (71.0%) |
| $20,000 to $24,999 | 82 (19.9%) | 0 (0.0%) |
| $25,000 to $34,999 | 92 (22.3%) | 0 (0.0%) |
| $35,000 to $49,999 | 85 (20.6%) | 0 (0.0%) |
| $50,000 to $74,999 | 27 (6.5%) | 0 (0.0%) |
| $75,000 to $99,999 | 33 (8.0%) | 0 (0.0%) |
| $100,000 to $149,999 | 0 (0.0%) | 0 (0.0%) |
| $150,000 or more | 0 (0.0%) | 0 (0.0%) |
| Total | 413 (100.0%) | 138 (100.0%) |
Monthly Housing Cost Tiers in Duque
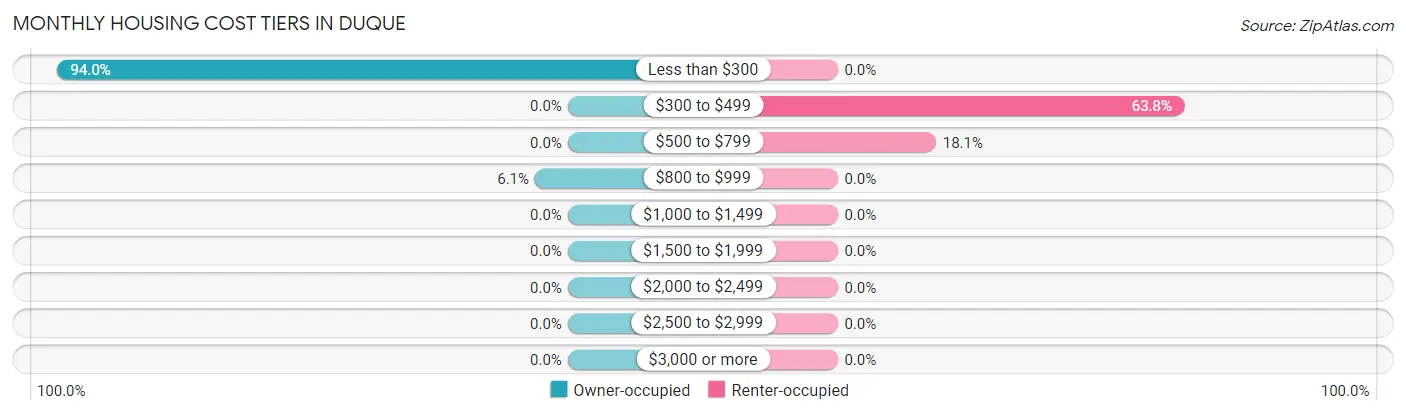
| Monthly Cost | Owner-occupied | Renter-occupied |
| Less than $300 | 388 (94.0%) | 0 (0.0%) |
| $300 to $499 | 0 (0.0%) | 88 (63.8%) |
| $500 to $799 | 0 (0.0%) | 25 (18.1%) |
| $800 to $999 | 25 (6.0%) | 0 (0.0%) |
| $1,000 to $1,499 | 0 (0.0%) | 0 (0.0%) |
| $1,500 to $1,999 | 0 (0.0%) | 0 (0.0%) |
| $2,000 to $2,499 | 0 (0.0%) | 0 (0.0%) |
| $2,500 to $2,999 | 0 (0.0%) | 0 (0.0%) |
| $3,000 or more | 0 (0.0%) | 0 (0.0%) |
| Total | 413 (100.0%) | 138 (100.0%) |
Physical Housing Characteristics in Duque
Housing Structures in Duque
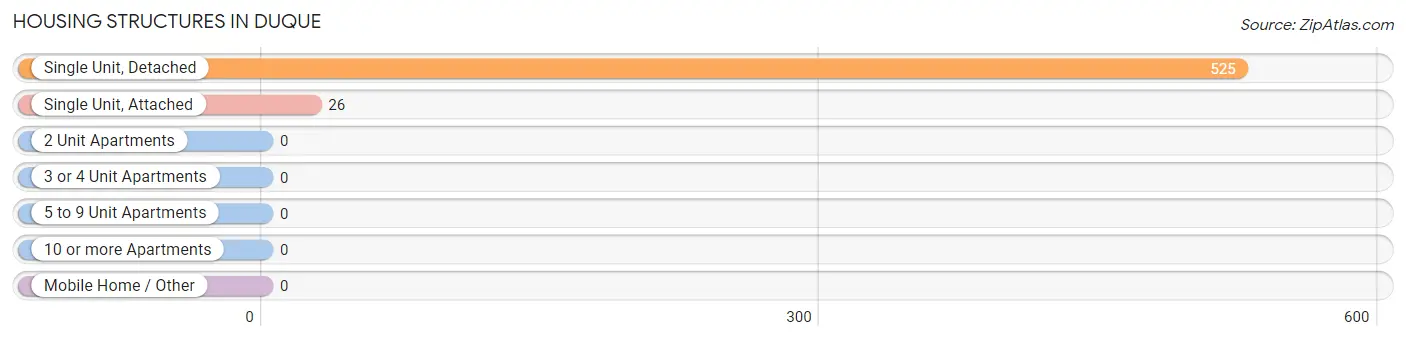
| Structure Type | # Housing Units | % Housing Units |
| Single Unit, Detached | 525 | 95.3% |
| Single Unit, Attached | 26 | 4.7% |
| 2 Unit Apartments | 0 | 0.0% |
| 3 or 4 Unit Apartments | 0 | 0.0% |
| 5 to 9 Unit Apartments | 0 | 0.0% |
| 10 or more Apartments | 0 | 0.0% |
| Mobile Home / Other | 0 | 0.0% |
| Total | 551 | 100.0% |
Housing Structures by Occupancy in Duque
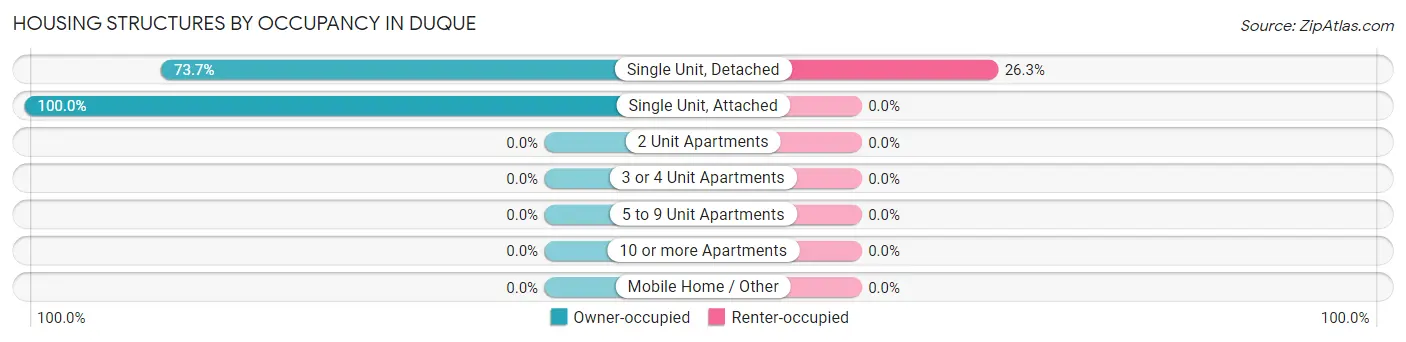
| Structure Type | Owner-occupied | Renter-occupied |
| Single Unit, Detached | 387 (73.7%) | 138 (26.3%) |
| Single Unit, Attached | 26 (100.0%) | 0 (0.0%) |
| 2 Unit Apartments | 0 (0.0%) | 0 (0.0%) |
| 3 or 4 Unit Apartments | 0 (0.0%) | 0 (0.0%) |
| 5 to 9 Unit Apartments | 0 (0.0%) | 0 (0.0%) |
| 10 or more Apartments | 0 (0.0%) | 0 (0.0%) |
| Mobile Home / Other | 0 (0.0%) | 0 (0.0%) |
| Total | 413 (75.0%) | 138 (25.1%) |
Housing Structures by Number of Rooms in Duque
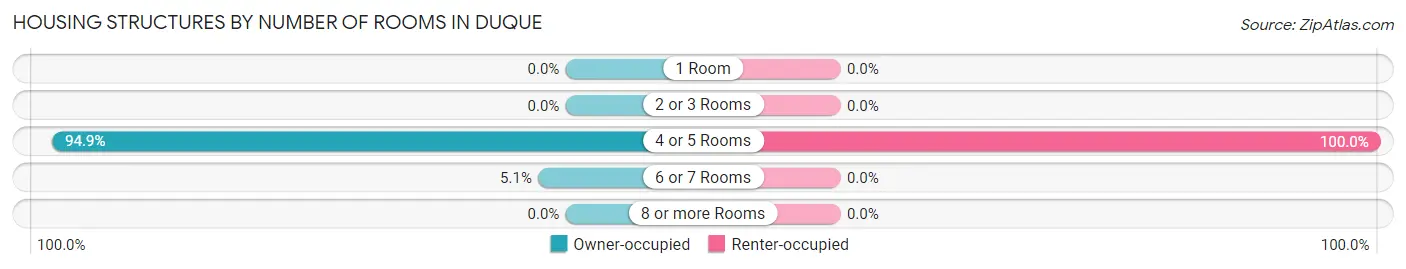
| Number of Rooms | Owner-occupied | Renter-occupied |
| 1 Room | 0 (0.0%) | 0 (0.0%) |
| 2 or 3 Rooms | 0 (0.0%) | 0 (0.0%) |
| 4 or 5 Rooms | 392 (94.9%) | 138 (100.0%) |
| 6 or 7 Rooms | 21 (5.1%) | 0 (0.0%) |
| 8 or more Rooms | 0 (0.0%) | 0 (0.0%) |
| Total | 413 (100.0%) | 138 (100.0%) |
Housing Structure by Heating Type in Duque
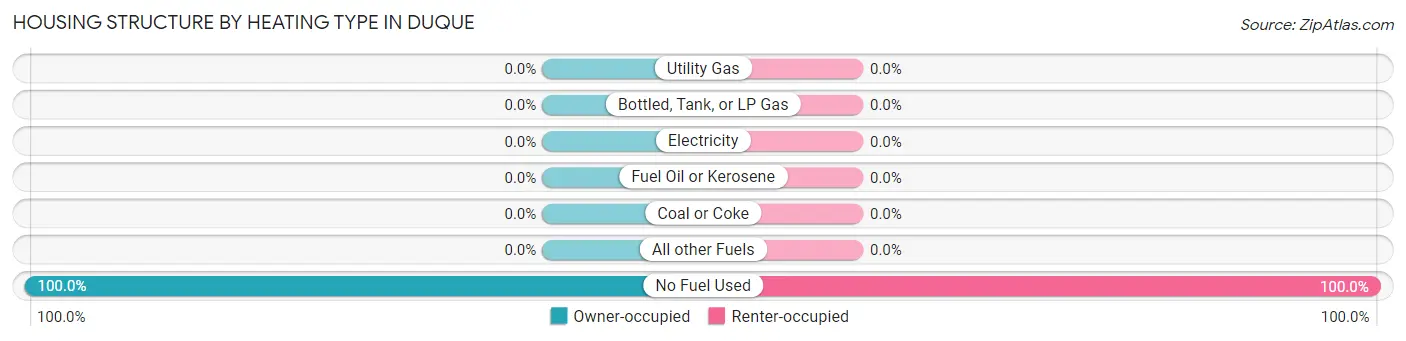
| Heating Type | Owner-occupied | Renter-occupied |
| Utility Gas | 0 (0.0%) | 0 (0.0%) |
| Bottled, Tank, or LP Gas | 0 (0.0%) | 0 (0.0%) |
| Electricity | 0 (0.0%) | 0 (0.0%) |
| Fuel Oil or Kerosene | 0 (0.0%) | 0 (0.0%) |
| Coal or Coke | 0 (0.0%) | 0 (0.0%) |
| All other Fuels | 0 (0.0%) | 0 (0.0%) |
| No Fuel Used | 413 (100.0%) | 138 (100.0%) |
| Total | 413 (100.0%) | 138 (100.0%) |
Household Vehicle Usage in Duque
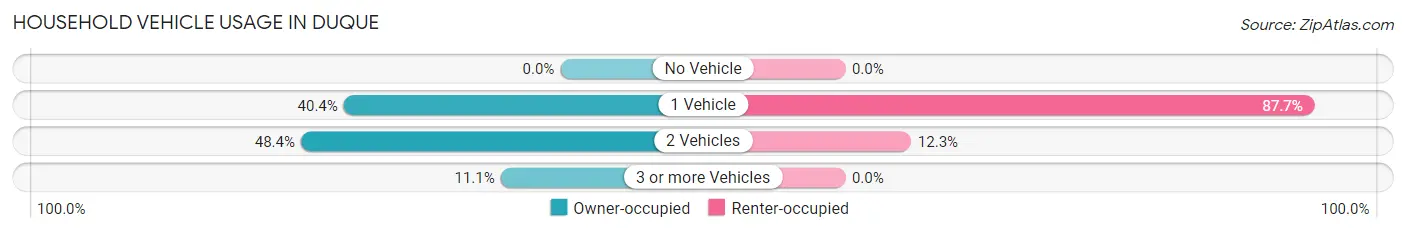
| Vehicles per Household | Owner-occupied | Renter-occupied |
| No Vehicle | 0 (0.0%) | 0 (0.0%) |
| 1 Vehicle | 167 (40.4%) | 121 (87.7%) |
| 2 Vehicles | 200 (48.4%) | 17 (12.3%) |
| 3 or more Vehicles | 46 (11.1%) | 0 (0.0%) |
| Total | 413 (100.0%) | 138 (100.0%) |
Real Estate & Mortgages in Duque
Real Estate and Mortgage Overview in Duque
| Characteristic | Without Mortgage | With Mortgage |
| Housing Units | 388 | 25 |
| Median Property Value | $67,600 | $0 |
| Median Household Income | $26,023 | $0 |
| Monthly Housing Costs | $142 | $0 |
| Real Estate Taxes | - | - |
Property Value by Mortgage Status in Duque
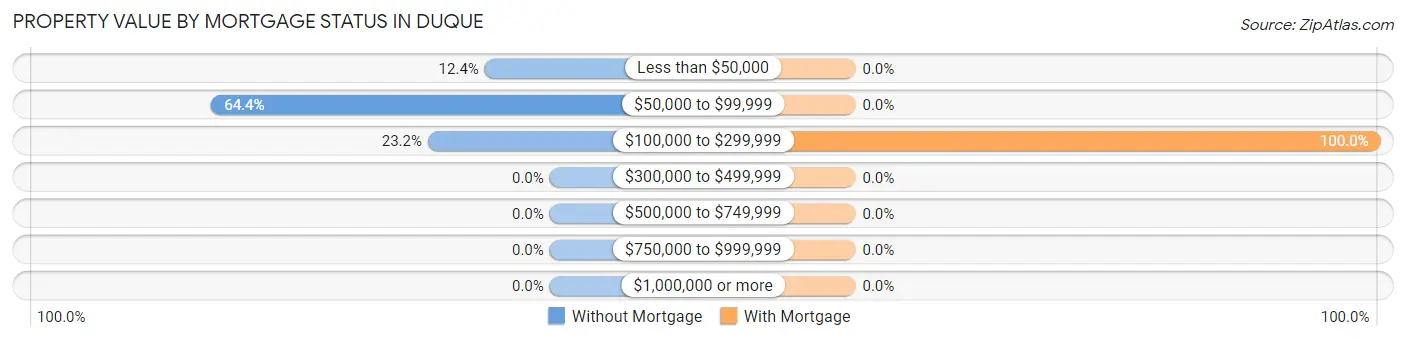
| Property Value | Without Mortgage | With Mortgage |
| Less than $50,000 | 48 (12.4%) | 0 (0.0%) |
| $50,000 to $99,999 | 250 (64.4%) | 0 (0.0%) |
| $100,000 to $299,999 | 90 (23.2%) | 25 (100.0%) |
| $300,000 to $499,999 | 0 (0.0%) | 0 (0.0%) |
| $500,000 to $749,999 | 0 (0.0%) | 0 (0.0%) |
| $750,000 to $999,999 | 0 (0.0%) | 0 (0.0%) |
| $1,000,000 or more | 0 (0.0%) | 0 (0.0%) |
| Total | 388 (100.0%) | 25 (100.0%) |
Household Income by Mortgage Status in Duque
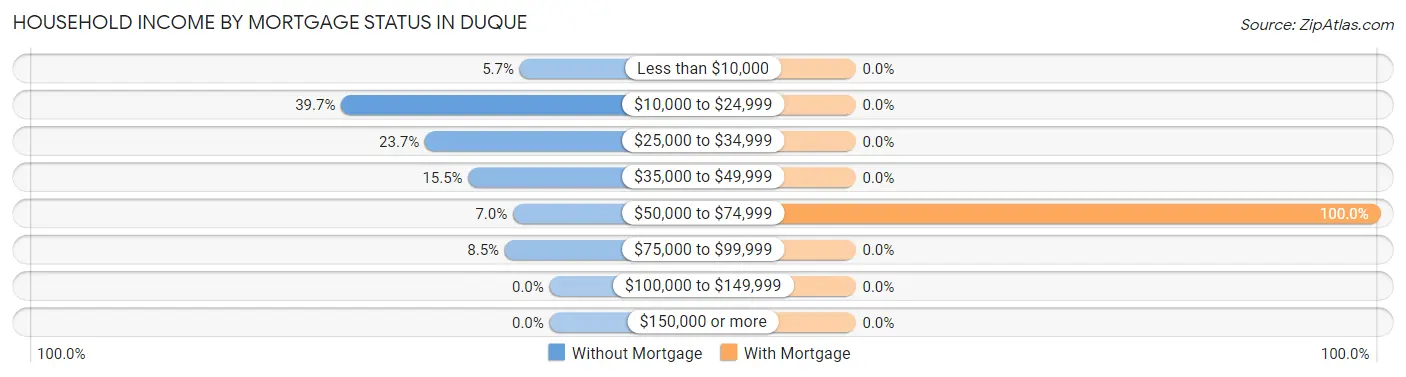
| Household Income | Without Mortgage | With Mortgage |
| Less than $10,000 | 22 (5.7%) | 0 (0.0%) |
| $10,000 to $24,999 | 154 (39.7%) | 0 (0.0%) |
| $25,000 to $34,999 | 92 (23.7%) | 0 (0.0%) |
| $35,000 to $49,999 | 60 (15.5%) | 0 (0.0%) |
| $50,000 to $74,999 | 27 (7.0%) | 25 (100.0%) |
| $75,000 to $99,999 | 33 (8.5%) | 0 (0.0%) |
| $100,000 to $149,999 | 0 (0.0%) | 0 (0.0%) |
| $150,000 or more | 0 (0.0%) | 0 (0.0%) |
| Total | 388 (100.0%) | 25 (100.0%) |
Property Value to Household Income Ratio in Duque
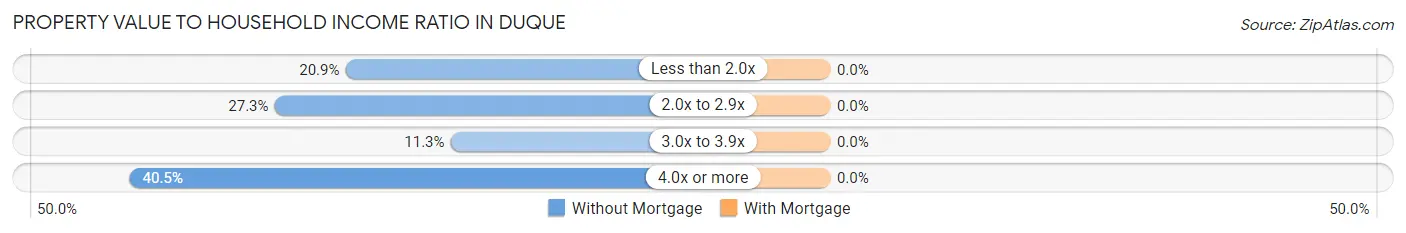
| Value-to-Income Ratio | Without Mortgage | With Mortgage |
| Less than 2.0x | 81 (20.9%) | 0 (0.0%) |
| 2.0x to 2.9x | 106 (27.3%) | 0 (0.0%) |
| 3.0x to 3.9x | 44 (11.3%) | 0 (0.0%) |
| 4.0x or more | 157 (40.5%) | 0 (0.0%) |
| Total | 388 (100.0%) | 25 (100.0%) |
Real Estate Taxes by Mortgage Status in Duque

| Property Taxes | Without Mortgage | With Mortgage |
| Less than $800 | 33 (8.5%) | 0 (0.0%) |
| $800 to $1,499 | 0 (0.0%) | 0 (0.0%) |
| $800 to $1,499 | 0 (0.0%) | 0 (0.0%) |
| Total | 388 (100.0%) | 25 (100.0%) |
Health & Disability in Duque
Health Insurance Coverage by Age in Duque
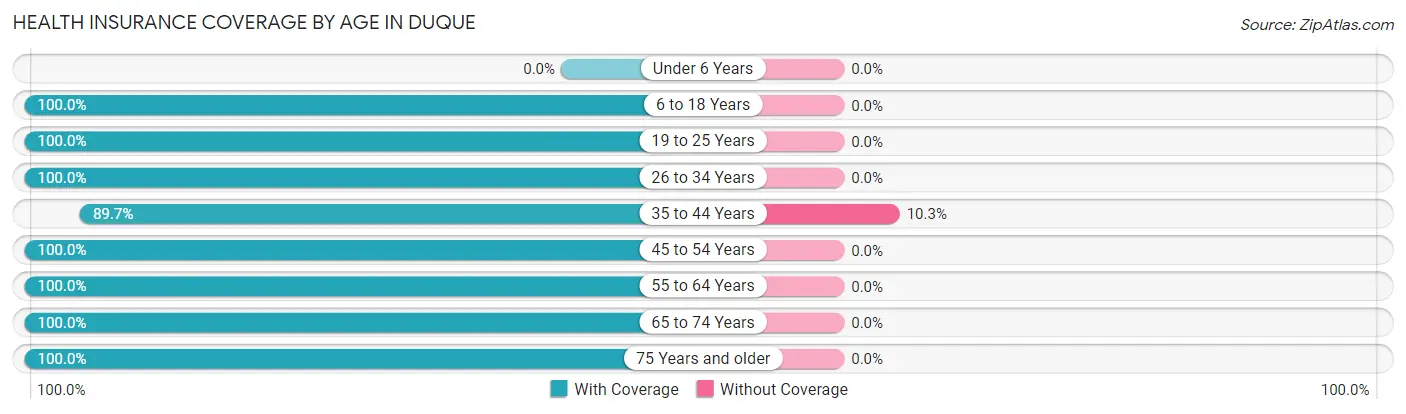
| Age Bracket | With Coverage | Without Coverage |
| Under 6 Years | 0 (0.0%) | 0 (0.0%) |
| 6 to 18 Years | 130 (100.0%) | 0 (0.0%) |
| 19 to 25 Years | 71 (100.0%) | 0 (0.0%) |
| 26 to 34 Years | 40 (100.0%) | 0 (0.0%) |
| 35 to 44 Years | 208 (89.7%) | 24 (10.3%) |
| 45 to 54 Years | 249 (100.0%) | 0 (0.0%) |
| 55 to 64 Years | 237 (100.0%) | 0 (0.0%) |
| 65 to 74 Years | 227 (100.0%) | 0 (0.0%) |
| 75 Years and older | 110 (100.0%) | 0 (0.0%) |
| Total | 1,272 (98.2%) | 24 (1.8%) |
Health Insurance Coverage by Citizenship Status in Duque

| Citizenship Status | With Coverage | Without Coverage |
| Native Born | 0 (0.0%) | 0 (0.0%) |
| Foreign Born, Citizen | 130 (100.0%) | 0 (0.0%) |
| Foreign Born, not a Citizen | 71 (100.0%) | 0 (0.0%) |
Health Insurance Coverage by Household Income in Duque
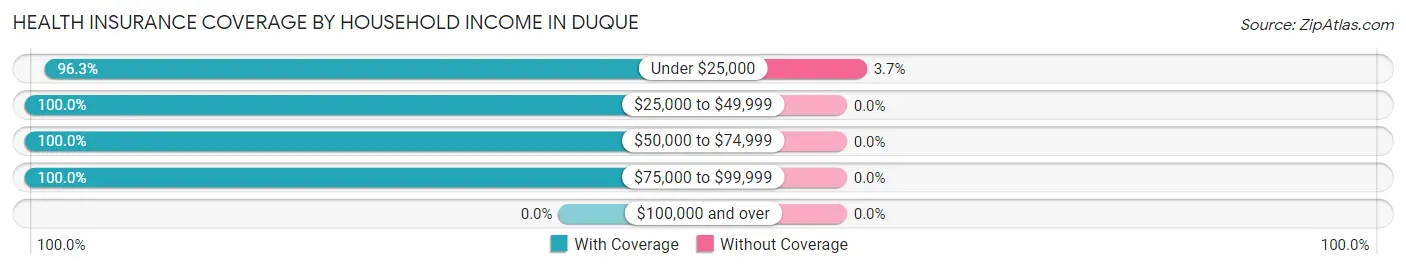
| Household Income | With Coverage | Without Coverage |
| Under $25,000 | 620 (96.3%) | 24 (3.7%) |
| $25,000 to $49,999 | 491 (100.0%) | 0 (0.0%) |
| $50,000 to $74,999 | 97 (100.0%) | 0 (0.0%) |
| $75,000 to $99,999 | 56 (100.0%) | 0 (0.0%) |
| $100,000 and over | 0 (0.0%) | 0 (0.0%) |
Public vs Private Health Insurance Coverage by Age in Duque
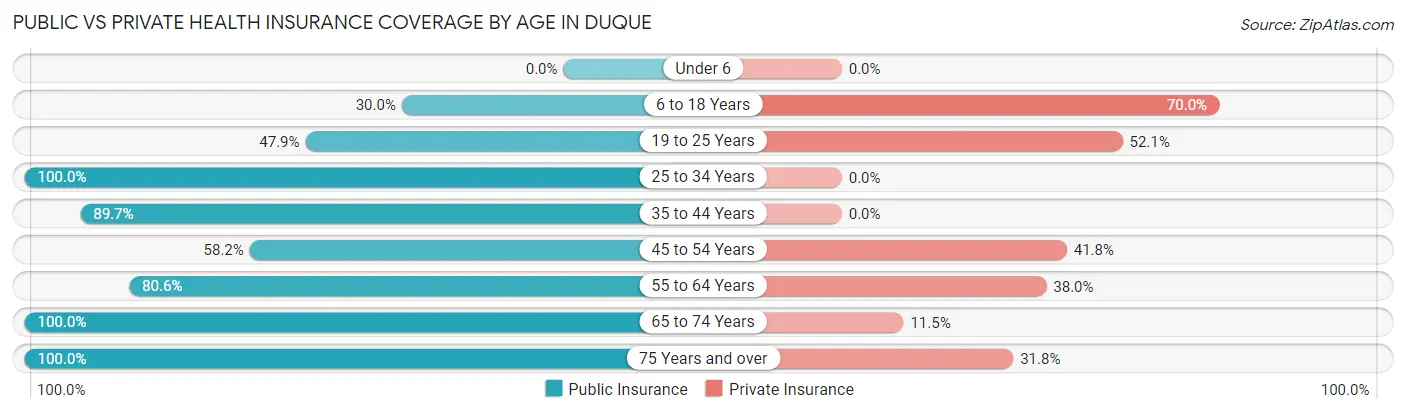
| Age Bracket | Public Insurance | Private Insurance |
| Under 6 | 0 (0.0%) | 0 (0.0%) |
| 6 to 18 Years | 39 (30.0%) | 91 (70.0%) |
| 19 to 25 Years | 34 (47.9%) | 37 (52.1%) |
| 25 to 34 Years | 40 (100.0%) | 0 (0.0%) |
| 35 to 44 Years | 208 (89.7%) | 0 (0.0%) |
| 45 to 54 Years | 145 (58.2%) | 104 (41.8%) |
| 55 to 64 Years | 191 (80.6%) | 90 (38.0%) |
| 65 to 74 Years | 227 (100.0%) | 26 (11.5%) |
| 75 Years and over | 110 (100.0%) | 35 (31.8%) |
| Total | 994 (76.7%) | 383 (29.5%) |
Disability Status by Sex by Age in Duque
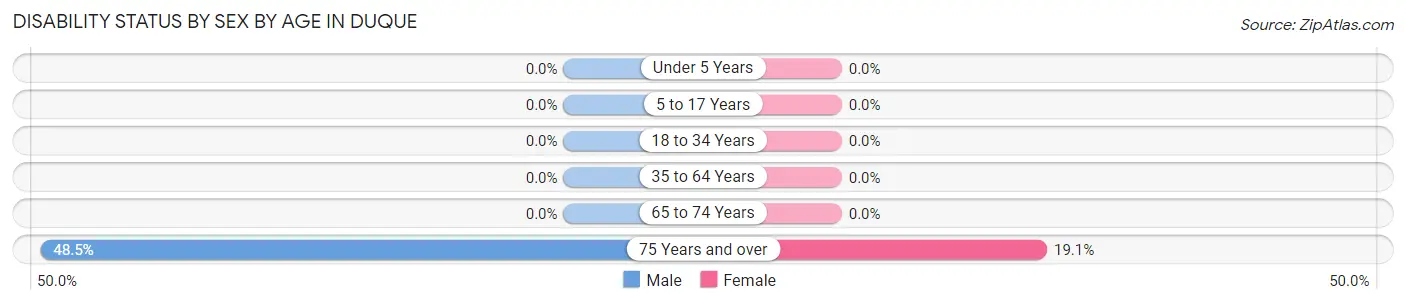
| Age Bracket | Male | Female |
| Under 5 Years | 0 (0.0%) | 0 (0.0%) |
| 5 to 17 Years | 0 (0.0%) | 0 (0.0%) |
| 18 to 34 Years | 0 (0.0%) | 0 (0.0%) |
| 35 to 64 Years | 0 (0.0%) | 0 (0.0%) |
| 65 to 74 Years | 0 (0.0%) | 0 (0.0%) |
| 75 Years and over | 33 (48.5%) | 8 (19.1%) |
Disability Class by Sex by Age in Duque
Disability Class: Hearing Difficulty
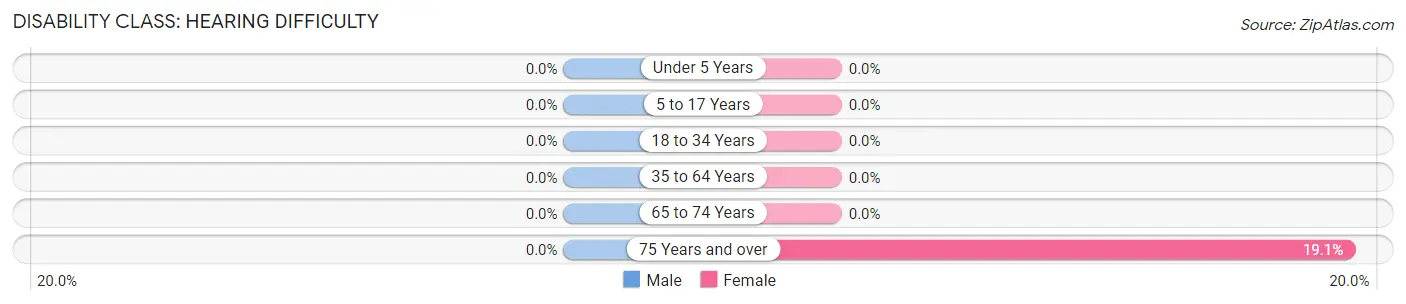
| Age Bracket | Male | Female |
| Under 5 Years | 0 (0.0%) | 0 (0.0%) |
| 5 to 17 Years | 0 (0.0%) | 0 (0.0%) |
| 18 to 34 Years | 0 (0.0%) | 0 (0.0%) |
| 35 to 64 Years | 0 (0.0%) | 0 (0.0%) |
| 65 to 74 Years | 0 (0.0%) | 0 (0.0%) |
| 75 Years and over | 0 (0.0%) | 8 (19.1%) |
Disability Class: Vision Difficulty
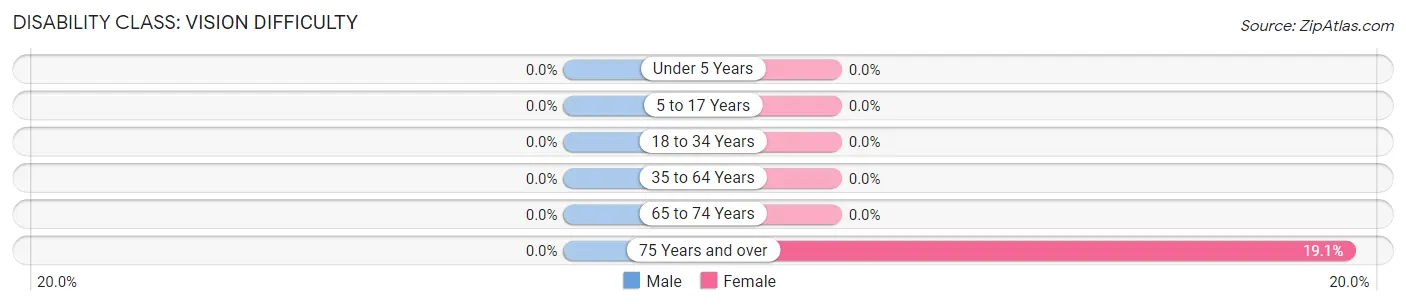
| Age Bracket | Male | Female |
| Under 5 Years | 0 (0.0%) | 0 (0.0%) |
| 5 to 17 Years | 0 (0.0%) | 0 (0.0%) |
| 18 to 34 Years | 0 (0.0%) | 0 (0.0%) |
| 35 to 64 Years | 0 (0.0%) | 0 (0.0%) |
| 65 to 74 Years | 0 (0.0%) | 0 (0.0%) |
| 75 Years and over | 0 (0.0%) | 8 (19.1%) |
Disability Class: Cognitive Difficulty
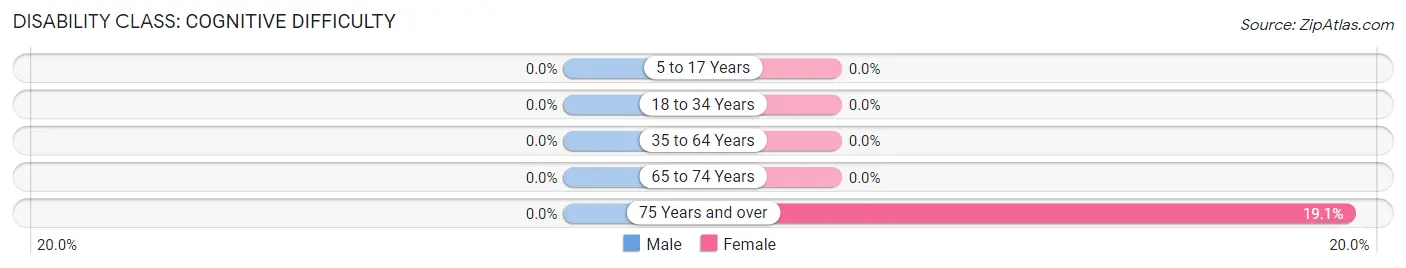
| Age Bracket | Male | Female |
| 5 to 17 Years | 0 (0.0%) | 0 (0.0%) |
| 18 to 34 Years | 0 (0.0%) | 0 (0.0%) |
| 35 to 64 Years | 0 (0.0%) | 0 (0.0%) |
| 65 to 74 Years | 0 (0.0%) | 0 (0.0%) |
| 75 Years and over | 0 (0.0%) | 8 (19.1%) |
Disability Class: Ambulatory Difficulty
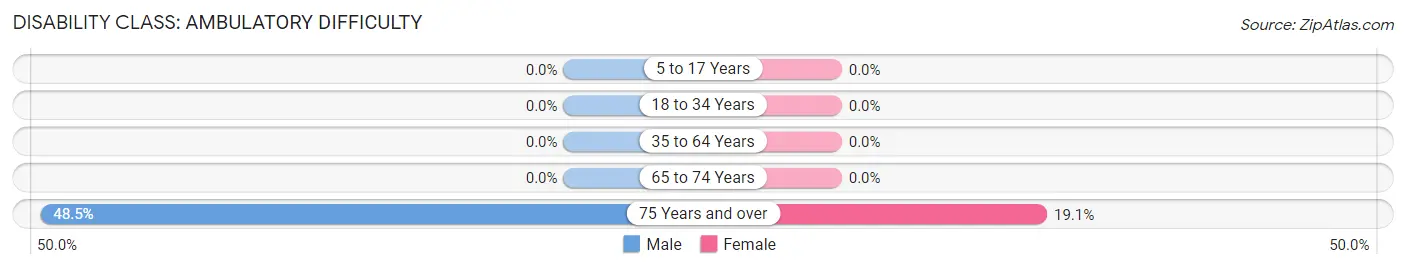
| Age Bracket | Male | Female |
| 5 to 17 Years | 0 (0.0%) | 0 (0.0%) |
| 18 to 34 Years | 0 (0.0%) | 0 (0.0%) |
| 35 to 64 Years | 0 (0.0%) | 0 (0.0%) |
| 65 to 74 Years | 0 (0.0%) | 0 (0.0%) |
| 75 Years and over | 33 (48.5%) | 8 (19.1%) |
Disability Class: Self-Care Difficulty

| Age Bracket | Male | Female |
| 5 to 17 Years | 0 (0.0%) | 0 (0.0%) |
| 18 to 34 Years | 0 (0.0%) | 0 (0.0%) |
| 35 to 64 Years | 0 (0.0%) | 0 (0.0%) |
| 65 to 74 Years | 0 (0.0%) | 0 (0.0%) |
| 75 Years and over | 0 (0.0%) | 8 (19.1%) |
Technology Access in Duque
Computing Device Access in Duque
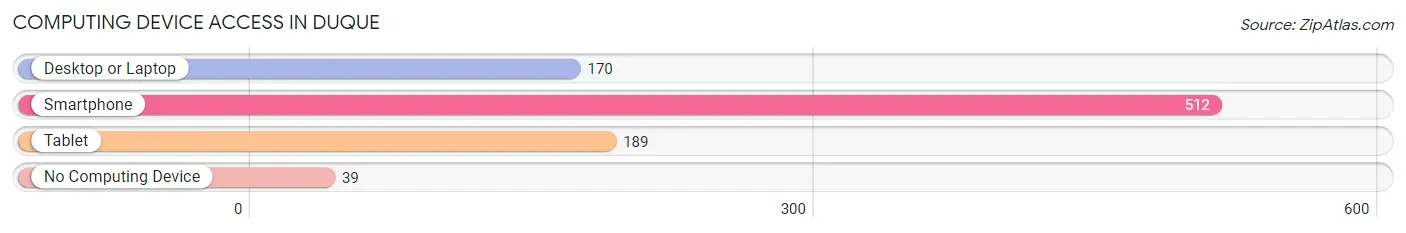
| Device Type | # Households | % Households |
| Desktop or Laptop | 170 | 30.8% |
| Smartphone | 512 | 92.9% |
| Tablet | 189 | 34.3% |
| No Computing Device | 39 | 7.1% |
| Total | 551 | 100.0% |
Internet Access in Duque
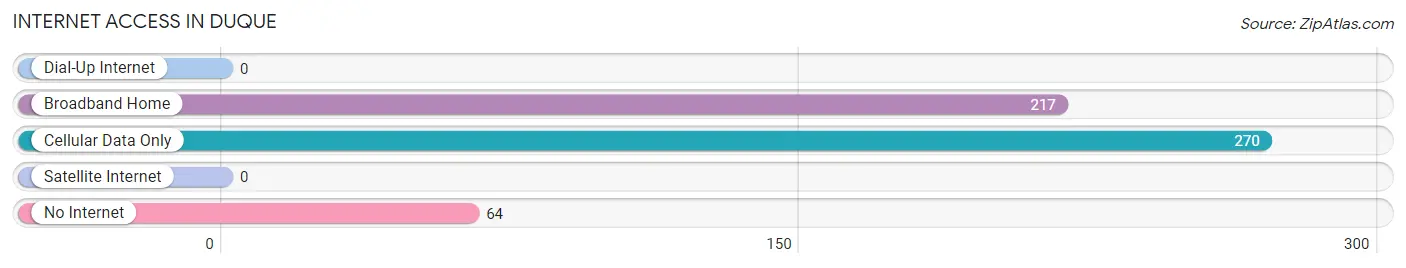
| Internet Type | # Households | % Households |
| Dial-Up Internet | 0 | 0.0% |
| Broadband Home | 217 | 39.4% |
| Cellular Data Only | 270 | 49.0% |
| Satellite Internet | 0 | 0.0% |
| No Internet | 64 | 11.6% |
| Total | 551 | 100.0% |
Duque Summary
Duque is a municipality located in the department of Cesar, Colombia. It is located in the northern part of the department, in the foothills of the Sierra Nevada de Santa Marta mountain range. It is bordered by the municipalities of El Paso, La Paz, San Diego, and Valledupar. The municipality has an area of 845.2 km2 and a population of approximately 28,000 people.
History
Duque was founded in 1790 by the Spanish colonizers. It was originally called San José de Duque, in honor of the Spanish governor of the province of Santa Marta, José de Duque. The town was established as a way to control the indigenous population of the region and to facilitate the exploitation of the region's natural resources.
In the 19th century, Duque became an important center of commerce and industry. The town was home to several factories, including a sugar mill, a tobacco factory, and a textile mill. The town also had a thriving agricultural sector, producing coffee, sugar cane, and other crops.
In the 20th century, Duque experienced a period of economic decline. The factories closed and the agricultural sector declined due to the introduction of new technologies and the competition from other regions. In the late 20th century, the town experienced a period of economic revival, with the opening of new businesses and the development of tourism.
Geography
Duque is located in the foothills of the Sierra Nevada de Santa Marta mountain range. The municipality has an area of 845.2 km2 and is bordered by the municipalities of El Paso, La Paz, San Diego, and Valledupar. The terrain is mostly mountainous, with some flat areas in the lower elevations. The climate is tropical, with temperatures ranging from 18°C to 28°C.
Economy
Duque's economy is largely based on agriculture and tourism. The agricultural sector produces coffee, sugar cane, and other crops. The town is also home to several small businesses, including restaurants, hotels, and shops.
Tourism is an important part of the local economy. The town is home to several attractions, including the colonial-era church of San José de Duque, the archaeological site of El Tablón, and the nearby Sierra Nevada de Santa Marta mountain range.
Demographics
As of 2020, Duque had a population of approximately 28,000 people. The majority of the population is of mixed European and indigenous descent. The town is also home to a small Afro-Colombian population. The majority of the population speaks Spanish, with some speaking the indigenous language of Wayuu. The town is predominantly Roman Catholic, with some Protestant and other religious minorities.
Common Questions
What is Per Capita Income in Duque?
Per Capita income in Duque is $12,621.
What is the Median Family Income in Duque?
Median Family Income in Duque is $20,108.
What is the Median Household income in Duque?
Median Household Income in Duque is $21,326.
What is Income or Wage Gap in Duque?
Income or Wage Gap in Duque is 11.8%.
Women in Duque earn 88.2 cents for every dollar earned by a man.
What is Inequality or Gini Index in Duque?
Inequality or Gini Index in Duque is 0.35.
What is the Total Population of Duque?
Total Population of Duque is 1,313.
What is the Total Male Population of Duque?
Total Male Population of Duque is 583.
What is the Total Female Population of Duque?
Total Female Population of Duque is 730.
What is the Ratio of Males per 100 Females in Duque?
There are 79.86 Males per 100 Females in Duque.
What is the Ratio of Females per 100 Males in Duque?
There are 125.21 Females per 100 Males in Duque.
What is the Median Population Age in Duque?
Median Population Age in Duque is 53.6 Years.
What is the Average Family Size in Duque
Average Family Size in Duque is 2.8 People.
What is the Average Household Size in Duque
Average Household Size in Duque is 2.3 People.
How Large is the Labor Force in Duque?
There are 422 People in the Labor Forcein in Duque.
What is the Percentage of People in the Labor Force in Duque?
35.7% of People are in the Labor Force in Duque.
What is the Unemployment Rate in Duque?
Unemployment Rate in Duque is 32.0%.