Toa Alta, PR Map & Demographics
Toa Alta Map
Toa Alta Overview
$11,426
PER CAPITA INCOME
$21,938
AVG FAMILY INCOME
$19,776
AVG HOUSEHOLD INCOME
6.3%
WAGE / INCOME GAP [ % ]
93.7¢/ $1
WAGE / INCOME GAP [ $ ]
0.48
INEQUALITY / GINI INDEX
3,251
TOTAL POPULATION
1,557
MALE POPULATION
1,694
FEMALE POPULATION
91.91
MALES / 100 FEMALES
108.80
FEMALES / 100 MALES
45.4
MEDIAN AGE
3.0
AVG FAMILY SIZE
2.4
AVG HOUSEHOLD SIZE
854
LABOR FORCE [ PEOPLE ]
30.9%
PERCENT IN LABOR FORCE
7.4%
UNEMPLOYMENT RATE
Toa Alta Zip Codes
Income in Toa Alta
Income Overview in Toa Alta
Per Capita Income in Toa Alta is $11,426, while median incomes of families and households are $21,938 and $19,776 respectively.
| Characteristic | Number | Measure |
| Per Capita Income | 3,251 | $11,426 |
| Median Family Income | 826 | $21,938 |
| Mean Family Income | 826 | $28,167 |
| Median Household Income | 1,341 | $19,776 |
| Mean Household Income | 1,341 | $24,901 |
| Income Deficit | 826 | $0 |
| Wage / Income Gap (%) | 3,251 | 6.31% |
| Wage / Income Gap ($) | 3,251 | 93.69¢ per $1 |
| Gini / Inequality Index | 3,251 | 0.48 |
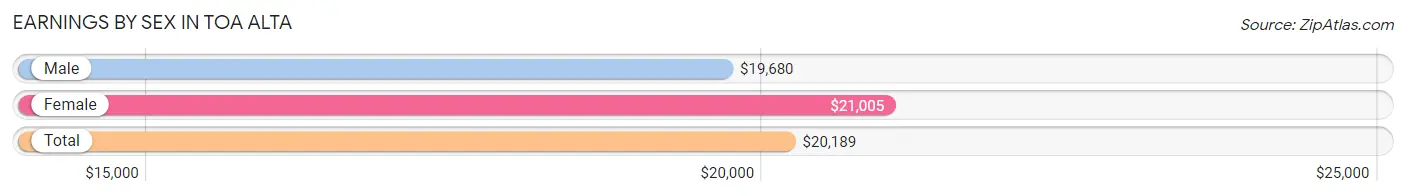
Earnings by Sex in Toa Alta
Average Earnings in Toa Alta are $20,189, $19,680 for men and $21,005 for women, a difference of 6.3%.
| Sex | Number | Average Earnings |
| Male | 505 (57.1%) | $19,680 |
| Female | 379 (42.9%) | $21,005 |
| Total | 884 (100.0%) | $20,189 |
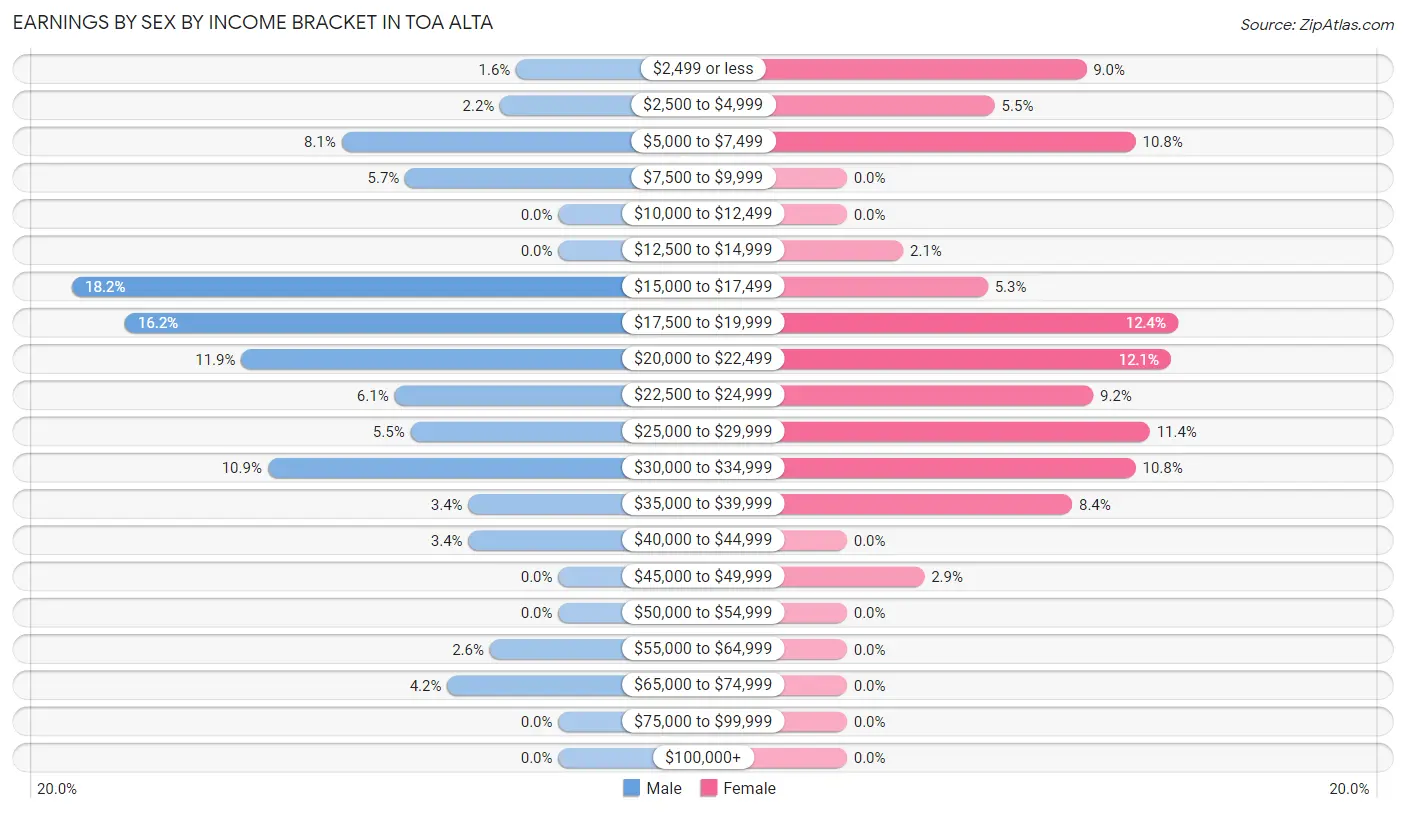
Earnings by Sex by Income Bracket in Toa Alta
The most common earnings brackets in Toa Alta are $15,000 to $17,499 for men (92 | 18.2%) and $17,500 to $19,999 for women (47 | 12.4%).
| Income | Male | Female |
| $2,499 or less | 8 (1.6%) | 34 (9.0%) |
| $2,500 to $4,999 | 11 (2.2%) | 21 (5.5%) |
| $5,000 to $7,499 | 41 (8.1%) | 41 (10.8%) |
| $7,500 to $9,999 | 29 (5.7%) | 0 (0.0%) |
| $10,000 to $12,499 | 0 (0.0%) | 0 (0.0%) |
| $12,500 to $14,999 | 0 (0.0%) | 8 (2.1%) |
| $15,000 to $17,499 | 92 (18.2%) | 20 (5.3%) |
| $17,500 to $19,999 | 82 (16.2%) | 47 (12.4%) |
| $20,000 to $22,499 | 60 (11.9%) | 46 (12.1%) |
| $22,500 to $24,999 | 31 (6.1%) | 35 (9.2%) |
| $25,000 to $29,999 | 28 (5.5%) | 43 (11.4%) |
| $30,000 to $34,999 | 55 (10.9%) | 41 (10.8%) |
| $35,000 to $39,999 | 17 (3.4%) | 32 (8.4%) |
| $40,000 to $44,999 | 17 (3.4%) | 0 (0.0%) |
| $45,000 to $49,999 | 0 (0.0%) | 11 (2.9%) |
| $50,000 to $54,999 | 0 (0.0%) | 0 (0.0%) |
| $55,000 to $64,999 | 13 (2.6%) | 0 (0.0%) |
| $65,000 to $74,999 | 21 (4.2%) | 0 (0.0%) |
| $75,000 to $99,999 | 0 (0.0%) | 0 (0.0%) |
| $100,000+ | 0 (0.0%) | 0 (0.0%) |
| Total | 505 (100.0%) | 379 (100.0%) |
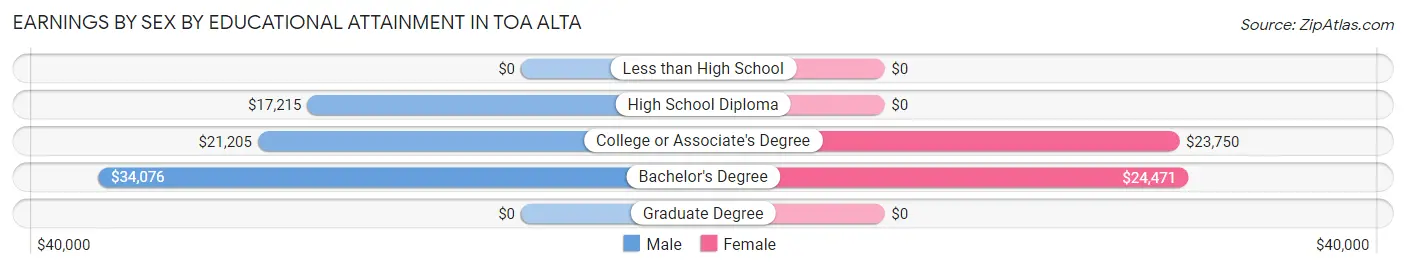
Earnings by Sex by Educational Attainment in Toa Alta
Average earnings in Toa Alta are $20,500 for men and $21,005 for women, a difference of 2.4%. Men with an educational attainment of bachelor's degree enjoy the highest average annual earnings of $34,076, while those with high school diploma education earn the least with $17,215. Women with an educational attainment of bachelor's degree earn the most with the average annual earnings of $24,471, while those with college or associate's degree education have the smallest earnings of $23,750.
| Educational Attainment | Male Income | Female Income |
| Less than High School | - | - |
| High School Diploma | $17,215 | $0 |
| College or Associate's Degree | $21,205 | $23,750 |
| Bachelor's Degree | $34,076 | $24,471 |
| Graduate Degree | - | - |
| Total | $20,500 | $21,005 |
Family Income in Toa Alta
Family Income Brackets in Toa Alta
According to the Toa Alta family income data, there are 296 families falling into the less than $10,000 income range, which is the most common income bracket and makes up 35.8% of all families.
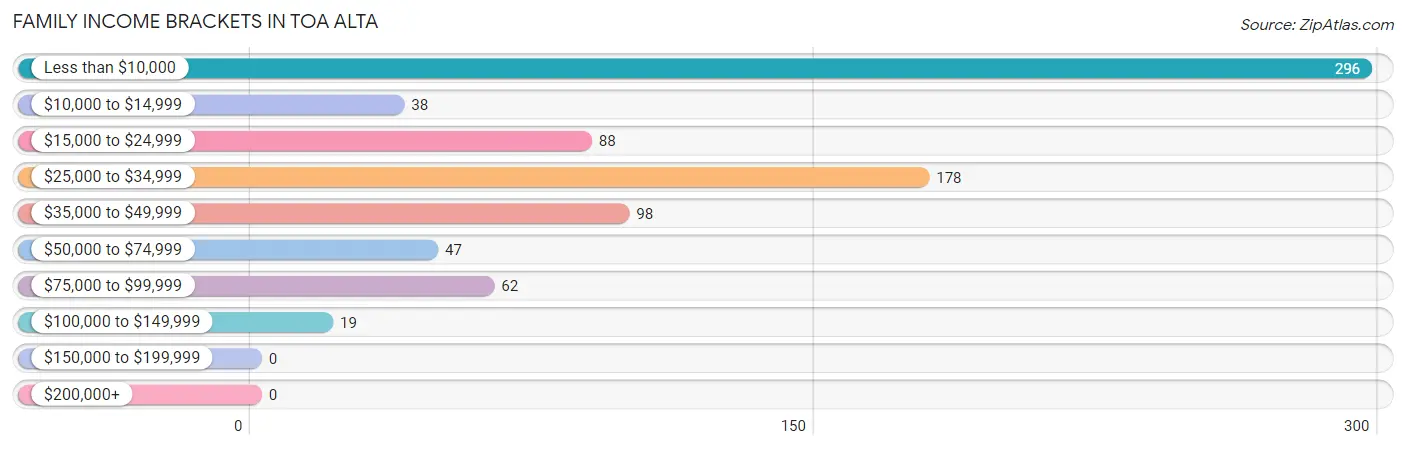
| Income Bracket | # Families | % Families |
| Less than $10,000 | 296 | 35.8% |
| $10,000 to $14,999 | 38 | 4.6% |
| $15,000 to $24,999 | 88 | 10.7% |
| $25,000 to $34,999 | 178 | 21.5% |
| $35,000 to $49,999 | 98 | 11.9% |
| $50,000 to $74,999 | 47 | 5.7% |
| $75,000 to $99,999 | 62 | 7.5% |
| $100,000 to $149,999 | 19 | 2.3% |
| $150,000 to $199,999 | 0 | 0.0% |
| $200,000+ | 0 | 0.0% |
Family Income by Famaliy Size in Toa Alta
4-person families (201 | 24.3%) account for the highest median family income in Toa Alta with $33,953 per family, while 2-person families (492 | 59.6%) have the highest median income of $9,414 per family member.
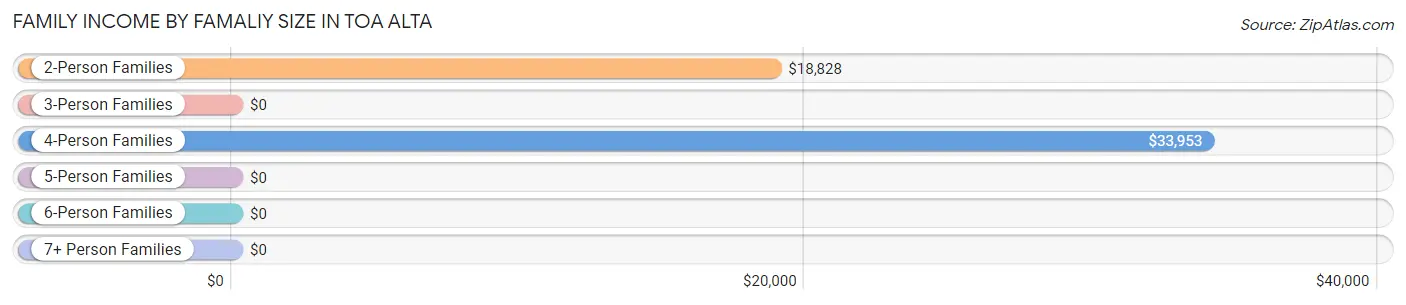
| Income Bracket | # Families | Median Income |
| 2-Person Families | 492 (59.6%) | $18,828 |
| 3-Person Families | 124 (15.0%) | $0 |
| 4-Person Families | 201 (24.3%) | $33,953 |
| 5-Person Families | 9 (1.1%) | $0 |
| 6-Person Families | 0 (0.0%) | $0 |
| 7+ Person Families | 0 (0.0%) | $0 |
| Total | 826 (100.0%) | $21,938 |
Family Income by Number of Earners in Toa Alta
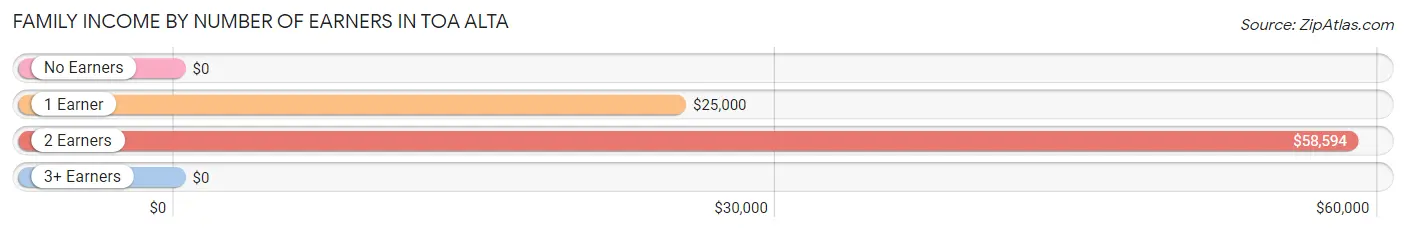
| Number of Earners | # Families | Median Income |
| No Earners | 441 (53.4%) | $0 |
| 1 Earner | 250 (30.3%) | $25,000 |
| 2 Earners | 135 (16.3%) | $58,594 |
| 3+ Earners | 0 (0.0%) | $0 |
| Total | 826 (100.0%) | $21,938 |
Household Income in Toa Alta
Household Income Brackets in Toa Alta
With 410 households falling in the category, the less than $10,000 income range is the most frequent in Toa Alta, accounting for 30.6% of all households.
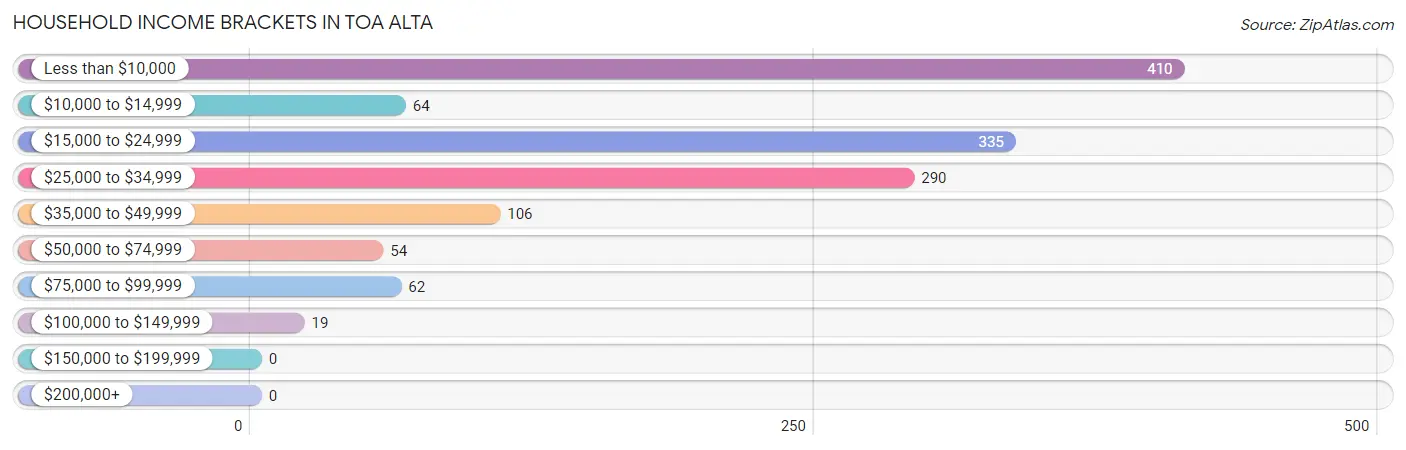
| Income Bracket | # Households | % Households |
| Less than $10,000 | 410 | 30.6% |
| $10,000 to $14,999 | 64 | 4.8% |
| $15,000 to $24,999 | 335 | 25.0% |
| $25,000 to $34,999 | 290 | 21.6% |
| $35,000 to $49,999 | 106 | 7.9% |
| $50,000 to $74,999 | 54 | 4.0% |
| $75,000 to $99,999 | 62 | 4.6% |
| $100,000 to $149,999 | 19 | 1.4% |
| $150,000 to $199,999 | 0 | 0.0% |
| $200,000+ | 0 | 0.0% |
Household Income by Householder Age in Toa Alta
The median household income in Toa Alta is $19,776, with the highest median household income of $25,227 found in the 45 to 64 years age bracket for the primary householder. A total of 448 households (33.4%) fall into this category.
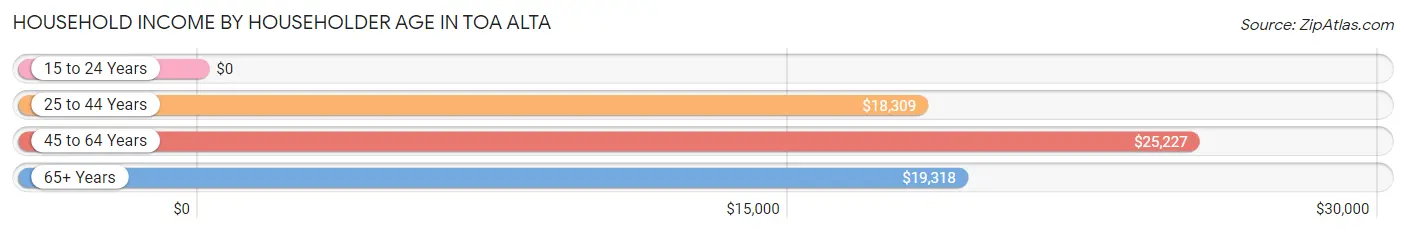
| Income Bracket | # Households | Median Income |
| 15 to 24 Years | 0 (0.0%) | $0 |
| 25 to 44 Years | 371 (27.7%) | $18,309 |
| 45 to 64 Years | 448 (33.4%) | $25,227 |
| 65+ Years | 522 (38.9%) | $19,318 |
| Total | 1,341 (100.0%) | $19,776 |
Poverty in Toa Alta
Income Below Poverty by Sex and Age in Toa Alta
With 44.1% poverty level for males and 49.9% for females among the residents of Toa Alta, 5 year old males and 5 year old females are the most vulnerable to poverty, with 20 males (100.0%) and 23 females (100.0%) in their respective age groups living below the poverty level.
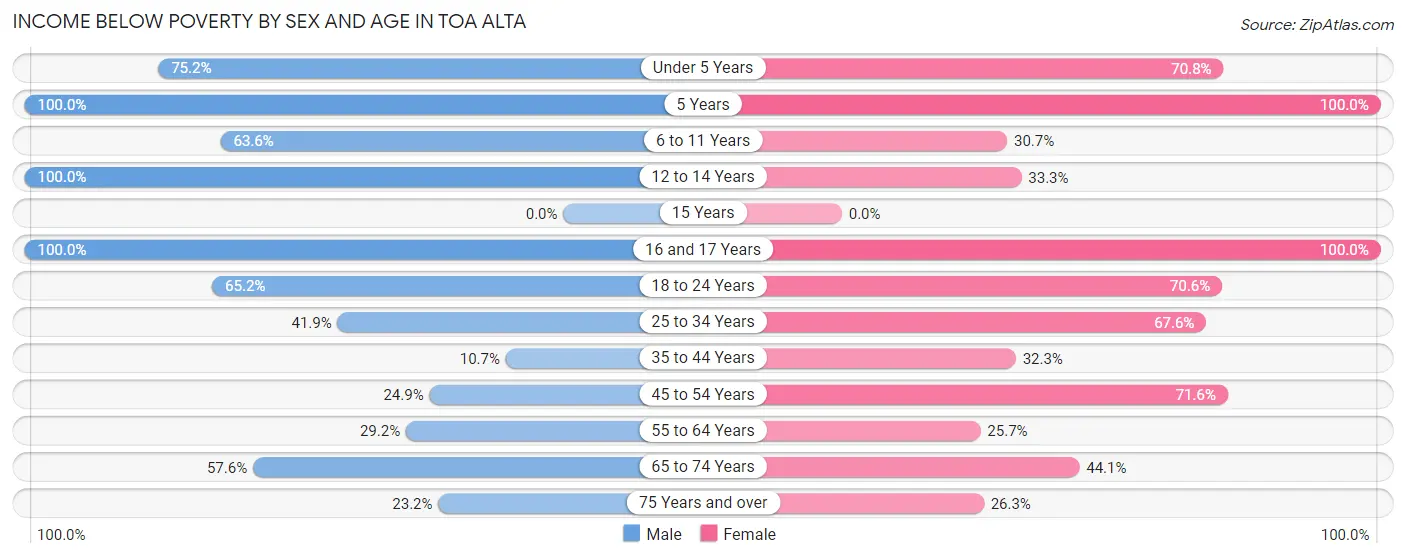
| Age Bracket | Male | Female |
| Under 5 Years | 100 (75.2%) | 34 (70.8%) |
| 5 Years | 20 (100.0%) | 23 (100.0%) |
| 6 to 11 Years | 84 (63.6%) | 23 (30.7%) |
| 12 to 14 Years | 36 (100.0%) | 7 (33.3%) |
| 15 Years | 0 (0.0%) | 0 (0.0%) |
| 16 and 17 Years | 30 (100.0%) | 19 (100.0%) |
| 18 to 24 Years | 73 (65.2%) | 96 (70.6%) |
| 25 to 34 Years | 57 (41.9%) | 234 (67.6%) |
| 35 to 44 Years | 14 (10.7%) | 51 (32.3%) |
| 45 to 54 Years | 84 (24.8%) | 154 (71.6%) |
| 55 to 64 Years | 52 (29.2%) | 62 (25.7%) |
| 65 to 74 Years | 106 (57.6%) | 82 (44.1%) |
| 75 Years and over | 29 (23.2%) | 59 (26.3%) |
| Total | 685 (44.1%) | 844 (49.9%) |
Income Above Poverty by Sex and Age in Toa Alta
According to the poverty statistics in Toa Alta, males aged 35 to 44 years and females aged 55 to 64 years are the age groups that are most secure financially, with 89.3% of males and 74.3% of females in these age groups living above the poverty line.
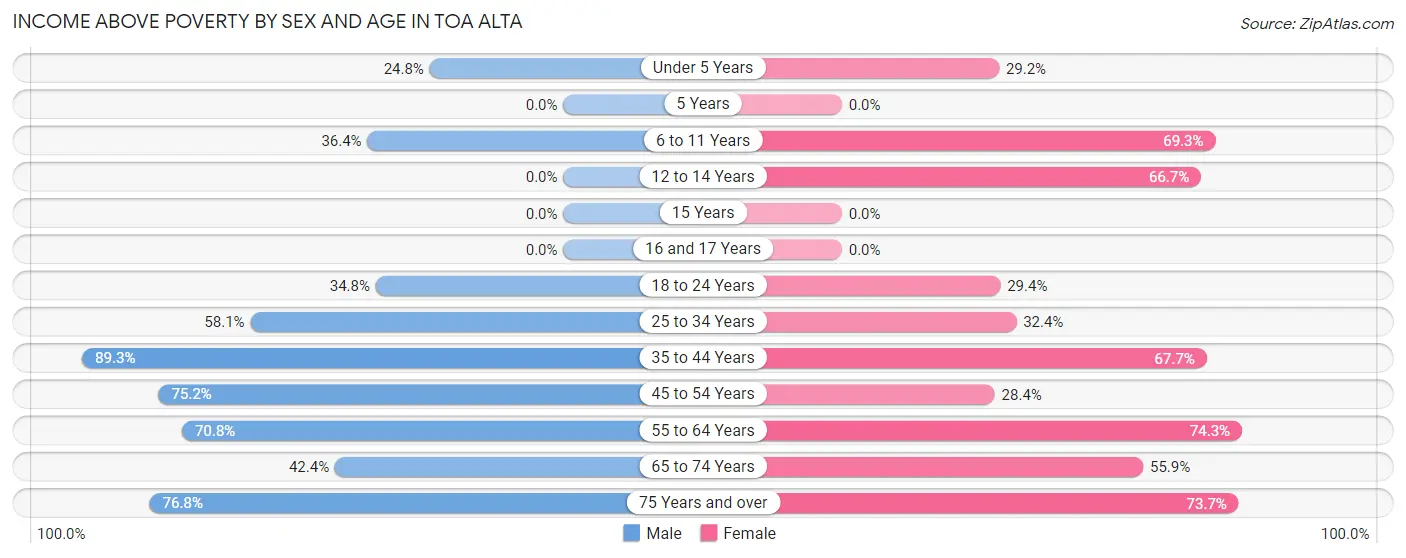
| Age Bracket | Male | Female |
| Under 5 Years | 33 (24.8%) | 14 (29.2%) |
| 5 Years | 0 (0.0%) | 0 (0.0%) |
| 6 to 11 Years | 48 (36.4%) | 52 (69.3%) |
| 12 to 14 Years | 0 (0.0%) | 14 (66.7%) |
| 15 Years | 0 (0.0%) | 0 (0.0%) |
| 16 and 17 Years | 0 (0.0%) | 0 (0.0%) |
| 18 to 24 Years | 39 (34.8%) | 40 (29.4%) |
| 25 to 34 Years | 79 (58.1%) | 112 (32.4%) |
| 35 to 44 Years | 117 (89.3%) | 107 (67.7%) |
| 45 to 54 Years | 254 (75.1%) | 61 (28.4%) |
| 55 to 64 Years | 126 (70.8%) | 179 (74.3%) |
| 65 to 74 Years | 78 (42.4%) | 104 (55.9%) |
| 75 Years and over | 96 (76.8%) | 165 (73.7%) |
| Total | 870 (55.9%) | 848 (50.1%) |
Income Below Poverty Among Married-Couple Families in Toa Alta
The poverty statistics for married-couple families in Toa Alta show that 10.1% or 32 of the total 316 families live below the poverty line. Families with no children have the highest poverty rate of 14.8%, comprising of 32 families. On the other hand, families with 1 or 2 children have the lowest poverty rate of 0.0%, which includes 0 families.
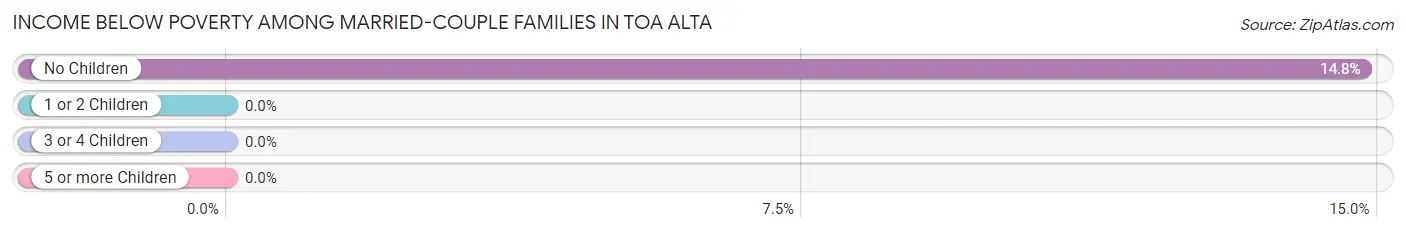
| Children | Above Poverty | Below Poverty |
| No Children | 184 (85.2%) | 32 (14.8%) |
| 1 or 2 Children | 100 (100.0%) | 0 (0.0%) |
| 3 or 4 Children | 0 (0.0%) | 0 (0.0%) |
| 5 or more Children | 0 (0.0%) | 0 (0.0%) |
| Total | 284 (89.9%) | 32 (10.1%) |
Income Below Poverty Among Single-Parent Households in Toa Alta
According to the poverty data in Toa Alta, 100.0% or 30 single-father households and 69.8% or 335 single-mother households are living below the poverty line. Among single-father households, those with 1 or 2 children have the highest poverty rate, with 30 households (100.0%) experiencing poverty. Likewise, among single-mother households, those with 1 or 2 children have the highest poverty rate, with 279 households (91.8%) falling below the poverty line.
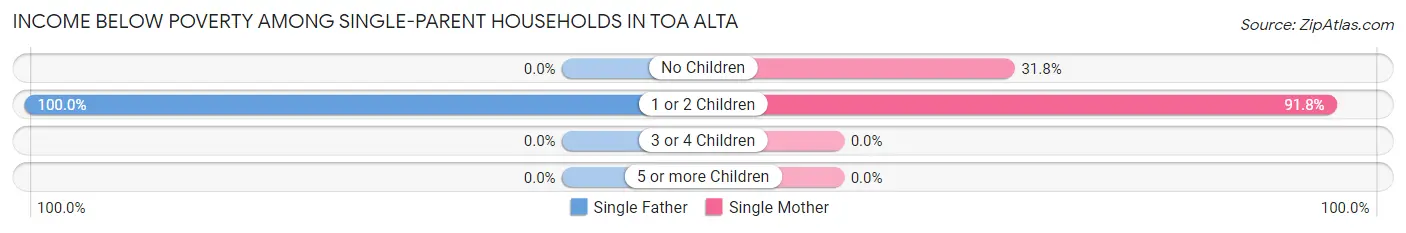
| Children | Single Father | Single Mother |
| No Children | 0 (0.0%) | 56 (31.8%) |
| 1 or 2 Children | 30 (100.0%) | 279 (91.8%) |
| 3 or 4 Children | 0 (0.0%) | 0 (0.0%) |
| 5 or more Children | 0 (0.0%) | 0 (0.0%) |
| Total | 30 (100.0%) | 335 (69.8%) |
Income Below Poverty Among Married-Couple vs Single-Parent Households in Toa Alta
The poverty data for Toa Alta shows that 32 of the married-couple family households (10.1%) and 365 of the single-parent households (71.6%) are living below the poverty level. Within the married-couple family households, those with no children have the highest poverty rate, with 32 households (14.8%) falling below the poverty line. Among the single-parent households, those with 1 or 2 children have the highest poverty rate, with 309 household (92.5%) living below poverty.
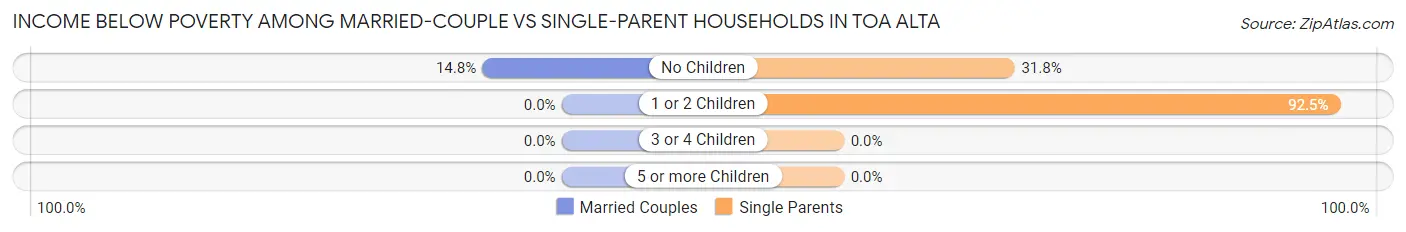
| Children | Married-Couple Families | Single-Parent Households |
| No Children | 32 (14.8%) | 56 (31.8%) |
| 1 or 2 Children | 0 (0.0%) | 309 (92.5%) |
| 3 or 4 Children | 0 (0.0%) | 0 (0.0%) |
| 5 or more Children | 0 (0.0%) | 0 (0.0%) |
| Total | 32 (10.1%) | 365 (71.6%) |
Race in Toa Alta
The most populous races in Toa Alta are Hispanic or Latino (3,230 | 99.4%), White / Caucasian (1,948 | 59.9%), and Two or more Races (702 | 21.6%).
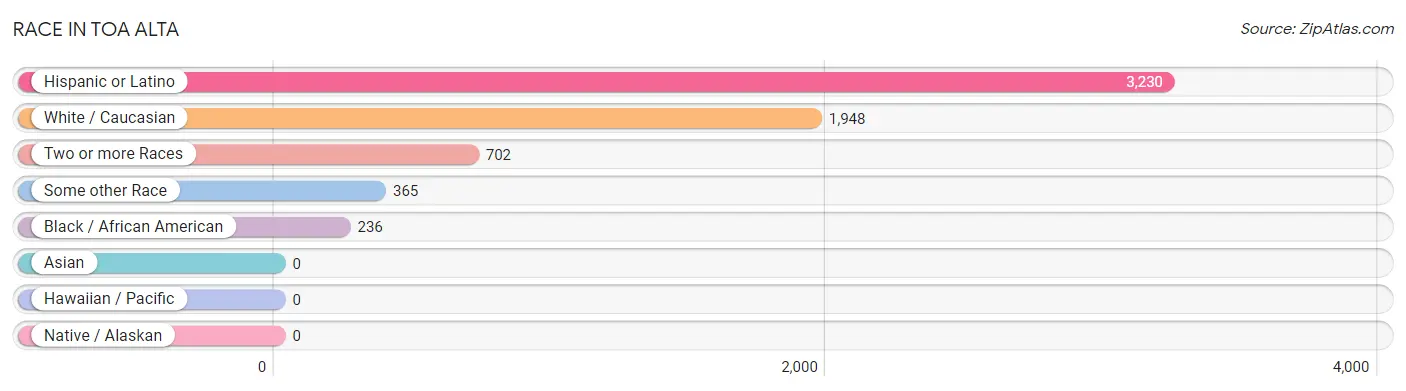
| Race | # Population | % Population |
| Asian | 0 | 0.0% |
| Black / African American | 236 | 7.3% |
| Hawaiian / Pacific | 0 | 0.0% |
| Hispanic or Latino | 3,230 | 99.4% |
| Native / Alaskan | 0 | 0.0% |
| White / Caucasian | 1,948 | 59.9% |
| Two or more Races | 702 | 21.6% |
| Some other Race | 365 | 11.2% |
| Total | 3,251 | 100.0% |
Ancestry in Toa Alta
The most populous ancestries reported in Toa Alta are Puerto Rican (3,212 | 98.8%), American (53 | 1.6%), Central American Indian (28 | 0.9%), Dominican (10 | 0.3%), and French (9 | 0.3%), together accounting for 101.9% of all Toa Alta residents.
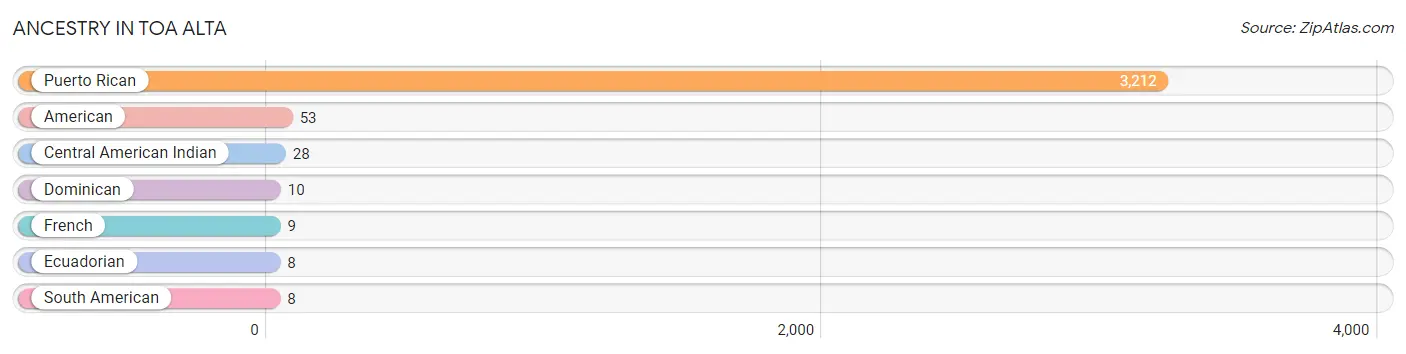
| Ancestry | # Population | % Population |
| American | 53 | 1.6% |
| Central American Indian | 28 | 0.9% |
| Dominican | 10 | 0.3% |
| Ecuadorian | 8 | 0.3% |
| French | 9 | 0.3% |
| Puerto Rican | 3,212 | 98.8% |
| South American | 8 | 0.3% | View All 7 Rows |
Immigrants in Toa Alta

| Immigration Origin | # Population | % Population | View All 0 Rows |
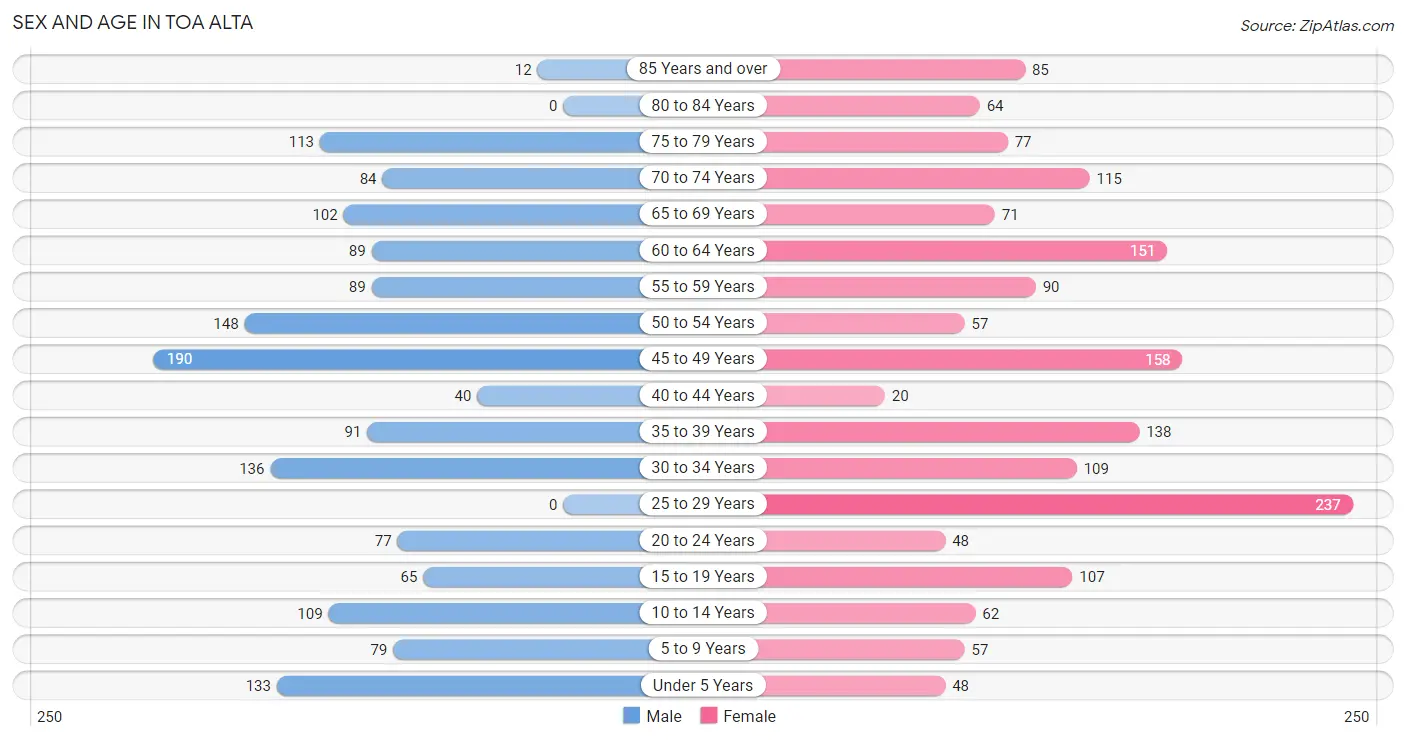
Sex and Age in Toa Alta
Sex and Age in Toa Alta
The most populous age groups in Toa Alta are 45 to 49 Years (190 | 12.2%) for men and 25 to 29 Years (237 | 14.0%) for women.
| Age Bracket | Male | Female |
| Under 5 Years | 133 (8.5%) | 48 (2.8%) |
| 5 to 9 Years | 79 (5.1%) | 57 (3.4%) |
| 10 to 14 Years | 109 (7.0%) | 62 (3.7%) |
| 15 to 19 Years | 65 (4.2%) | 107 (6.3%) |
| 20 to 24 Years | 77 (5.0%) | 48 (2.8%) |
| 25 to 29 Years | 0 (0.0%) | 237 (14.0%) |
| 30 to 34 Years | 136 (8.7%) | 109 (6.4%) |
| 35 to 39 Years | 91 (5.8%) | 138 (8.2%) |
| 40 to 44 Years | 40 (2.6%) | 20 (1.2%) |
| 45 to 49 Years | 190 (12.2%) | 158 (9.3%) |
| 50 to 54 Years | 148 (9.5%) | 57 (3.4%) |
| 55 to 59 Years | 89 (5.7%) | 90 (5.3%) |
| 60 to 64 Years | 89 (5.7%) | 151 (8.9%) |
| 65 to 69 Years | 102 (6.6%) | 71 (4.2%) |
| 70 to 74 Years | 84 (5.4%) | 115 (6.8%) |
| 75 to 79 Years | 113 (7.3%) | 77 (4.5%) |
| 80 to 84 Years | 0 (0.0%) | 64 (3.8%) |
| 85 Years and over | 12 (0.8%) | 85 (5.0%) |
| Total | 1,557 (100.0%) | 1,694 (100.0%) |
Families and Households in Toa Alta
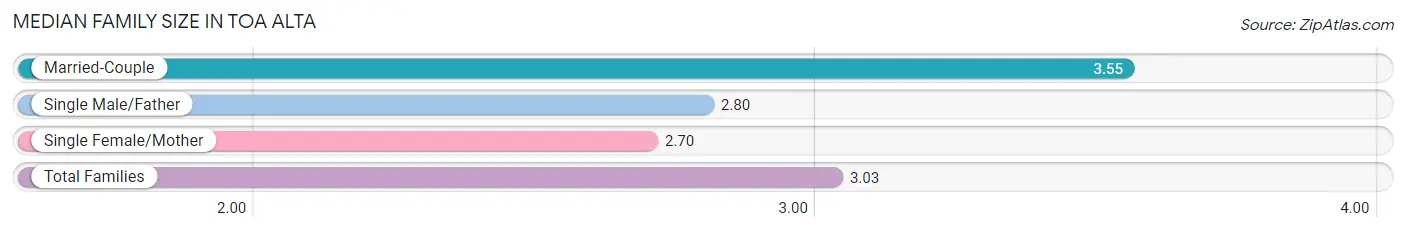
Median Family Size in Toa Alta
The median family size in Toa Alta is 3.03 persons per family, with married-couple families (316 | 38.3%) accounting for the largest median family size of 3.55 persons per family. On the other hand, single female/mother families (480 | 58.1%) represent the smallest median family size with 2.70 persons per family.
| Family Type | # Families | Family Size |
| Married-Couple | 316 (38.3%) | 3.55 |
| Single Male/Father | 30 (3.6%) | 2.80 |
| Single Female/Mother | 480 (58.1%) | 2.70 |
| Total Families | 826 (100.0%) | 3.03 |
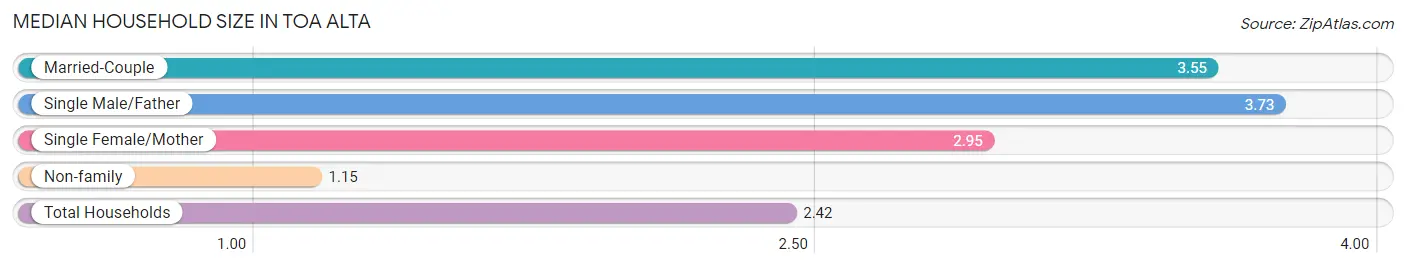
Median Household Size in Toa Alta
The median household size in Toa Alta is 2.42 persons per household, with single male/father households (30 | 2.2%) accounting for the largest median household size of 3.73 persons per household. non-family households (515 | 38.4%) represent the smallest median household size with 1.15 persons per household.
| Household Type | # Households | Household Size |
| Married-Couple | 316 (23.6%) | 3.55 |
| Single Male/Father | 30 (2.2%) | 3.73 |
| Single Female/Mother | 480 (35.8%) | 2.95 |
| Non-family | 515 (38.4%) | 1.15 |
| Total Households | 1,341 (100.0%) | 2.42 |
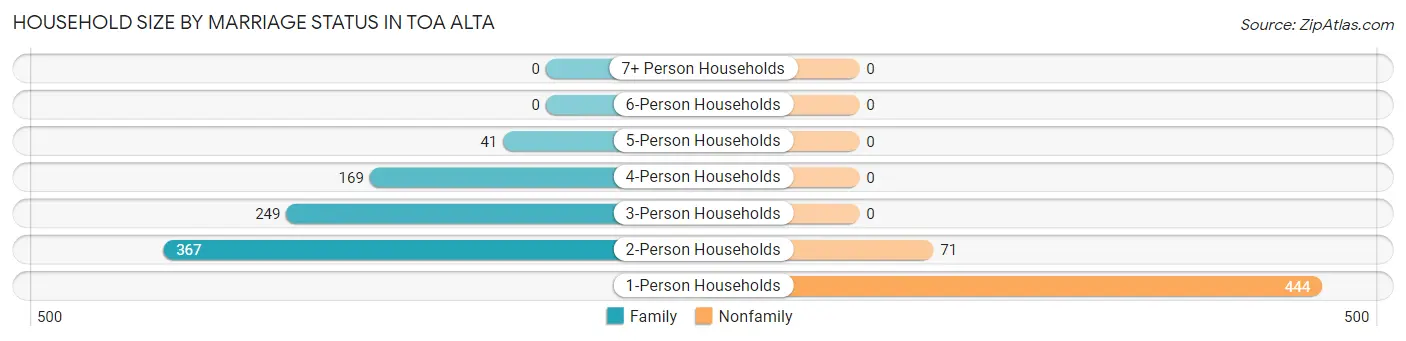
Household Size by Marriage Status in Toa Alta
Out of a total of 1,341 households in Toa Alta, 826 (61.6%) are family households, while 515 (38.4%) are nonfamily households. The most numerous type of family households are 2-person households, comprising 367, and the most common type of nonfamily households are 1-person households, comprising 444.
| Household Size | Family Households | Nonfamily Households |
| 1-Person Households | - | 444 (33.1%) |
| 2-Person Households | 367 (27.4%) | 71 (5.3%) |
| 3-Person Households | 249 (18.6%) | 0 (0.0%) |
| 4-Person Households | 169 (12.6%) | 0 (0.0%) |
| 5-Person Households | 41 (3.1%) | 0 (0.0%) |
| 6-Person Households | 0 (0.0%) | 0 (0.0%) |
| 7+ Person Households | 0 (0.0%) | 0 (0.0%) |
| Total | 826 (61.6%) | 515 (38.4%) |
Female Fertility in Toa Alta
Fertility by Age in Toa Alta
| Age Bracket | Women with Births | Births / 1,000 Women |
| 15 to 19 years | 0 (0.0%) | 0.0 |
| 20 to 34 years | 0 (0.0%) | 0.0 |
| 35 to 50 years | 0 (0.0%) | 0.0 |
| Total | 0 (0.0%) | 0.0 |
Fertility by Age by Marriage Status in Toa Alta
| Age Bracket | Married | Unmarried |
| 15 to 19 years | 0 (0.0%) | 0 (0.0%) |
| 20 to 34 years | 0 (0.0%) | 0 (0.0%) |
| 35 to 50 years | 0 (0.0%) | 0 (0.0%) |
| Total | 0 (0.0%) | 0 (0.0%) |
Fertility by Education in Toa Alta
| Educational Attainment | Women with Births | Births / 1,000 Women |
| Less than High School | 0 (0.0%) | 0.0 |
| High School Diploma | 0 (0.0%) | 0.0 |
| College or Associate's Degree | 0 (0.0%) | 0.0 |
| Bachelor's Degree | 0 (0.0%) | 0.0 |
| Graduate Degree | 0 (0.0%) | 0.0 |
| Total | 0 (0.0%) | 0.0 |
Fertility by Education by Marriage Status in Toa Alta
| Educational Attainment | Married | Unmarried |
| Less than High School | 0 (0.0%) | 0 (0.0%) |
| High School Diploma | 0 (0.0%) | 0 (0.0%) |
| College or Associate's Degree | 0 (0.0%) | 0 (0.0%) |
| Bachelor's Degree | 0 (0.0%) | 0 (0.0%) |
| Graduate Degree | 0 (0.0%) | 0 (0.0%) |
| Total | 0 (0.0%) | 0 (0.0%) |
Employment Characteristics in Toa Alta
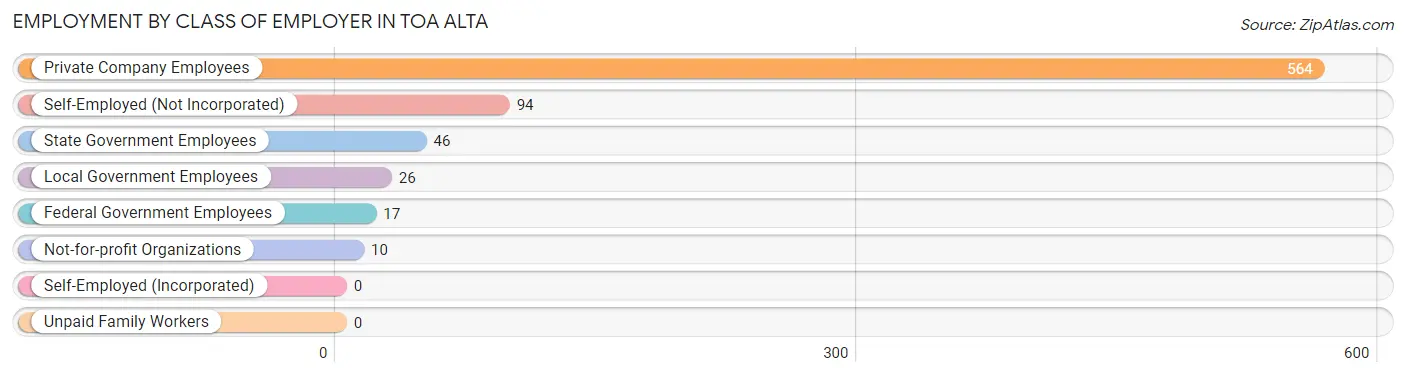
Employment by Class of Employer in Toa Alta
Among the 757 employed individuals in Toa Alta, private company employees (564 | 74.5%), self-employed (not incorporated) (94 | 12.4%), and state government employees (46 | 6.1%) make up the most common classes of employment.
| Employer Class | # Employees | % Employees |
| Private Company Employees | 564 | 74.5% |
| Self-Employed (Incorporated) | 0 | 0.0% |
| Self-Employed (Not Incorporated) | 94 | 12.4% |
| Not-for-profit Organizations | 10 | 1.3% |
| Local Government Employees | 26 | 3.4% |
| State Government Employees | 46 | 6.1% |
| Federal Government Employees | 17 | 2.2% |
| Unpaid Family Workers | 0 | 0.0% |
| Total | 757 | 100.0% |
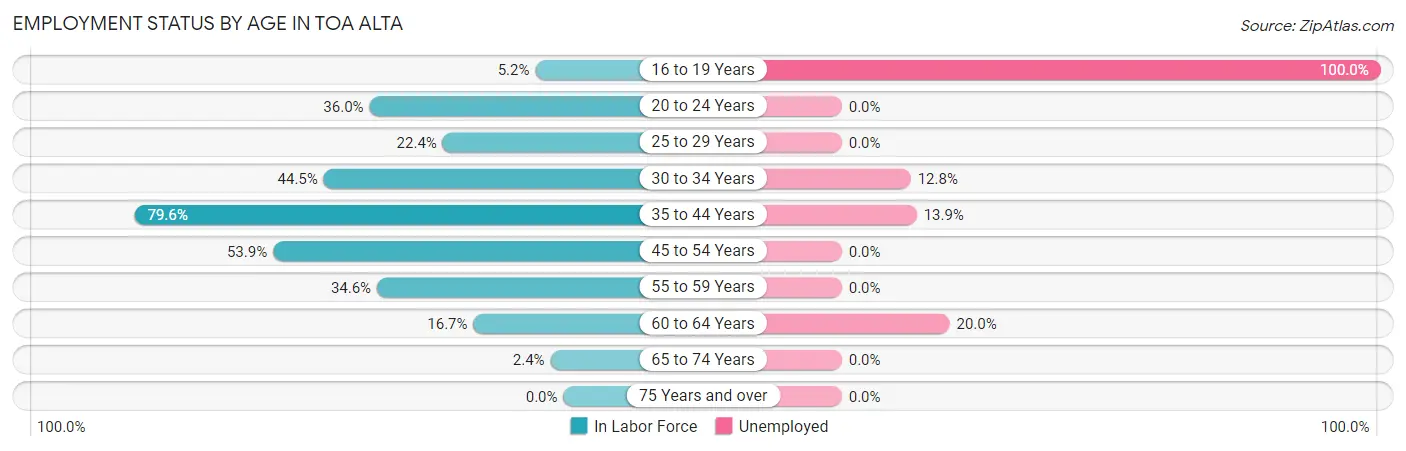
Employment Status by Age in Toa Alta
According to the labor force statistics for Toa Alta, out of the total population over 16 years of age (2,763), 30.9% or 854 individuals are in the labor force, with 7.4% or 63 of them unemployed. The age group with the highest labor force participation rate is 35 to 44 years, with 79.6% or 230 individuals in the labor force. Within the labor force, the 16 to 19 years age range has the highest percentage of unemployed individuals, with 100.0% or 9 of them being unemployed.
| Age Bracket | In Labor Force | Unemployed |
| 16 to 19 Years | 9 (5.2%) | 9 (100.0%) |
| 20 to 24 Years | 45 (36.0%) | 0 (0.0%) |
| 25 to 29 Years | 53 (22.4%) | 0 (0.0%) |
| 30 to 34 Years | 109 (44.5%) | 14 (12.8%) |
| 35 to 44 Years | 230 (79.6%) | 32 (13.9%) |
| 45 to 54 Years | 298 (53.9%) | 0 (0.0%) |
| 55 to 59 Years | 62 (34.6%) | 0 (0.0%) |
| 60 to 64 Years | 40 (16.7%) | 8 (20.0%) |
| 65 to 74 Years | 9 (2.4%) | 0 (0.0%) |
| 75 Years and over | 0 (0.0%) | 0 (0.0%) |
| Total | 854 (30.9%) | 63 (7.4%) |
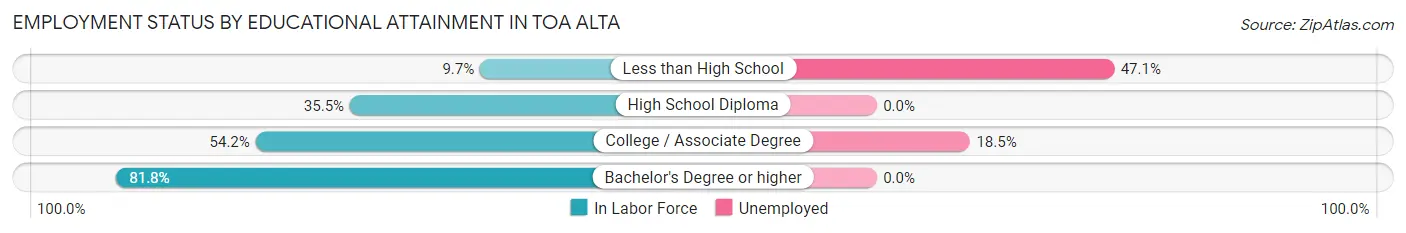
Employment Status by Educational Attainment in Toa Alta
According to labor force statistics for Toa Alta, 45.4% of individuals (791) out of the total population between 25 and 64 years of age (1,743) are in the labor force, with 6.8% or 54 of them being unemployed. The group with the highest labor force participation rate are those with the educational attainment of bachelor's degree or higher, with 81.8% or 234 individuals in the labor force. Within the labor force, individuals with less than high school education have the highest percentage of unemployment, with 47.1% or 8 of them being unemployed.
| Educational Attainment | In Labor Force | Unemployed |
| Less than High School | 17 (9.7%) | 82 (47.1%) |
| High School Diploma | 292 (35.5%) | 0 (0.0%) |
| College / Associate Degree | 249 (54.2%) | 85 (18.5%) |
| Bachelor's Degree or higher | 234 (81.8%) | 0 (0.0%) |
| Total | 791 (45.4%) | 119 (6.8%) |
Employment Occupations by Sex in Toa Alta
Management, Business, Science and Arts Occupations
The most common Management, Business, Science and Arts occupations in Toa Alta are Community & Social Service (73 | 9.2%), Management (65 | 8.2%), Health Diagnosing & Treating (55 | 6.9%), Education Instruction & Library (50 | 6.3%), and Arts, Media & Entertainment (23 | 2.9%).
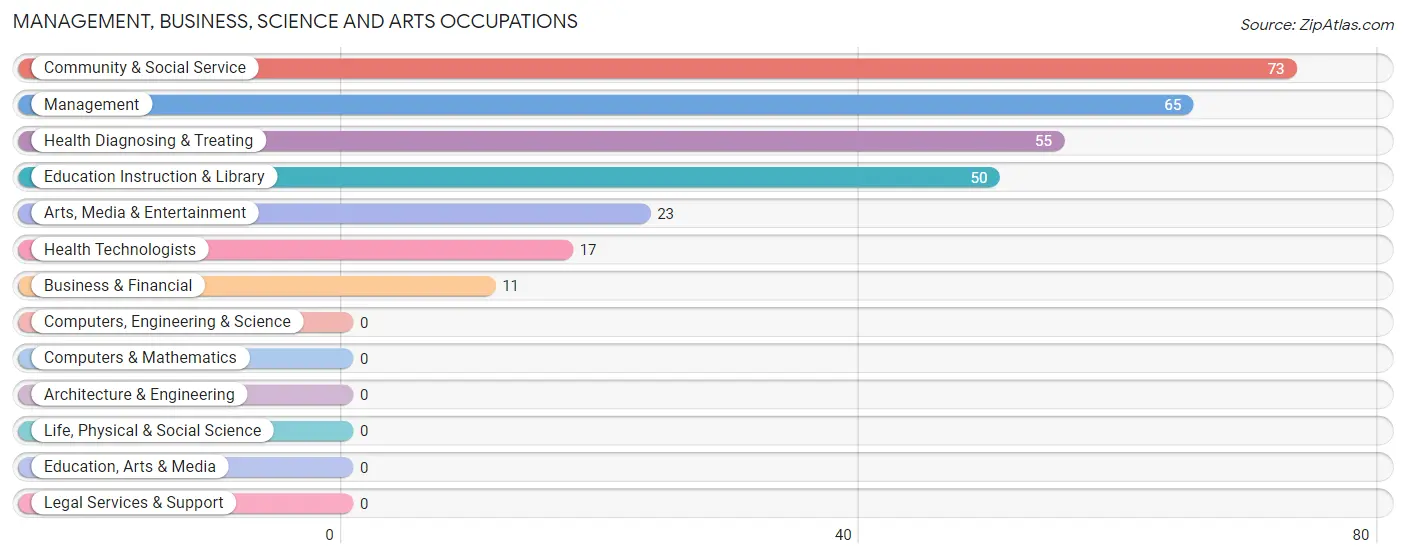
Management, Business, Science and Arts Occupations by Sex
Within the Management, Business, Science and Arts occupations in Toa Alta, the most male-oriented occupations are Business & Financial (100.0%), Arts, Media & Entertainment (100.0%), and Health Technologists (100.0%), while the most female-oriented occupations are Education Instruction & Library (100.0%), Community & Social Service (68.5%), and Management (32.3%).
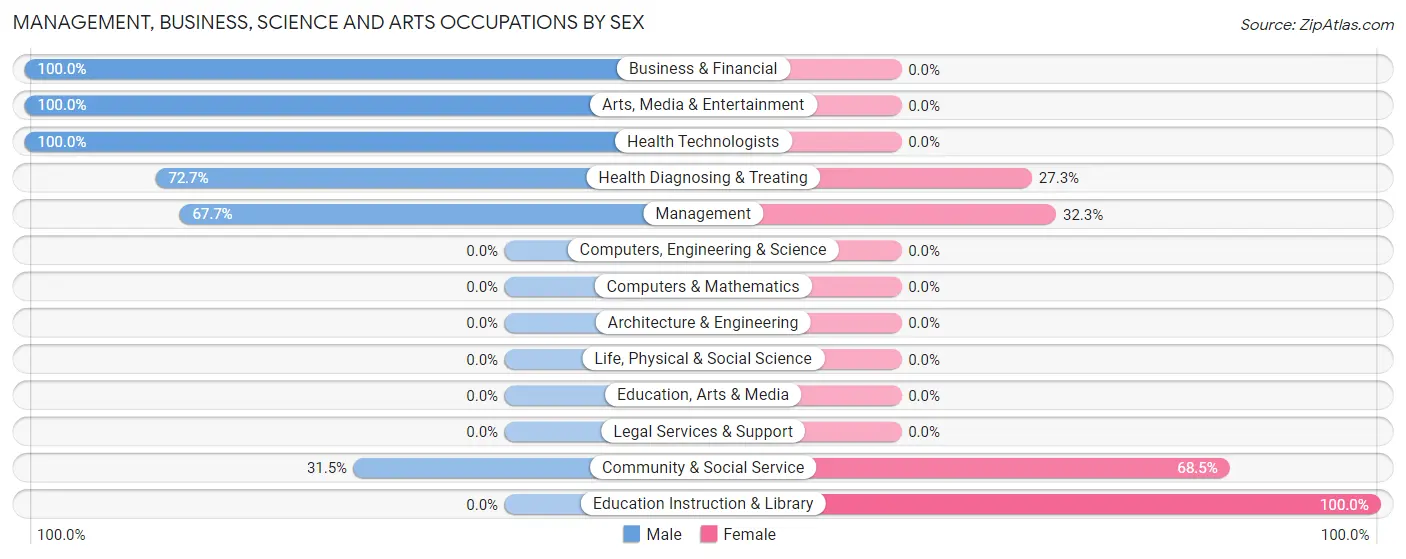
| Occupation | Male | Female |
| Management | 44 (67.7%) | 21 (32.3%) |
| Business & Financial | 11 (100.0%) | 0 (0.0%) |
| Computers, Engineering & Science | 0 (0.0%) | 0 (0.0%) |
| Computers & Mathematics | 0 (0.0%) | 0 (0.0%) |
| Architecture & Engineering | 0 (0.0%) | 0 (0.0%) |
| Life, Physical & Social Science | 0 (0.0%) | 0 (0.0%) |
| Community & Social Service | 23 (31.5%) | 50 (68.5%) |
| Education, Arts & Media | 0 (0.0%) | 0 (0.0%) |
| Legal Services & Support | 0 (0.0%) | 0 (0.0%) |
| Education Instruction & Library | 0 (0.0%) | 50 (100.0%) |
| Arts, Media & Entertainment | 23 (100.0%) | 0 (0.0%) |
| Health Diagnosing & Treating | 40 (72.7%) | 15 (27.3%) |
| Health Technologists | 17 (100.0%) | 0 (0.0%) |
| Total (Category) | 118 (57.8%) | 86 (42.2%) |
| Total (Overall) | 465 (58.7%) | 327 (41.3%) |
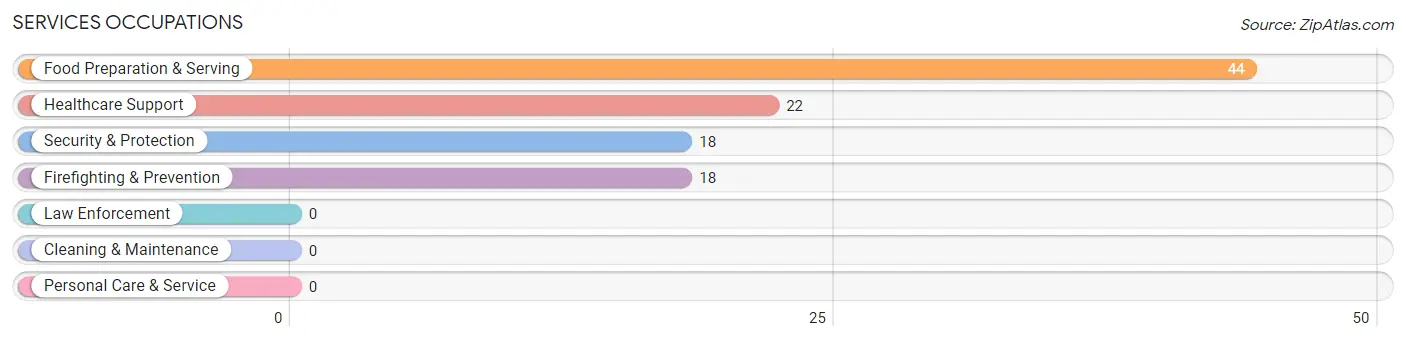
Services Occupations
The most common Services occupations in Toa Alta are Food Preparation & Serving (44 | 5.6%), Healthcare Support (22 | 2.8%), Security & Protection (18 | 2.3%), and Firefighting & Prevention (18 | 2.3%).
Services Occupations by Sex
Within the Services occupations in Toa Alta, the most male-oriented occupations are Security & Protection (100.0%), and Firefighting & Prevention (100.0%), while the most female-oriented occupations are Healthcare Support (100.0%), and Food Preparation & Serving (100.0%).
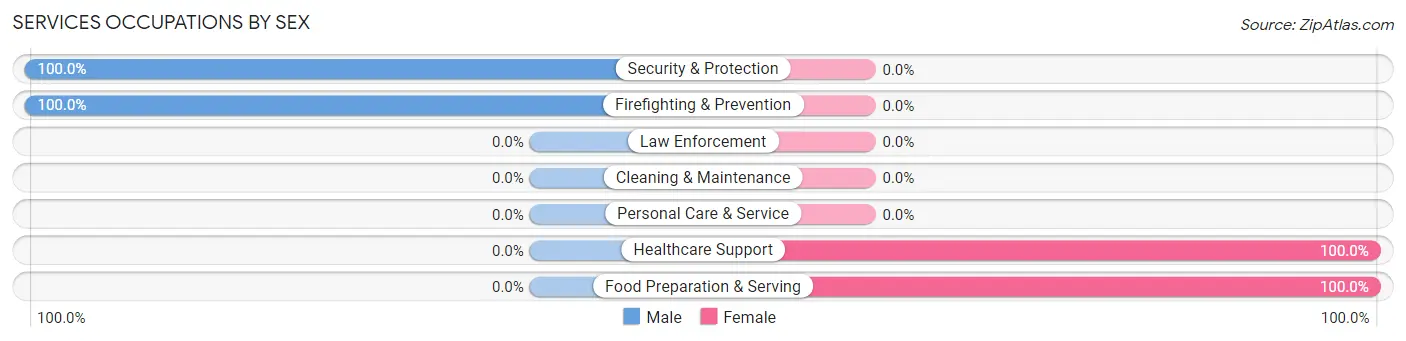
| Occupation | Male | Female |
| Healthcare Support | 0 (0.0%) | 22 (100.0%) |
| Security & Protection | 18 (100.0%) | 0 (0.0%) |
| Firefighting & Prevention | 18 (100.0%) | 0 (0.0%) |
| Law Enforcement | 0 (0.0%) | 0 (0.0%) |
| Food Preparation & Serving | 0 (0.0%) | 44 (100.0%) |
| Cleaning & Maintenance | 0 (0.0%) | 0 (0.0%) |
| Personal Care & Service | 0 (0.0%) | 0 (0.0%) |
| Total (Category) | 18 (21.4%) | 66 (78.6%) |
| Total (Overall) | 465 (58.7%) | 327 (41.3%) |
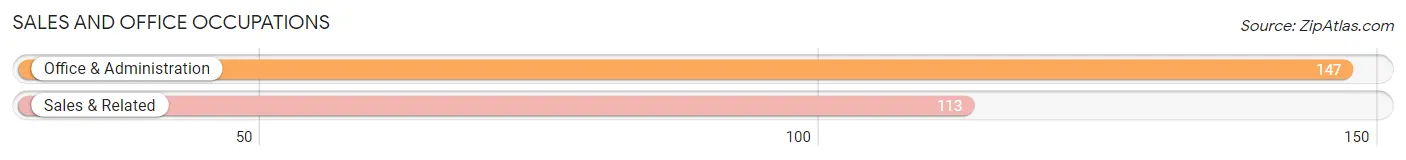
Sales and Office Occupations
The most common Sales and Office occupations in Toa Alta are Office & Administration (147 | 18.6%), and Sales & Related (113 | 14.3%).
Sales and Office Occupations by Sex
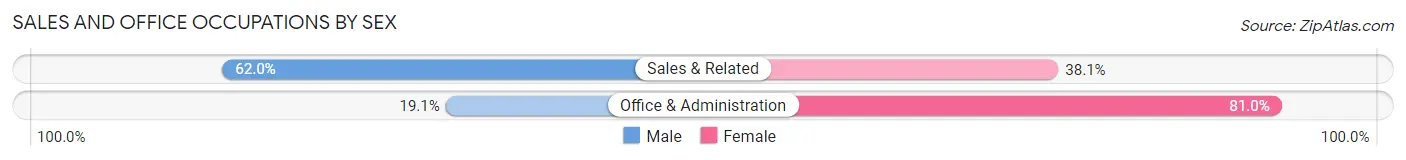
| Occupation | Male | Female |
| Sales & Related | 70 (62.0%) | 43 (38.1%) |
| Office & Administration | 28 (19.1%) | 119 (80.9%) |
| Total (Category) | 98 (37.7%) | 162 (62.3%) |
| Total (Overall) | 465 (58.7%) | 327 (41.3%) |
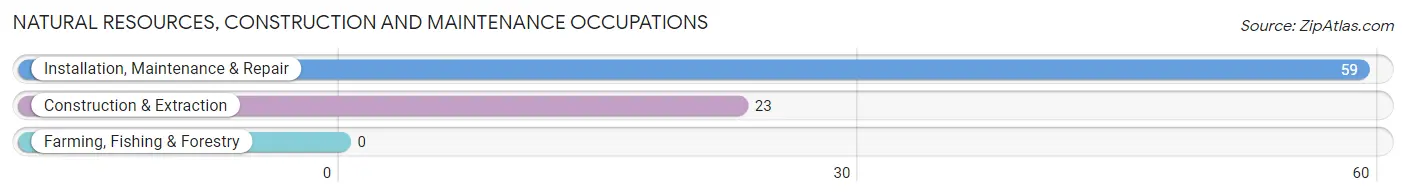
Natural Resources, Construction and Maintenance Occupations
The most common Natural Resources, Construction and Maintenance occupations in Toa Alta are Installation, Maintenance & Repair (59 | 7.4%), and Construction & Extraction (23 | 2.9%).
Natural Resources, Construction and Maintenance Occupations by Sex
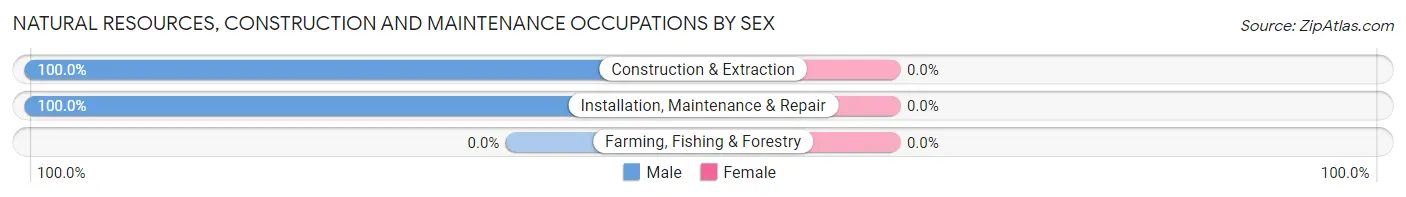
| Occupation | Male | Female |
| Farming, Fishing & Forestry | 0 (0.0%) | 0 (0.0%) |
| Construction & Extraction | 23 (100.0%) | 0 (0.0%) |
| Installation, Maintenance & Repair | 59 (100.0%) | 0 (0.0%) |
| Total (Category) | 82 (100.0%) | 0 (0.0%) |
| Total (Overall) | 465 (58.7%) | 327 (41.3%) |
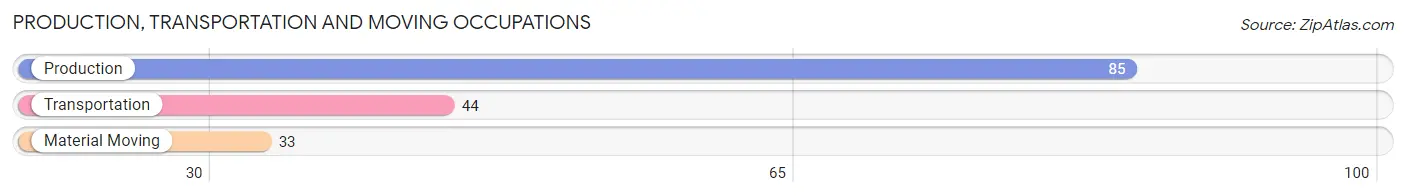
Production, Transportation and Moving Occupations
The most common Production, Transportation and Moving occupations in Toa Alta are Production (85 | 10.7%), Transportation (44 | 5.6%), and Material Moving (33 | 4.2%).
Production, Transportation and Moving Occupations by Sex
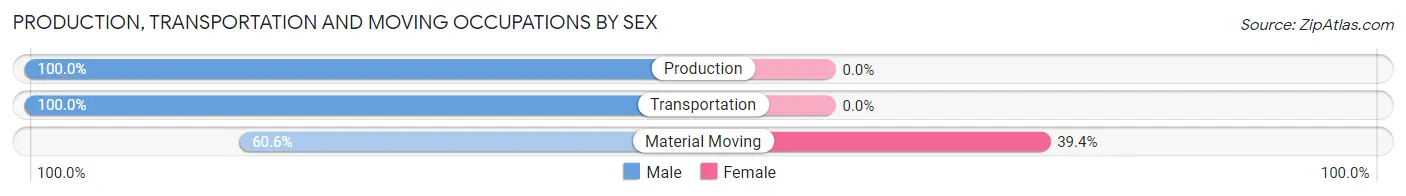
| Occupation | Male | Female |
| Production | 85 (100.0%) | 0 (0.0%) |
| Transportation | 44 (100.0%) | 0 (0.0%) |
| Material Moving | 20 (60.6%) | 13 (39.4%) |
| Total (Category) | 149 (92.0%) | 13 (8.0%) |
| Total (Overall) | 465 (58.7%) | 327 (41.3%) |
Employment Industries by Sex in Toa Alta
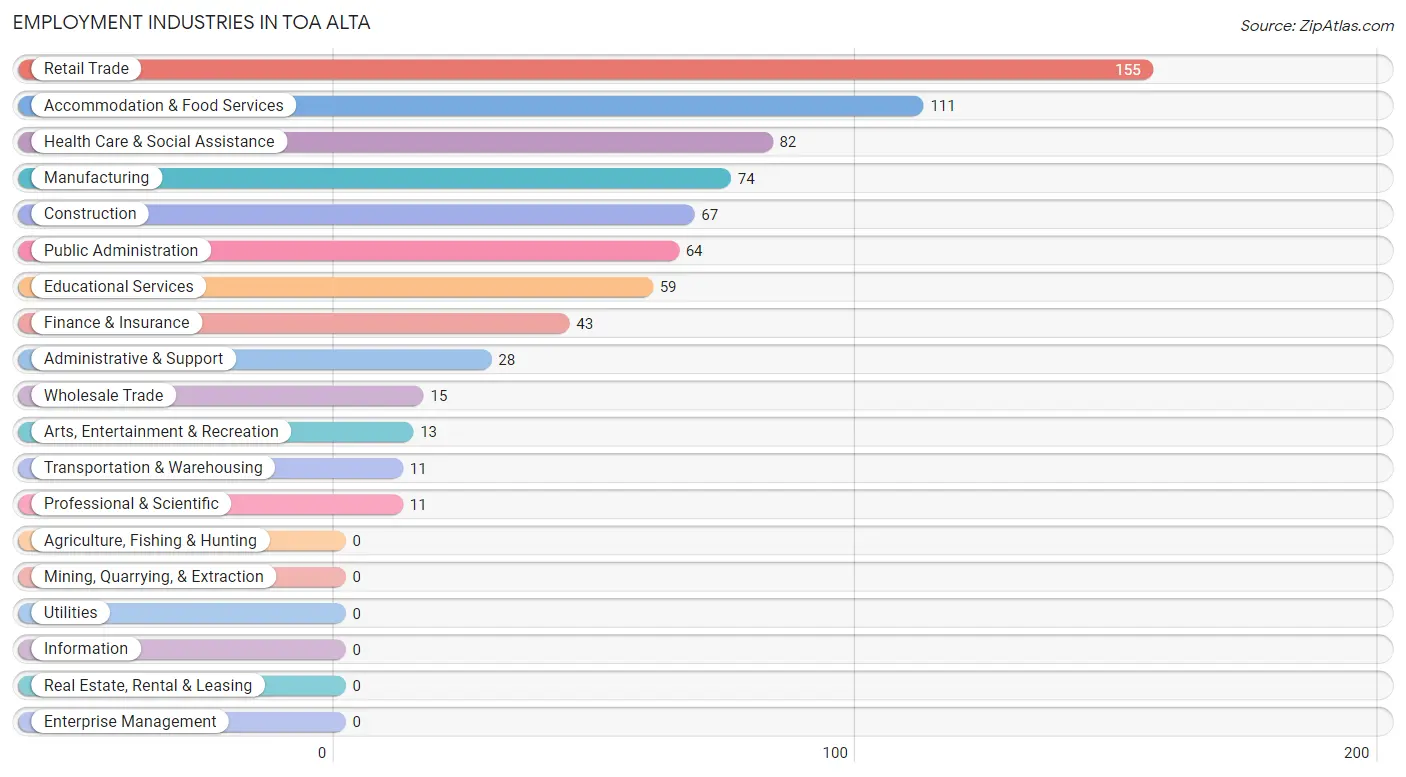
Employment Industries in Toa Alta
The major employment industries in Toa Alta include Retail Trade (155 | 19.6%), Accommodation & Food Services (111 | 14.0%), Health Care & Social Assistance (82 | 10.3%), Manufacturing (74 | 9.3%), and Construction (67 | 8.5%).
Employment Industries by Sex in Toa Alta
The Toa Alta industries that see more men than women are Construction (100.0%), Manufacturing (100.0%), and Wholesale Trade (100.0%), whereas the industries that tend to have a higher number of women are Finance & Insurance (100.0%), Educational Services (100.0%), and Accommodation & Food Services (60.4%).
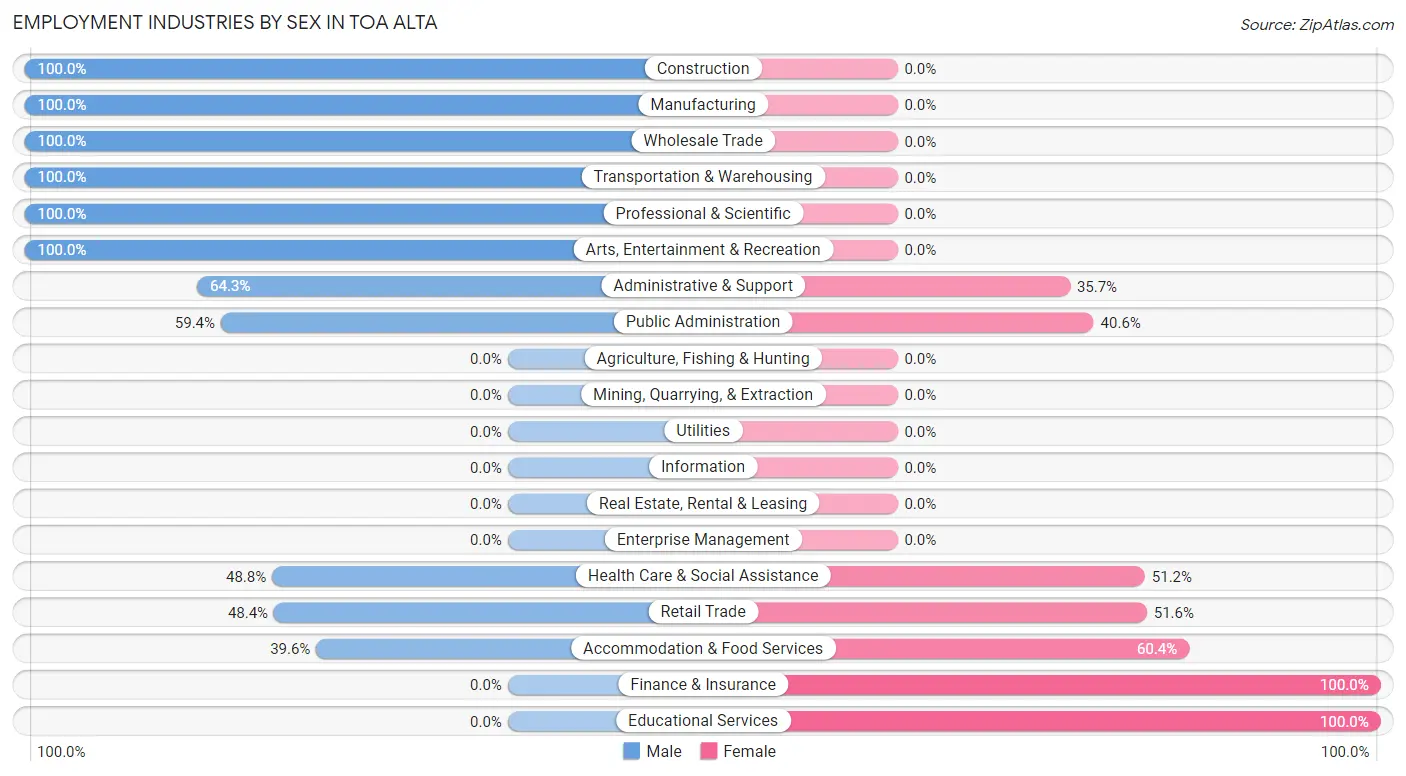
| Industry | Male | Female |
| Agriculture, Fishing & Hunting | 0 (0.0%) | 0 (0.0%) |
| Mining, Quarrying, & Extraction | 0 (0.0%) | 0 (0.0%) |
| Construction | 67 (100.0%) | 0 (0.0%) |
| Manufacturing | 74 (100.0%) | 0 (0.0%) |
| Wholesale Trade | 15 (100.0%) | 0 (0.0%) |
| Retail Trade | 75 (48.4%) | 80 (51.6%) |
| Transportation & Warehousing | 11 (100.0%) | 0 (0.0%) |
| Utilities | 0 (0.0%) | 0 (0.0%) |
| Information | 0 (0.0%) | 0 (0.0%) |
| Finance & Insurance | 0 (0.0%) | 43 (100.0%) |
| Real Estate, Rental & Leasing | 0 (0.0%) | 0 (0.0%) |
| Professional & Scientific | 11 (100.0%) | 0 (0.0%) |
| Enterprise Management | 0 (0.0%) | 0 (0.0%) |
| Administrative & Support | 18 (64.3%) | 10 (35.7%) |
| Educational Services | 0 (0.0%) | 59 (100.0%) |
| Health Care & Social Assistance | 40 (48.8%) | 42 (51.2%) |
| Arts, Entertainment & Recreation | 13 (100.0%) | 0 (0.0%) |
| Accommodation & Food Services | 44 (39.6%) | 67 (60.4%) |
| Public Administration | 38 (59.4%) | 26 (40.6%) |
| Total | 465 (58.7%) | 327 (41.3%) |
Education in Toa Alta
School Enrollment in Toa Alta
The most common levels of schooling among the 411 students in Toa Alta are elementary school (155 | 37.7%), high school (91 | 22.1%), and middle school (90 | 21.9%).
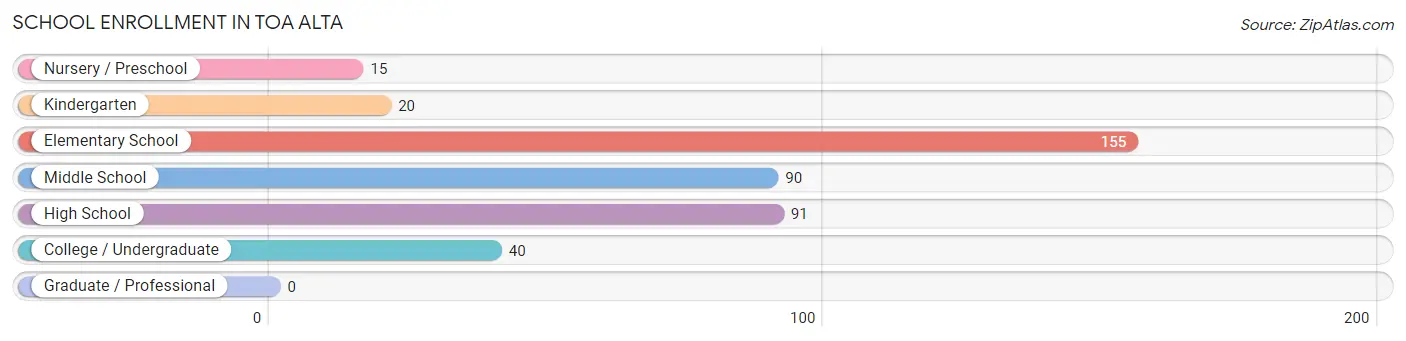
| School Level | # Students | % Students |
| Nursery / Preschool | 15 | 3.6% |
| Kindergarten | 20 | 4.9% |
| Elementary School | 155 | 37.7% |
| Middle School | 90 | 21.9% |
| High School | 91 | 22.1% |
| College / Undergraduate | 40 | 9.7% |
| Graduate / Professional | 0 | 0.0% |
| Total | 411 | 100.0% |
School Enrollment by Age by Funding Source in Toa Alta
Out of a total of 411 students who are enrolled in schools in Toa Alta, 85 (20.7%) attend a private institution, while the remaining 326 (79.3%) are enrolled in public schools. The age group of 5 to 9 year old has the highest likelihood of being enrolled in private schools, with 39 (28.7% in the age bracket) enrolled. Conversely, the age group of 3 to 4 year olds has the lowest likelihood of being enrolled in a private school, with 15 (100.0% in the age bracket) attending a public institution.
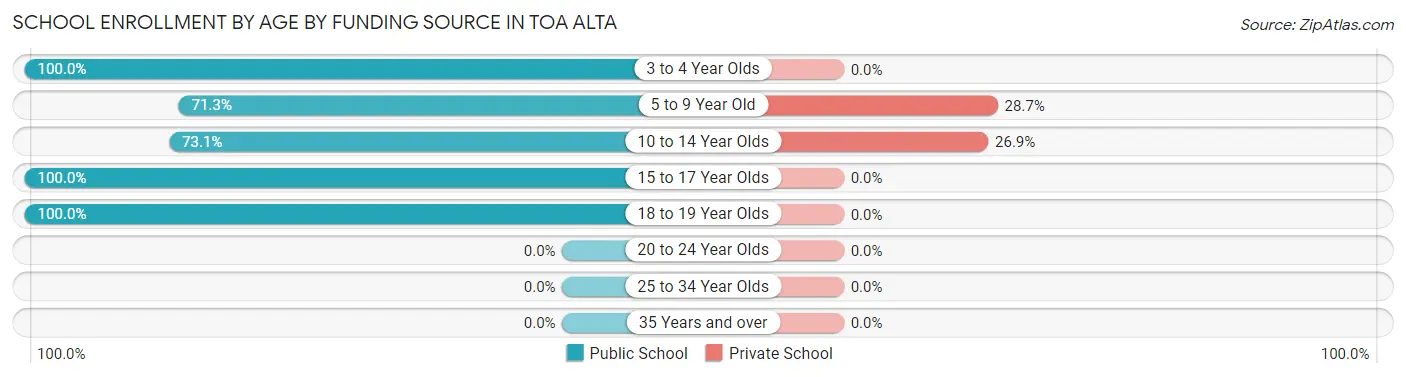
| Age Bracket | Public School | Private School |
| 3 to 4 Year Olds | 15 (100.0%) | 0 (0.0%) |
| 5 to 9 Year Old | 97 (71.3%) | 39 (28.7%) |
| 10 to 14 Year Olds | 125 (73.1%) | 46 (26.9%) |
| 15 to 17 Year Olds | 49 (100.0%) | 0 (0.0%) |
| 18 to 19 Year Olds | 40 (100.0%) | 0 (0.0%) |
| 20 to 24 Year Olds | 0 (0.0%) | 0 (0.0%) |
| 25 to 34 Year Olds | 0 (0.0%) | 0 (0.0%) |
| 35 Years and over | 0 (0.0%) | 0 (0.0%) |
| Total | 326 (79.3%) | 85 (20.7%) |
Educational Attainment by Field of Study in Toa Alta
Education (128 | 32.5%), arts & humanities (60 | 15.2%), business (50 | 12.7%), social sciences (47 | 11.9%), and visual & performing arts (24 | 6.1%) are the most common fields of study among 394 individuals in Toa Alta who have obtained a bachelor's degree or higher.
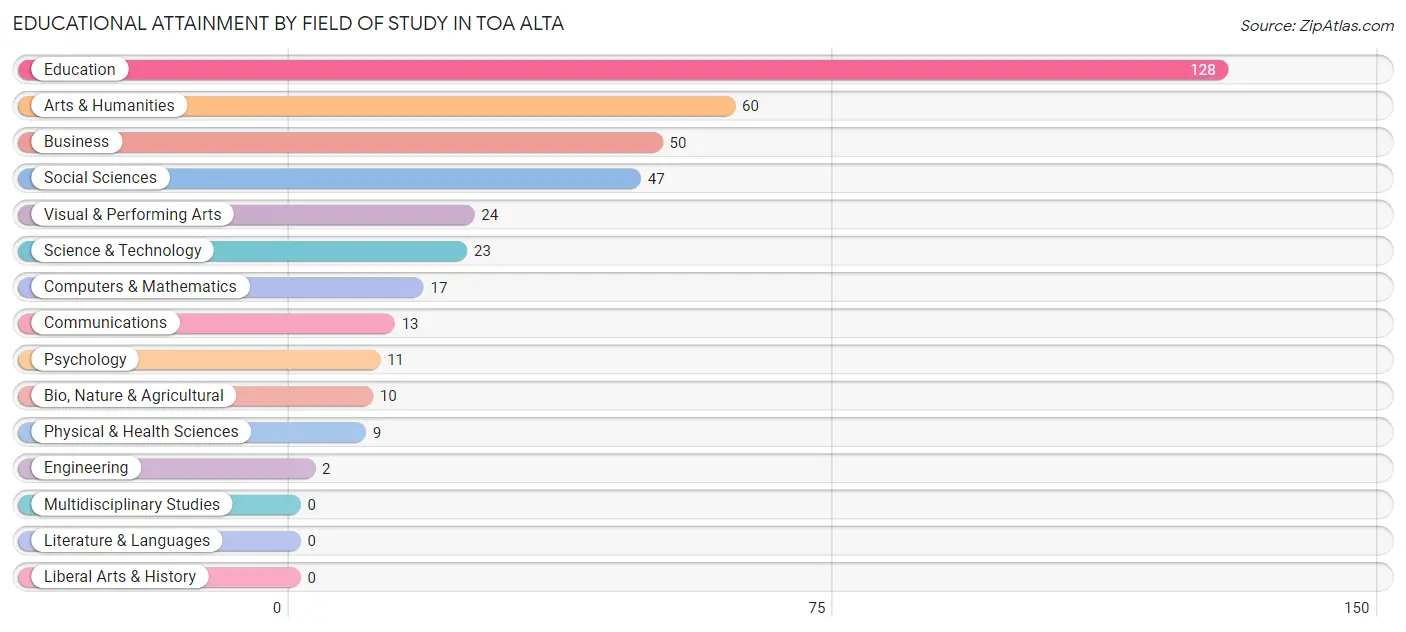
| Field of Study | # Graduates | % Graduates |
| Computers & Mathematics | 17 | 4.3% |
| Bio, Nature & Agricultural | 10 | 2.5% |
| Physical & Health Sciences | 9 | 2.3% |
| Psychology | 11 | 2.8% |
| Social Sciences | 47 | 11.9% |
| Engineering | 2 | 0.5% |
| Multidisciplinary Studies | 0 | 0.0% |
| Science & Technology | 23 | 5.8% |
| Business | 50 | 12.7% |
| Education | 128 | 32.5% |
| Literature & Languages | 0 | 0.0% |
| Liberal Arts & History | 0 | 0.0% |
| Visual & Performing Arts | 24 | 6.1% |
| Communications | 13 | 3.3% |
| Arts & Humanities | 60 | 15.2% |
| Total | 394 | 100.0% |
Transportation & Commute in Toa Alta
Vehicle Availability by Sex in Toa Alta
The most prevalent vehicle ownership categories in Toa Alta are males with 2 vehicles (239, accounting for 55.6%) and females with 2 vehicles (109, making up 73.1%).
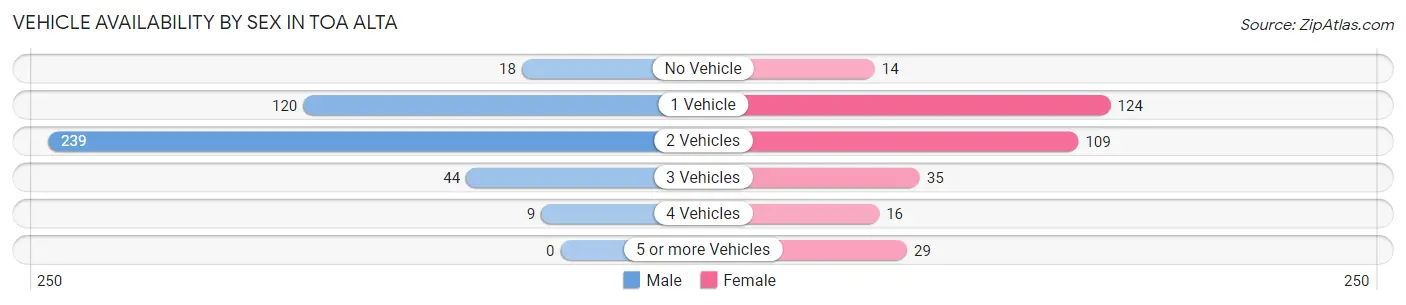
| Vehicles Available | Male | Female |
| No Vehicle | 18 (4.2%) | 14 (4.3%) |
| 1 Vehicle | 120 (27.9%) | 124 (37.9%) |
| 2 Vehicles | 239 (55.6%) | 109 (33.3%) |
| 3 Vehicles | 44 (10.2%) | 35 (10.7%) |
| 4 Vehicles | 9 (2.1%) | 16 (4.9%) |
| 5 or more Vehicles | 0 (0.0%) | 29 (8.9%) |
| Total | 430 (100.0%) | 327 (100.0%) |
Commute Time in Toa Alta
The most frequently occuring commute durations in Toa Alta are 30 to 34 minutes (167 commuters, 23.1%), 60 to 89 minutes (95 commuters, 13.1%), and 45 to 59 minutes (93 commuters, 12.9%).
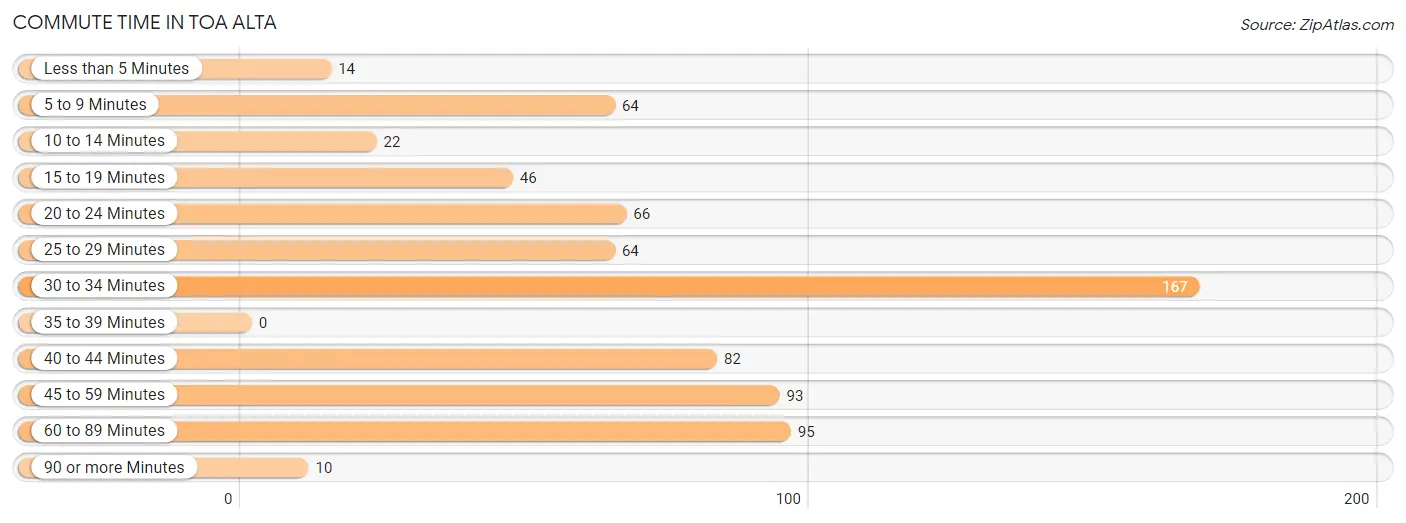
| Commute Time | # Commuters | % Commuters |
| Less than 5 Minutes | 14 | 1.9% |
| 5 to 9 Minutes | 64 | 8.8% |
| 10 to 14 Minutes | 22 | 3.0% |
| 15 to 19 Minutes | 46 | 6.4% |
| 20 to 24 Minutes | 66 | 9.1% |
| 25 to 29 Minutes | 64 | 8.8% |
| 30 to 34 Minutes | 167 | 23.1% |
| 35 to 39 Minutes | 0 | 0.0% |
| 40 to 44 Minutes | 82 | 11.3% |
| 45 to 59 Minutes | 93 | 12.9% |
| 60 to 89 Minutes | 95 | 13.1% |
| 90 or more Minutes | 10 | 1.4% |
Commute Time by Sex in Toa Alta
The most common commute times in Toa Alta are 30 to 34 minutes (91 commuters, 21.9%) for males and 30 to 34 minutes (76 commuters, 24.8%) for females.
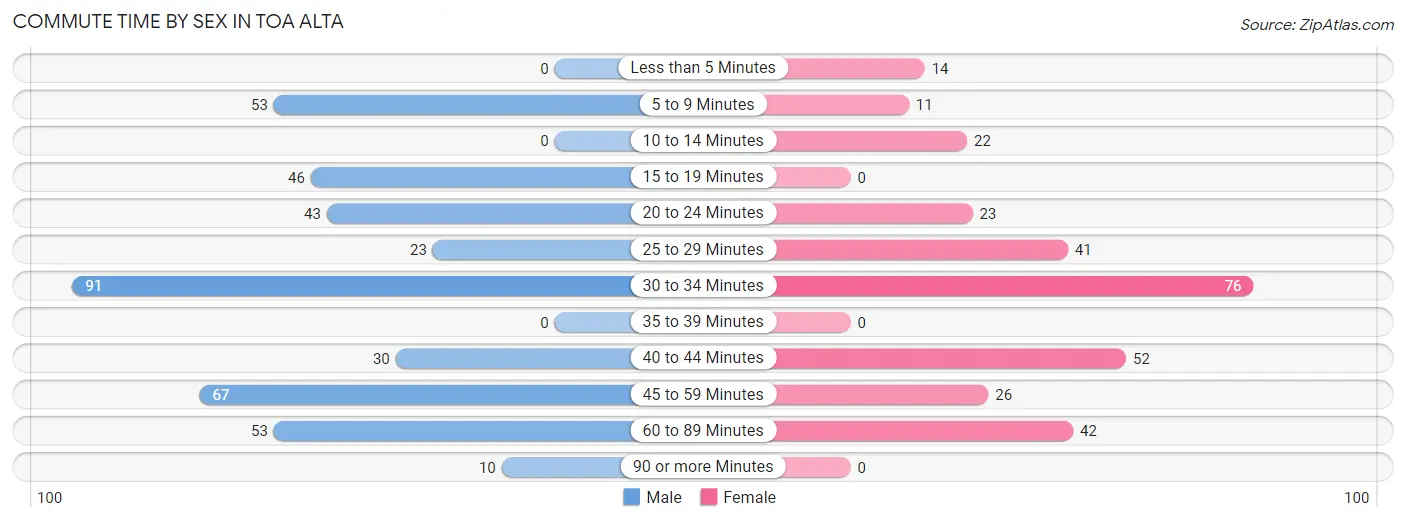
| Commute Time | Male | Female |
| Less than 5 Minutes | 0 (0.0%) | 14 (4.6%) |
| 5 to 9 Minutes | 53 (12.7%) | 11 (3.6%) |
| 10 to 14 Minutes | 0 (0.0%) | 22 (7.2%) |
| 15 to 19 Minutes | 46 (11.1%) | 0 (0.0%) |
| 20 to 24 Minutes | 43 (10.3%) | 23 (7.5%) |
| 25 to 29 Minutes | 23 (5.5%) | 41 (13.4%) |
| 30 to 34 Minutes | 91 (21.9%) | 76 (24.8%) |
| 35 to 39 Minutes | 0 (0.0%) | 0 (0.0%) |
| 40 to 44 Minutes | 30 (7.2%) | 52 (16.9%) |
| 45 to 59 Minutes | 67 (16.1%) | 26 (8.5%) |
| 60 to 89 Minutes | 53 (12.7%) | 42 (13.7%) |
| 90 or more Minutes | 10 (2.4%) | 0 (0.0%) |
Time of Departure to Work by Sex in Toa Alta
The most frequent times of departure to work in Toa Alta are 8:00 AM to 8:29 AM (83, 20.0%) for males and 6:00 AM to 6:29 AM (94, 30.6%) for females.
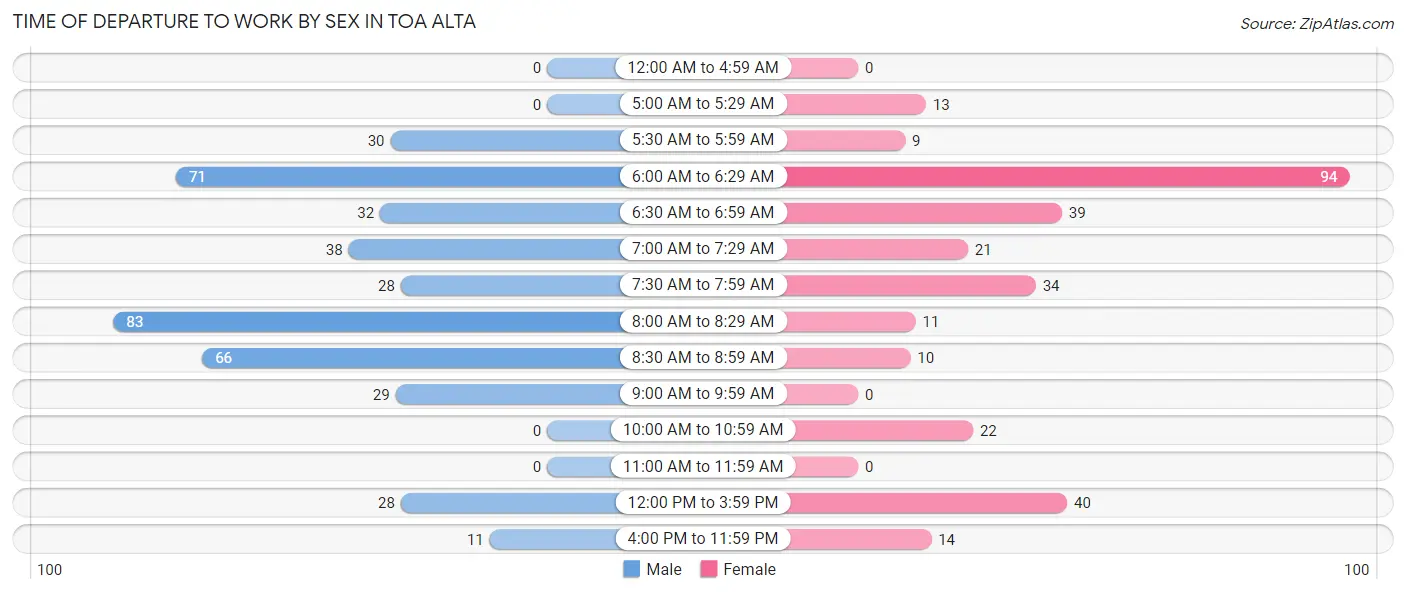
| Time of Departure | Male | Female |
| 12:00 AM to 4:59 AM | 0 (0.0%) | 0 (0.0%) |
| 5:00 AM to 5:29 AM | 0 (0.0%) | 13 (4.2%) |
| 5:30 AM to 5:59 AM | 30 (7.2%) | 9 (2.9%) |
| 6:00 AM to 6:29 AM | 71 (17.1%) | 94 (30.6%) |
| 6:30 AM to 6:59 AM | 32 (7.7%) | 39 (12.7%) |
| 7:00 AM to 7:29 AM | 38 (9.1%) | 21 (6.8%) |
| 7:30 AM to 7:59 AM | 28 (6.7%) | 34 (11.1%) |
| 8:00 AM to 8:29 AM | 83 (20.0%) | 11 (3.6%) |
| 8:30 AM to 8:59 AM | 66 (15.9%) | 10 (3.3%) |
| 9:00 AM to 9:59 AM | 29 (7.0%) | 0 (0.0%) |
| 10:00 AM to 10:59 AM | 0 (0.0%) | 22 (7.2%) |
| 11:00 AM to 11:59 AM | 0 (0.0%) | 0 (0.0%) |
| 12:00 PM to 3:59 PM | 28 (6.7%) | 40 (13.0%) |
| 4:00 PM to 11:59 PM | 11 (2.6%) | 14 (4.6%) |
| Total | 416 (100.0%) | 307 (100.0%) |
Housing Occupancy in Toa Alta
Occupancy by Ownership in Toa Alta
Of the total 1,341 dwellings in Toa Alta, owner-occupied units account for 776 (57.9%), while renter-occupied units make up 565 (42.1%).
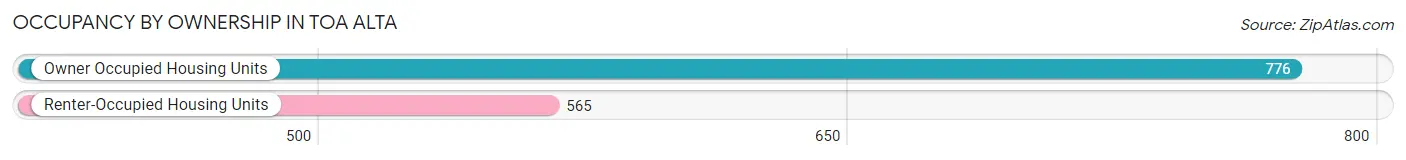
| Occupancy | # Housing Units | % Housing Units |
| Owner Occupied Housing Units | 776 | 57.9% |
| Renter-Occupied Housing Units | 565 | 42.1% |
| Total Occupied Housing Units | 1,341 | 100.0% |
Occupancy by Household Size in Toa Alta
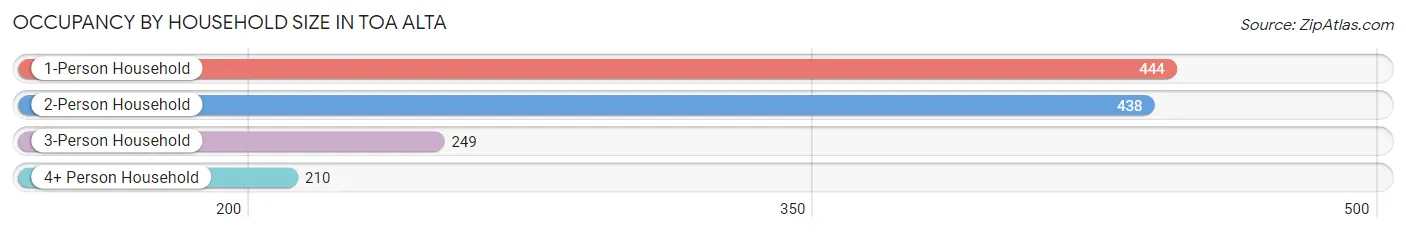
| Household Size | # Housing Units | % Housing Units |
| 1-Person Household | 444 | 33.1% |
| 2-Person Household | 438 | 32.7% |
| 3-Person Household | 249 | 18.6% |
| 4+ Person Household | 210 | 15.7% |
| Total Housing Units | 1,341 | 100.0% |
Occupancy by Ownership by Household Size in Toa Alta
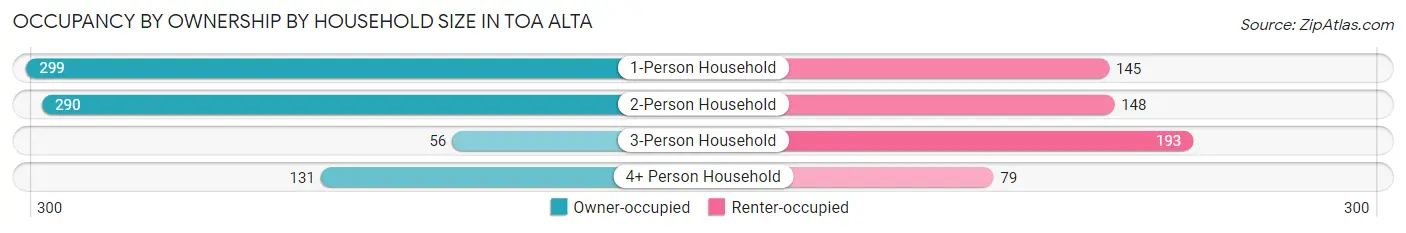
| Household Size | Owner-occupied | Renter-occupied |
| 1-Person Household | 299 (67.3%) | 145 (32.7%) |
| 2-Person Household | 290 (66.2%) | 148 (33.8%) |
| 3-Person Household | 56 (22.5%) | 193 (77.5%) |
| 4+ Person Household | 131 (62.4%) | 79 (37.6%) |
| Total Housing Units | 776 (57.9%) | 565 (42.1%) |
Occupancy by Educational Attainment in Toa Alta
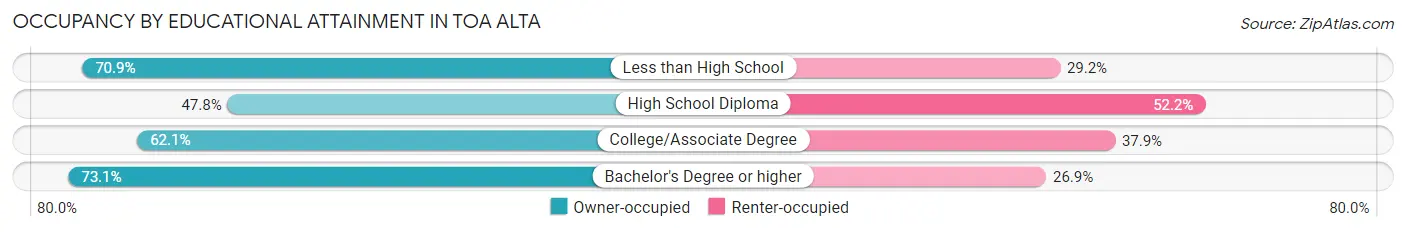
| Household Size | Owner-occupied | Renter-occupied |
| Less than High School | 141 (70.9%) | 58 (29.1%) |
| High School Diploma | 329 (47.8%) | 359 (52.2%) |
| College/Associate Degree | 146 (62.1%) | 89 (37.9%) |
| Bachelor's Degree or higher | 160 (73.1%) | 59 (26.9%) |
Occupancy by Age of Householder in Toa Alta
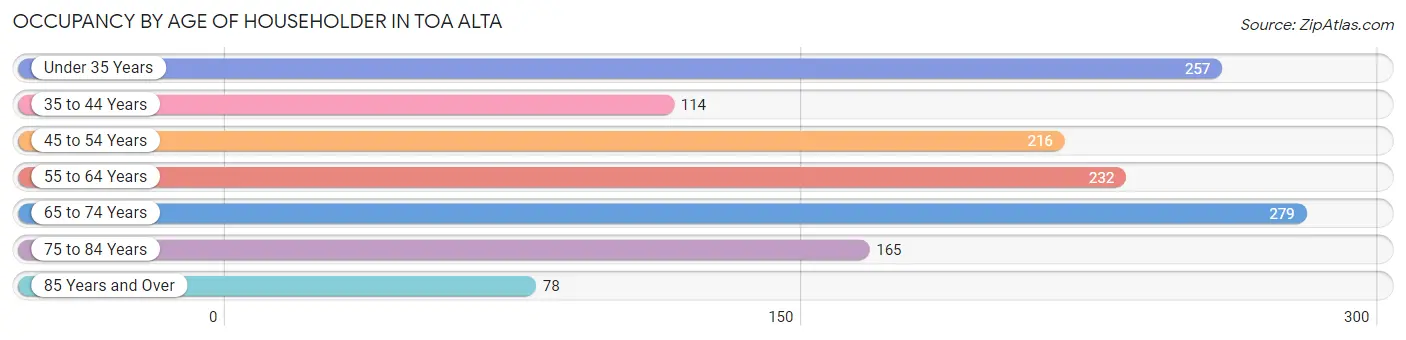
| Age Bracket | # Households | % Households |
| Under 35 Years | 257 | 19.2% |
| 35 to 44 Years | 114 | 8.5% |
| 45 to 54 Years | 216 | 16.1% |
| 55 to 64 Years | 232 | 17.3% |
| 65 to 74 Years | 279 | 20.8% |
| 75 to 84 Years | 165 | 12.3% |
| 85 Years and Over | 78 | 5.8% |
| Total | 1,341 | 100.0% |
Housing Finances in Toa Alta
Median Income by Occupancy in Toa Alta
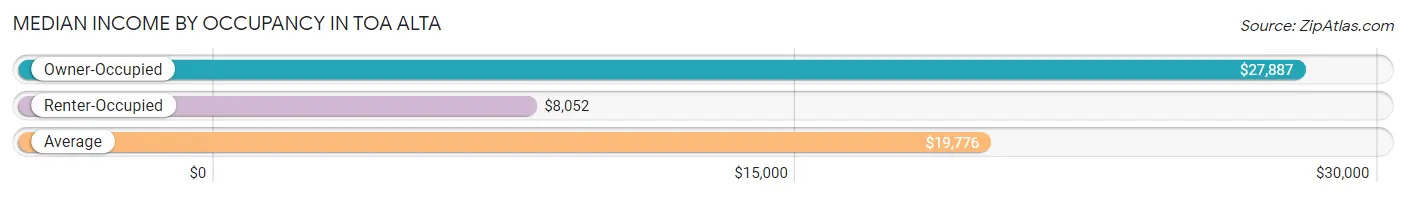
| Occupancy Type | # Households | Median Income |
| Owner-Occupied | 776 (57.9%) | $27,887 |
| Renter-Occupied | 565 (42.1%) | $8,052 |
| Average | 1,341 (100.0%) | $19,776 |
Occupancy by Householder Income Bracket in Toa Alta
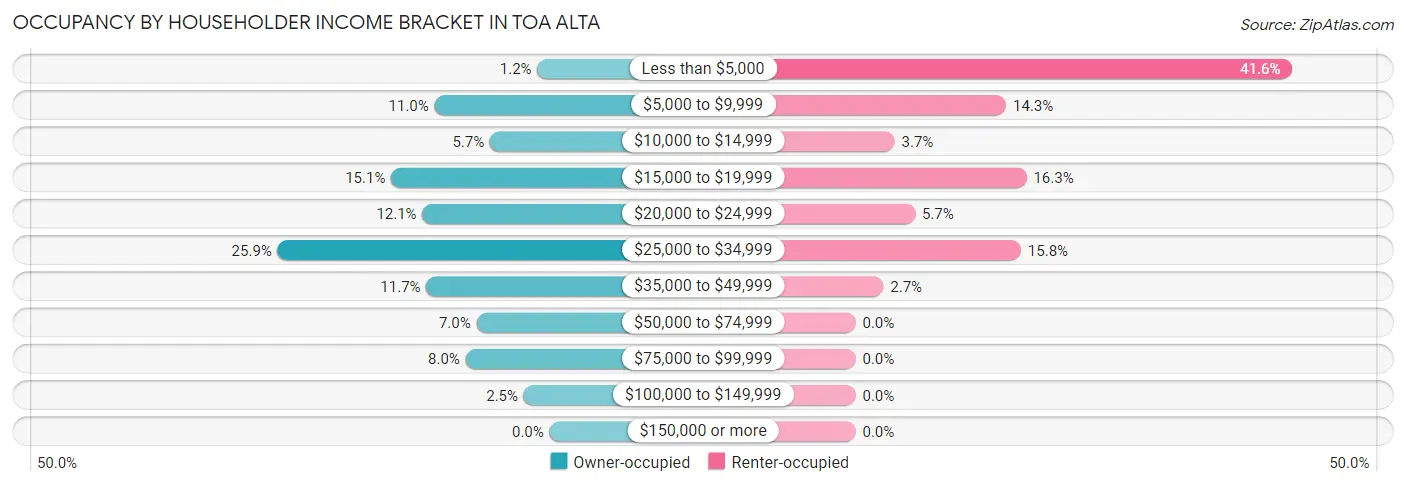
| Income Bracket | Owner-occupied | Renter-occupied |
| Less than $5,000 | 9 (1.2%) | 235 (41.6%) |
| $5,000 to $9,999 | 85 (11.0%) | 81 (14.3%) |
| $10,000 to $14,999 | 44 (5.7%) | 21 (3.7%) |
| $15,000 to $19,999 | 117 (15.1%) | 92 (16.3%) |
| $20,000 to $24,999 | 94 (12.1%) | 32 (5.7%) |
| $25,000 to $34,999 | 201 (25.9%) | 89 (15.8%) |
| $35,000 to $49,999 | 91 (11.7%) | 15 (2.6%) |
| $50,000 to $74,999 | 54 (7.0%) | 0 (0.0%) |
| $75,000 to $99,999 | 62 (8.0%) | 0 (0.0%) |
| $100,000 to $149,999 | 19 (2.5%) | 0 (0.0%) |
| $150,000 or more | 0 (0.0%) | 0 (0.0%) |
| Total | 776 (100.0%) | 565 (100.0%) |
Monthly Housing Cost Tiers in Toa Alta
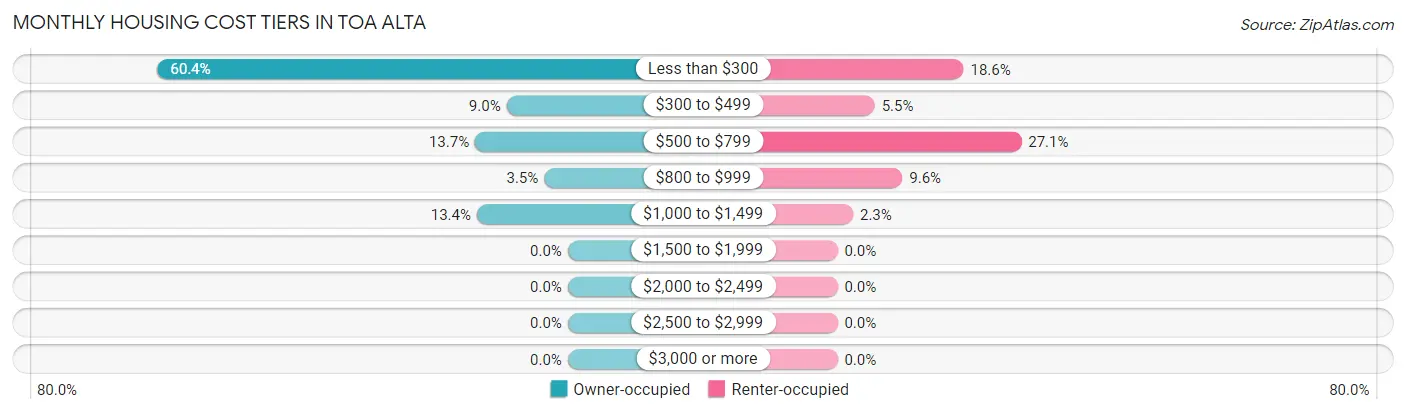
| Monthly Cost | Owner-occupied | Renter-occupied |
| Less than $300 | 469 (60.4%) | 105 (18.6%) |
| $300 to $499 | 70 (9.0%) | 31 (5.5%) |
| $500 to $799 | 106 (13.7%) | 153 (27.1%) |
| $800 to $999 | 27 (3.5%) | 54 (9.6%) |
| $1,000 to $1,499 | 104 (13.4%) | 13 (2.3%) |
| $1,500 to $1,999 | 0 (0.0%) | 0 (0.0%) |
| $2,000 to $2,499 | 0 (0.0%) | 0 (0.0%) |
| $2,500 to $2,999 | 0 (0.0%) | 0 (0.0%) |
| $3,000 or more | 0 (0.0%) | 0 (0.0%) |
| Total | 776 (100.0%) | 565 (100.0%) |
Physical Housing Characteristics in Toa Alta
Housing Structures in Toa Alta
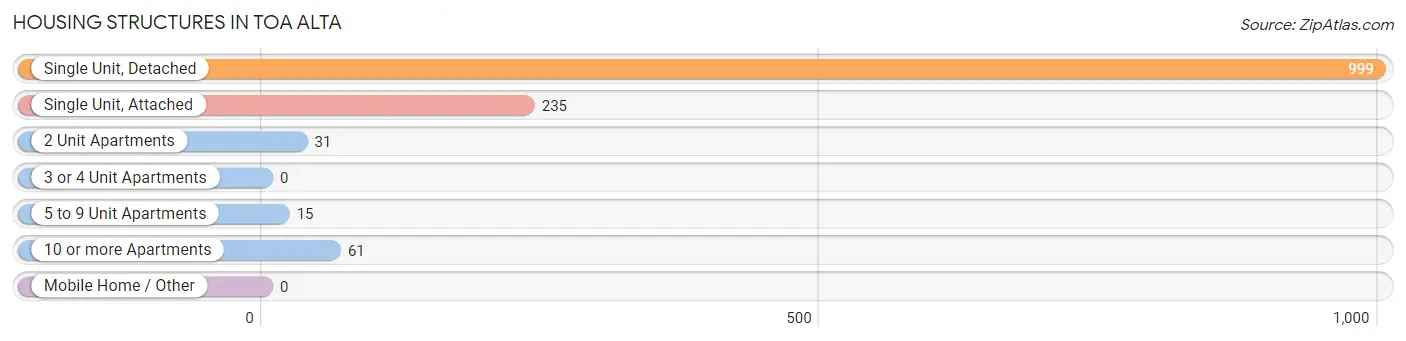
| Structure Type | # Housing Units | % Housing Units |
| Single Unit, Detached | 999 | 74.5% |
| Single Unit, Attached | 235 | 17.5% |
| 2 Unit Apartments | 31 | 2.3% |
| 3 or 4 Unit Apartments | 0 | 0.0% |
| 5 to 9 Unit Apartments | 15 | 1.1% |
| 10 or more Apartments | 61 | 4.5% |
| Mobile Home / Other | 0 | 0.0% |
| Total | 1,341 | 100.0% |
Housing Structures by Occupancy in Toa Alta
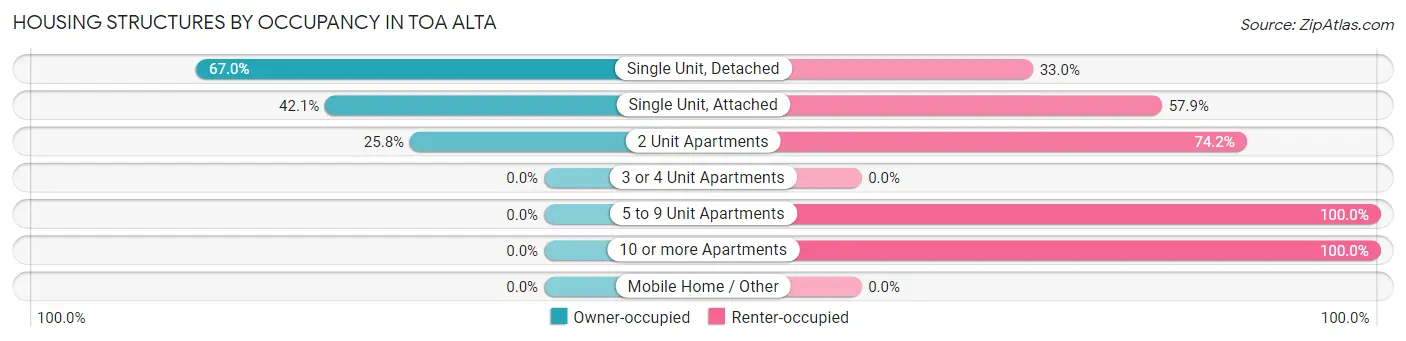
| Structure Type | Owner-occupied | Renter-occupied |
| Single Unit, Detached | 669 (67.0%) | 330 (33.0%) |
| Single Unit, Attached | 99 (42.1%) | 136 (57.9%) |
| 2 Unit Apartments | 8 (25.8%) | 23 (74.2%) |
| 3 or 4 Unit Apartments | 0 (0.0%) | 0 (0.0%) |
| 5 to 9 Unit Apartments | 0 (0.0%) | 15 (100.0%) |
| 10 or more Apartments | 0 (0.0%) | 61 (100.0%) |
| Mobile Home / Other | 0 (0.0%) | 0 (0.0%) |
| Total | 776 (57.9%) | 565 (42.1%) |
Housing Structures by Number of Rooms in Toa Alta
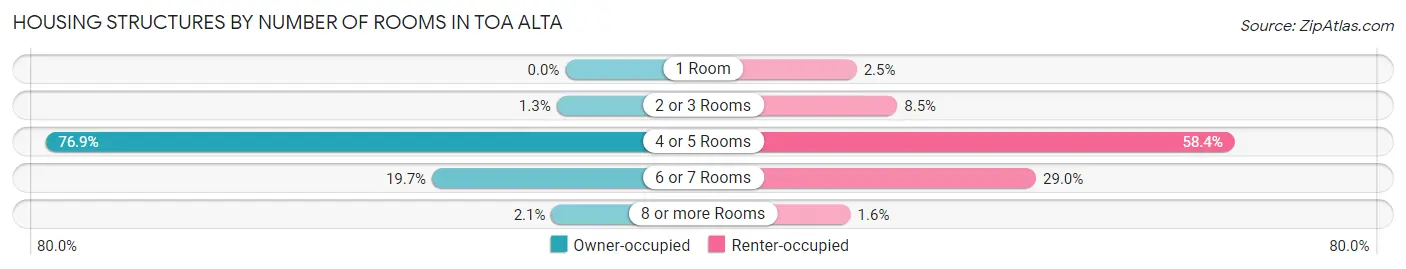
| Number of Rooms | Owner-occupied | Renter-occupied |
| 1 Room | 0 (0.0%) | 14 (2.5%) |
| 2 or 3 Rooms | 10 (1.3%) | 48 (8.5%) |
| 4 or 5 Rooms | 597 (76.9%) | 330 (58.4%) |
| 6 or 7 Rooms | 153 (19.7%) | 164 (29.0%) |
| 8 or more Rooms | 16 (2.1%) | 9 (1.6%) |
| Total | 776 (100.0%) | 565 (100.0%) |
Housing Structure by Heating Type in Toa Alta
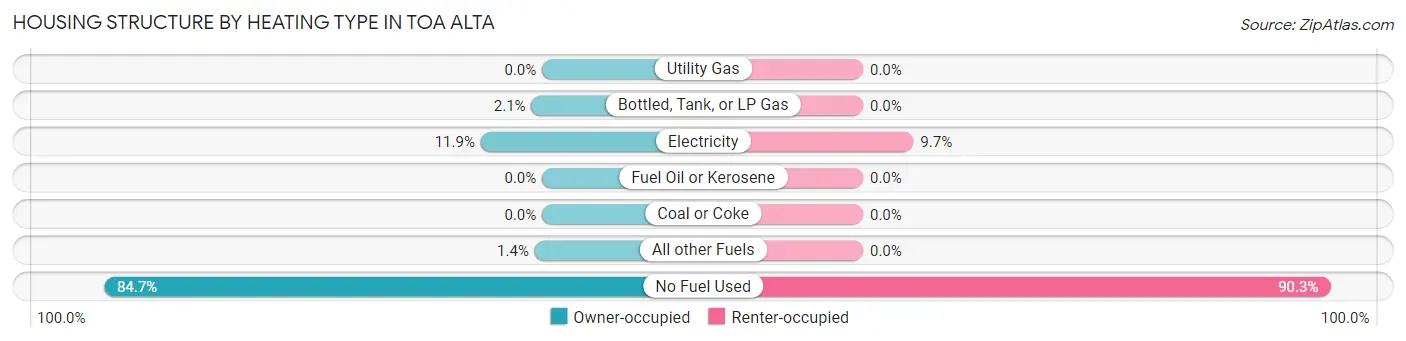
| Heating Type | Owner-occupied | Renter-occupied |
| Utility Gas | 0 (0.0%) | 0 (0.0%) |
| Bottled, Tank, or LP Gas | 16 (2.1%) | 0 (0.0%) |
| Electricity | 92 (11.9%) | 55 (9.7%) |
| Fuel Oil or Kerosene | 0 (0.0%) | 0 (0.0%) |
| Coal or Coke | 0 (0.0%) | 0 (0.0%) |
| All other Fuels | 11 (1.4%) | 0 (0.0%) |
| No Fuel Used | 657 (84.7%) | 510 (90.3%) |
| Total | 776 (100.0%) | 565 (100.0%) |
Household Vehicle Usage in Toa Alta
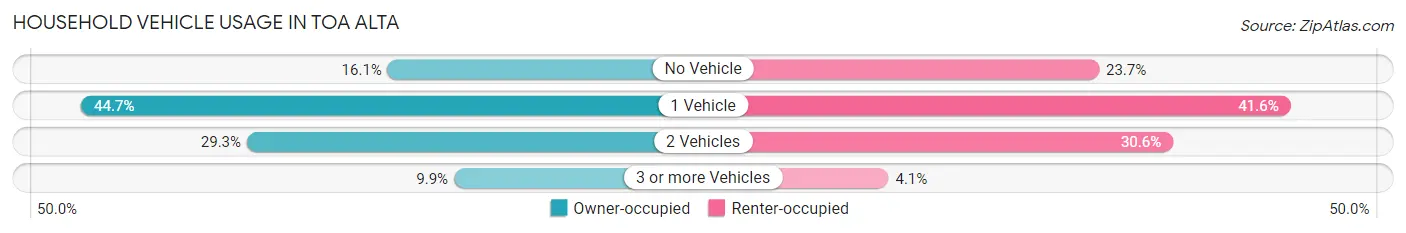
| Vehicles per Household | Owner-occupied | Renter-occupied |
| No Vehicle | 125 (16.1%) | 134 (23.7%) |
| 1 Vehicle | 347 (44.7%) | 235 (41.6%) |
| 2 Vehicles | 227 (29.2%) | 173 (30.6%) |
| 3 or more Vehicles | 77 (9.9%) | 23 (4.1%) |
| Total | 776 (100.0%) | 565 (100.0%) |
Real Estate & Mortgages in Toa Alta
Real Estate and Mortgage Overview in Toa Alta
| Characteristic | Without Mortgage | With Mortgage |
| Housing Units | 546 | 230 |
| Median Property Value | $107,800 | $134,500 |
| Median Household Income | $28,160 | $0 |
| Monthly Housing Costs | $185 | $0 |
| Real Estate Taxes | - | - |
Property Value by Mortgage Status in Toa Alta
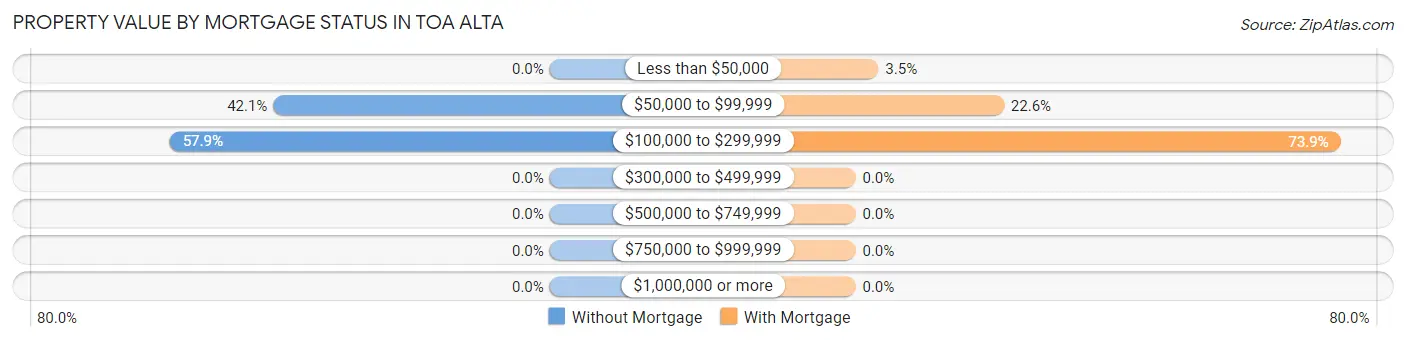
| Property Value | Without Mortgage | With Mortgage |
| Less than $50,000 | 0 (0.0%) | 8 (3.5%) |
| $50,000 to $99,999 | 230 (42.1%) | 52 (22.6%) |
| $100,000 to $299,999 | 316 (57.9%) | 170 (73.9%) |
| $300,000 to $499,999 | 0 (0.0%) | 0 (0.0%) |
| $500,000 to $749,999 | 0 (0.0%) | 0 (0.0%) |
| $750,000 to $999,999 | 0 (0.0%) | 0 (0.0%) |
| $1,000,000 or more | 0 (0.0%) | 0 (0.0%) |
| Total | 546 (100.0%) | 230 (100.0%) |
Household Income by Mortgage Status in Toa Alta
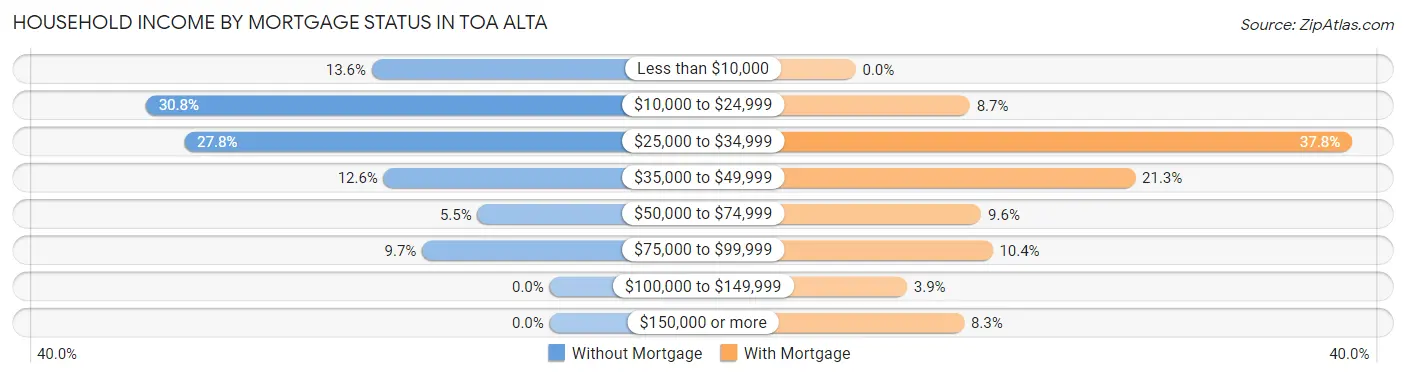
| Household Income | Without Mortgage | With Mortgage |
| Less than $10,000 | 74 (13.6%) | 0 (0.0%) |
| $10,000 to $24,999 | 168 (30.8%) | 20 (8.7%) |
| $25,000 to $34,999 | 152 (27.8%) | 87 (37.8%) |
| $35,000 to $49,999 | 69 (12.6%) | 49 (21.3%) |
| $50,000 to $74,999 | 30 (5.5%) | 22 (9.6%) |
| $75,000 to $99,999 | 53 (9.7%) | 24 (10.4%) |
| $100,000 to $149,999 | 0 (0.0%) | 9 (3.9%) |
| $150,000 or more | 0 (0.0%) | 19 (8.3%) |
| Total | 546 (100.0%) | 230 (100.0%) |
Property Value to Household Income Ratio in Toa Alta
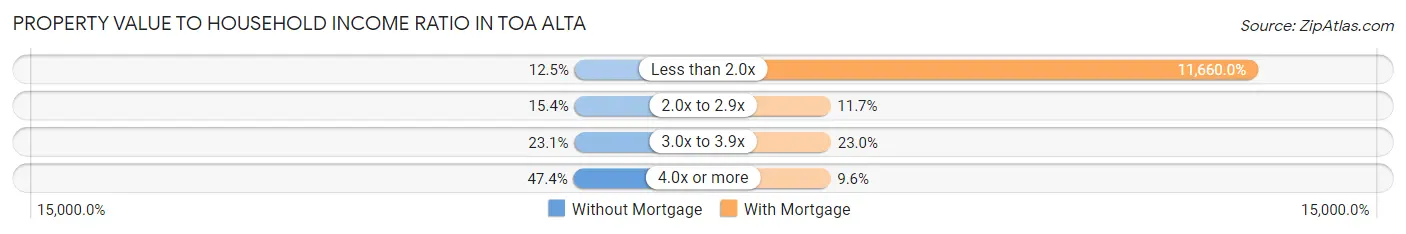
| Value-to-Income Ratio | Without Mortgage | With Mortgage |
| Less than 2.0x | 68 (12.4%) | 26,818 (11,660.0%) |
| 2.0x to 2.9x | 84 (15.4%) | 27 (11.7%) |
| 3.0x to 3.9x | 126 (23.1%) | 53 (23.0%) |
| 4.0x or more | 259 (47.4%) | 22 (9.6%) |
| Total | 546 (100.0%) | 230 (100.0%) |
Real Estate Taxes by Mortgage Status in Toa Alta
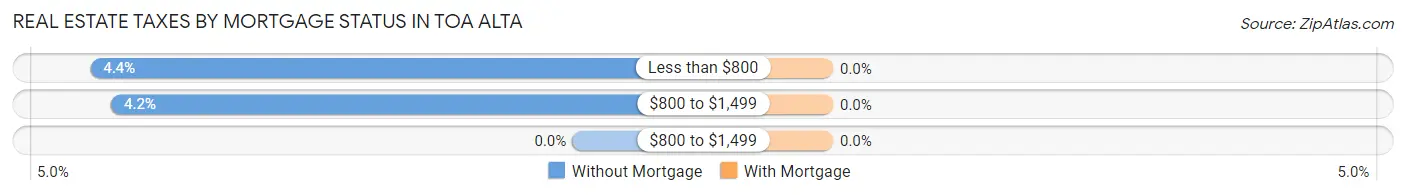
| Property Taxes | Without Mortgage | With Mortgage |
| Less than $800 | 24 (4.4%) | 0 (0.0%) |
| $800 to $1,499 | 23 (4.2%) | 0 (0.0%) |
| $800 to $1,499 | 0 (0.0%) | 0 (0.0%) |
| Total | 546 (100.0%) | 230 (100.0%) |
Health & Disability in Toa Alta
Health Insurance Coverage by Age in Toa Alta
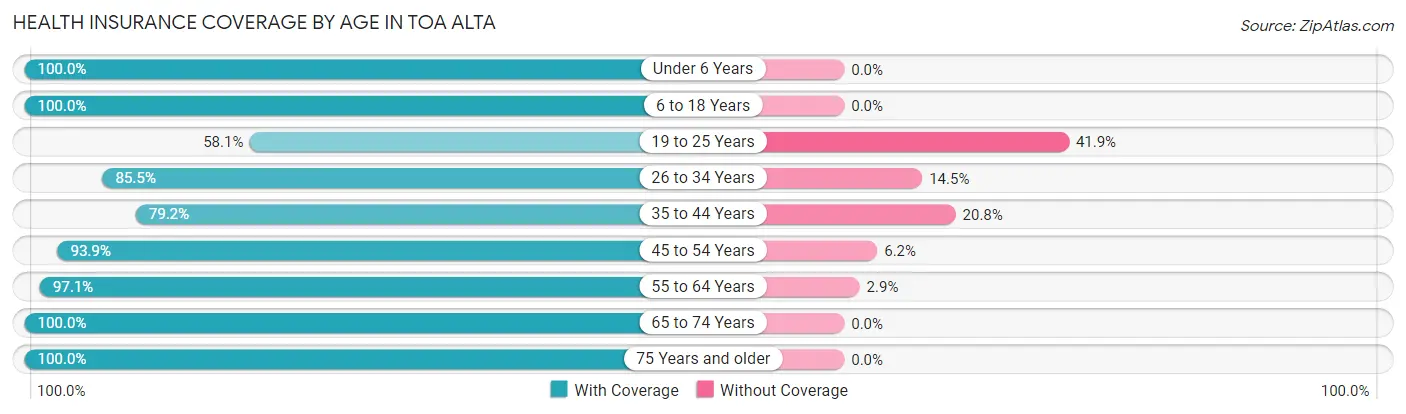
| Age Bracket | With Coverage | Without Coverage |
| Under 6 Years | 224 (100.0%) | 0 (0.0%) |
| 6 to 18 Years | 427 (100.0%) | 0 (0.0%) |
| 19 to 25 Years | 86 (58.1%) | 62 (41.9%) |
| 26 to 34 Years | 400 (85.5%) | 68 (14.5%) |
| 35 to 44 Years | 229 (79.2%) | 60 (20.8%) |
| 45 to 54 Years | 519 (93.9%) | 34 (6.1%) |
| 55 to 64 Years | 407 (97.1%) | 12 (2.9%) |
| 65 to 74 Years | 370 (100.0%) | 0 (0.0%) |
| 75 Years and older | 349 (100.0%) | 0 (0.0%) |
| Total | 3,011 (92.7%) | 236 (7.3%) |
Health Insurance Coverage by Citizenship Status in Toa Alta
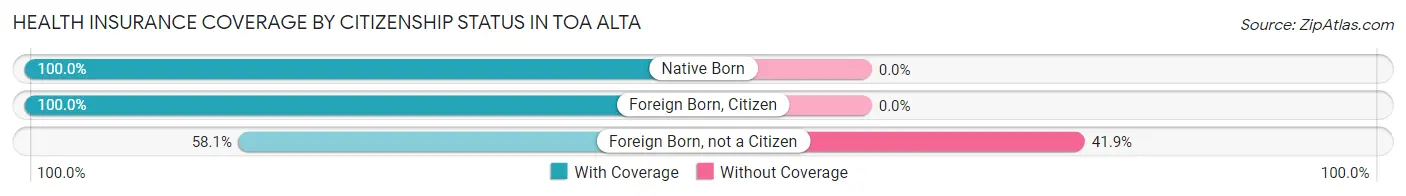
| Citizenship Status | With Coverage | Without Coverage |
| Native Born | 224 (100.0%) | 0 (0.0%) |
| Foreign Born, Citizen | 427 (100.0%) | 0 (0.0%) |
| Foreign Born, not a Citizen | 86 (58.1%) | 62 (41.9%) |
Health Insurance Coverage by Household Income in Toa Alta
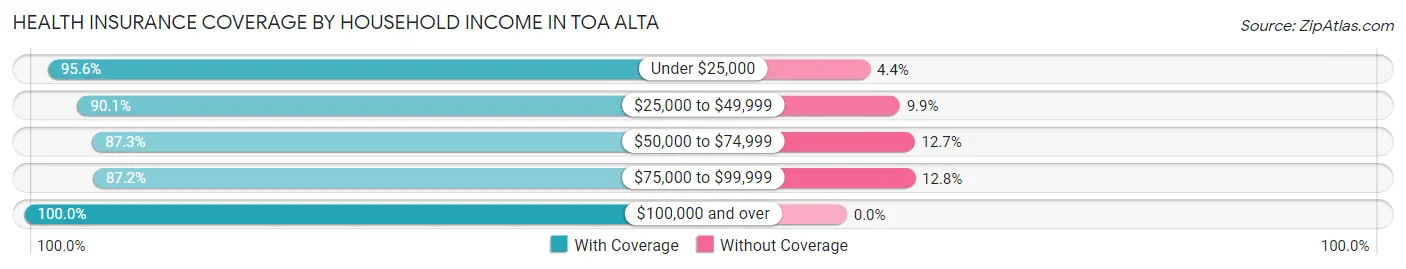
| Household Income | With Coverage | Without Coverage |
| Under $25,000 | 1,575 (95.6%) | 72 (4.4%) |
| $25,000 to $49,999 | 982 (90.1%) | 108 (9.9%) |
| $50,000 to $74,999 | 165 (87.3%) | 24 (12.7%) |
| $75,000 to $99,999 | 218 (87.2%) | 32 (12.8%) |
| $100,000 and over | 68 (100.0%) | 0 (0.0%) |
Public vs Private Health Insurance Coverage by Age in Toa Alta
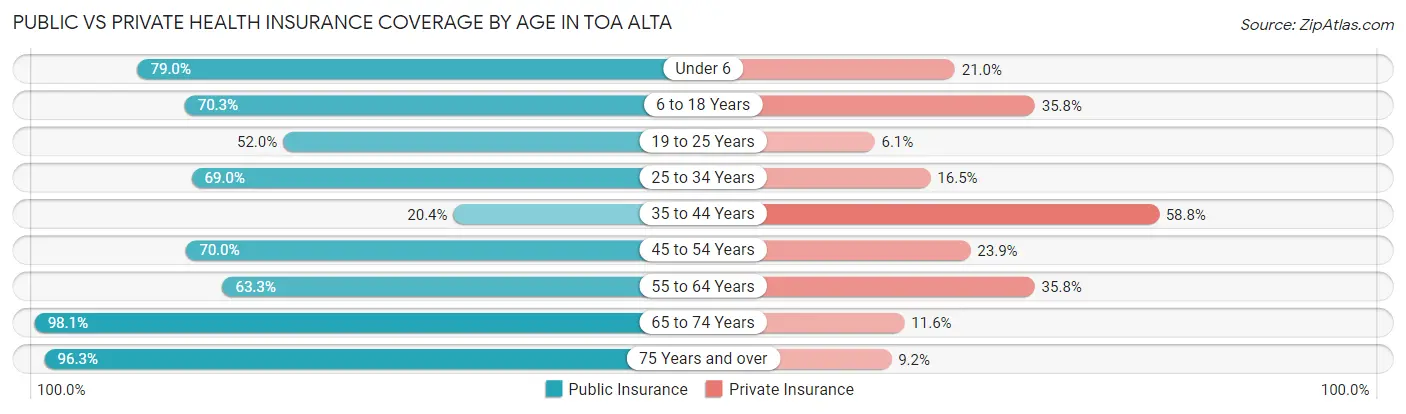
| Age Bracket | Public Insurance | Private Insurance |
| Under 6 | 177 (79.0%) | 47 (21.0%) |
| 6 to 18 Years | 300 (70.3%) | 153 (35.8%) |
| 19 to 25 Years | 77 (52.0%) | 9 (6.1%) |
| 25 to 34 Years | 323 (69.0%) | 77 (16.5%) |
| 35 to 44 Years | 59 (20.4%) | 170 (58.8%) |
| 45 to 54 Years | 387 (70.0%) | 132 (23.9%) |
| 55 to 64 Years | 265 (63.2%) | 150 (35.8%) |
| 65 to 74 Years | 363 (98.1%) | 43 (11.6%) |
| 75 Years and over | 336 (96.3%) | 32 (9.2%) |
| Total | 2,287 (70.4%) | 813 (25.0%) |
Disability Status by Sex by Age in Toa Alta
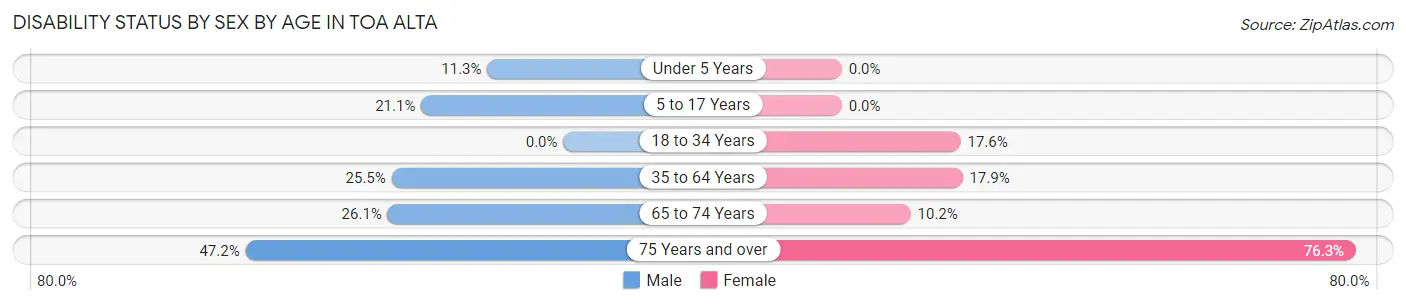
| Age Bracket | Male | Female |
| Under 5 Years | 15 (11.3%) | 0 (0.0%) |
| 5 to 17 Years | 46 (21.1%) | 0 (0.0%) |
| 18 to 34 Years | 0 (0.0%) | 85 (17.6%) |
| 35 to 64 Years | 165 (25.5%) | 110 (17.9%) |
| 65 to 74 Years | 48 (26.1%) | 19 (10.2%) |
| 75 Years and over | 59 (47.2%) | 171 (76.3%) |
Disability Class by Sex by Age in Toa Alta
Disability Class: Hearing Difficulty
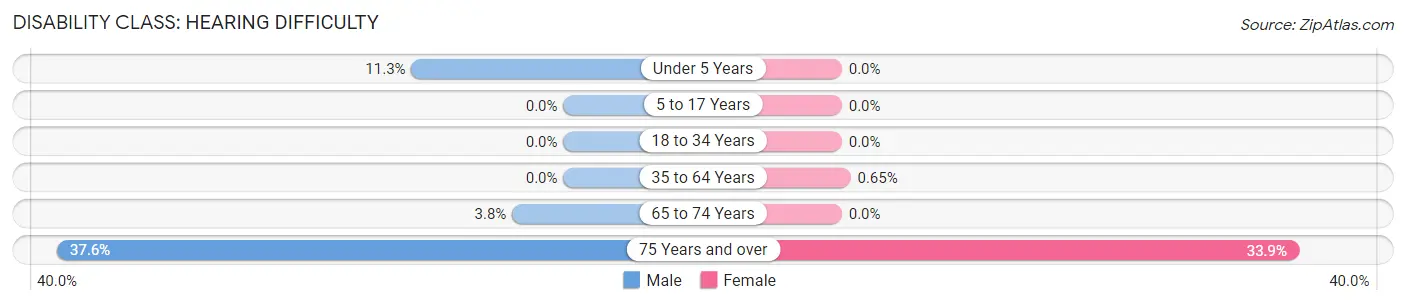
| Age Bracket | Male | Female |
| Under 5 Years | 15 (11.3%) | 0 (0.0%) |
| 5 to 17 Years | 0 (0.0%) | 0 (0.0%) |
| 18 to 34 Years | 0 (0.0%) | 0 (0.0%) |
| 35 to 64 Years | 0 (0.0%) | 4 (0.6%) |
| 65 to 74 Years | 7 (3.8%) | 0 (0.0%) |
| 75 Years and over | 47 (37.6%) | 76 (33.9%) |
Disability Class: Vision Difficulty
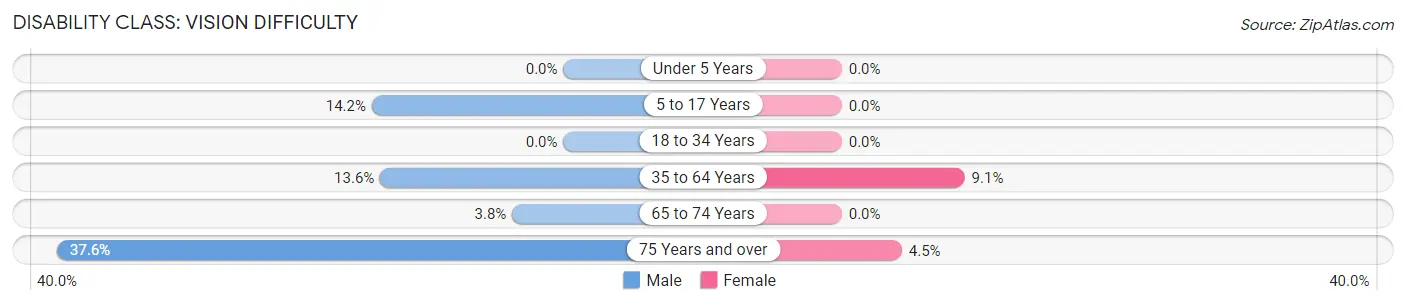
| Age Bracket | Male | Female |
| Under 5 Years | 0 (0.0%) | 0 (0.0%) |
| 5 to 17 Years | 31 (14.2%) | 0 (0.0%) |
| 18 to 34 Years | 0 (0.0%) | 0 (0.0%) |
| 35 to 64 Years | 88 (13.6%) | 56 (9.1%) |
| 65 to 74 Years | 7 (3.8%) | 0 (0.0%) |
| 75 Years and over | 47 (37.6%) | 10 (4.5%) |
Disability Class: Cognitive Difficulty
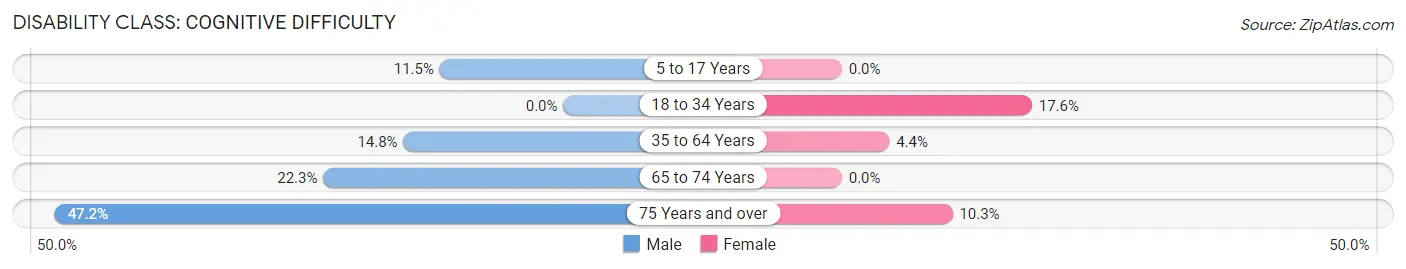
| Age Bracket | Male | Female |
| 5 to 17 Years | 25 (11.5%) | 0 (0.0%) |
| 18 to 34 Years | 0 (0.0%) | 85 (17.6%) |
| 35 to 64 Years | 96 (14.8%) | 27 (4.4%) |
| 65 to 74 Years | 41 (22.3%) | 0 (0.0%) |
| 75 Years and over | 59 (47.2%) | 23 (10.3%) |
Disability Class: Ambulatory Difficulty
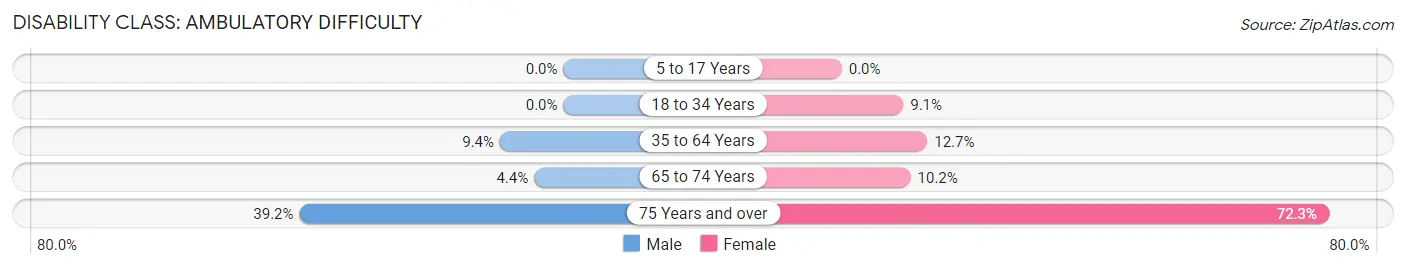
| Age Bracket | Male | Female |
| 5 to 17 Years | 0 (0.0%) | 0 (0.0%) |
| 18 to 34 Years | 0 (0.0%) | 44 (9.1%) |
| 35 to 64 Years | 61 (9.4%) | 78 (12.7%) |
| 65 to 74 Years | 8 (4.3%) | 19 (10.2%) |
| 75 Years and over | 49 (39.2%) | 162 (72.3%) |
Disability Class: Self-Care Difficulty
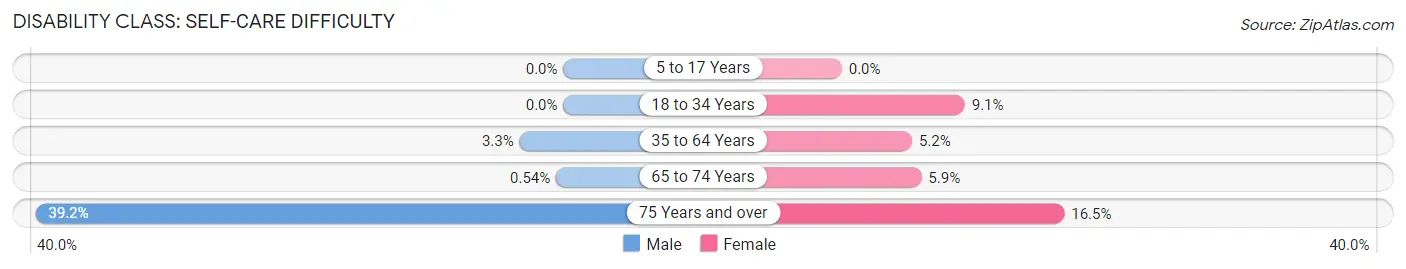
| Age Bracket | Male | Female |
| 5 to 17 Years | 0 (0.0%) | 0 (0.0%) |
| 18 to 34 Years | 0 (0.0%) | 44 (9.1%) |
| 35 to 64 Years | 21 (3.3%) | 32 (5.2%) |
| 65 to 74 Years | 1 (0.5%) | 11 (5.9%) |
| 75 Years and over | 49 (39.2%) | 37 (16.5%) |
Technology Access in Toa Alta
Computing Device Access in Toa Alta
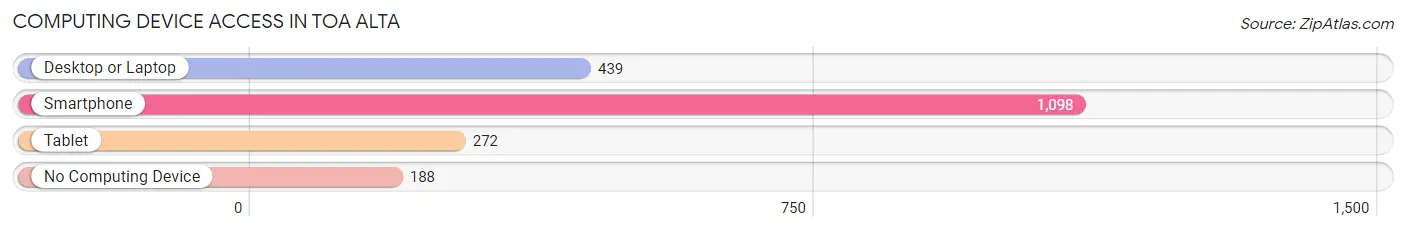
| Device Type | # Households | % Households |
| Desktop or Laptop | 439 | 32.7% |
| Smartphone | 1,098 | 81.9% |
| Tablet | 272 | 20.3% |
| No Computing Device | 188 | 14.0% |
| Total | 1,341 | 100.0% |
Internet Access in Toa Alta
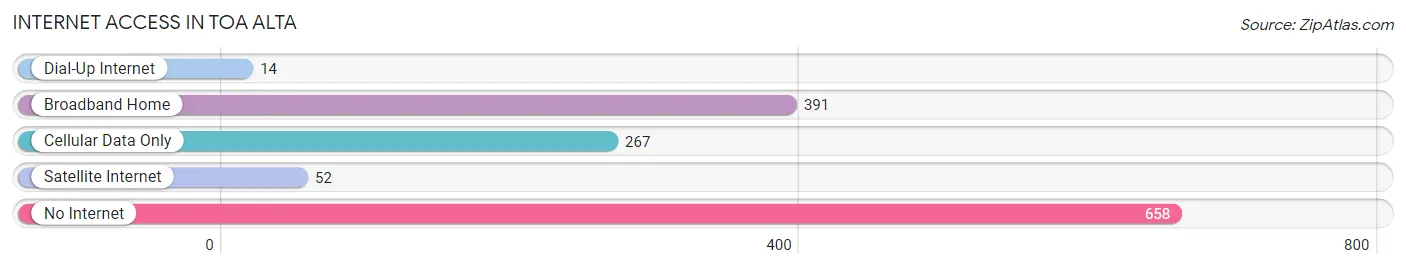
| Internet Type | # Households | % Households |
| Dial-Up Internet | 14 | 1.0% |
| Broadband Home | 391 | 29.2% |
| Cellular Data Only | 267 | 19.9% |
| Satellite Internet | 52 | 3.9% |
| No Internet | 658 | 49.1% |
| Total | 1,341 | 100.0% |
Toa Alta Summary
Toa Alta is a municipality located in the northern coast of Puerto Rico, in the northern karst zone of the island. It is bordered by the municipalities of Bayamón, Naranjito, Corozal, and Vega Alta. Toa Alta is spread over 8 wards and Toa Alta Pueblo (the downtown area and the administrative center of the municipality). It has a total area of 44.7 square miles (115.9 km2).
History
Toa Alta was founded in 1751 by Don Francisco de los Olivos. It was originally part of the municipality of Bayamón, but in 1776 it was established as an independent municipality. The name of the town comes from the Taino language and means “high land”.
The economy of Toa Alta was mainly based on agriculture and livestock. In the 19th century, the economy shifted to the production of sugar cane and coffee. In the 20th century, the economy shifted again to the production of dairy products, fruits, and vegetables.
Geography
Toa Alta is located in the northern coast of Puerto Rico, in the northern karst zone of the island. It is bordered by the municipalities of Bayamón, Naranjito, Corozal, and Vega Alta. Toa Alta is spread over 8 wards and Toa Alta Pueblo (the downtown area and the administrative center of the municipality). It has a total area of 44.7 square miles (115.9 km2).
The terrain of Toa Alta is mostly flat, with some hills in the northern part of the municipality. The highest point is Cerro La Santa, which is located in the ward of Toa Alta Pueblo and has an elevation of 1,065 feet (325 m). The municipality is drained by several rivers, including the Río Grande de Manatí, Río Cibuco, and Río Culebrinas.
Economy
The economy of Toa Alta is mainly based on agriculture and livestock. The main crops grown in the municipality are coffee, sugar cane, fruits, and vegetables. Livestock production is also important, with cattle, pigs, and poultry being the main animals raised.
The manufacturing sector is also important in Toa Alta, with several factories producing food products, clothing, and furniture. The municipality also has several shopping centers and other businesses.
Demographics
As of the 2010 census, Toa Alta had a population of 74,845. The population is mostly of mixed European and African descent. The majority of the population (90.2%) is of Hispanic or Latino origin. The median household income in Toa Alta is $20,845, which is lower than the median income for Puerto Rico as a whole ($21,624).
Toa Alta is served by several public schools, including the University of Puerto Rico at Toa Alta. The municipality also has several churches, including the Iglesia de Nuestra Señora de la Candelaria, which was built in 1751.
Common Questions
What is Per Capita Income in Toa Alta?
Per Capita income in Toa Alta is $11,426.
What is the Median Family Income in Toa Alta?
Median Family Income in Toa Alta is $21,938.
What is the Median Household income in Toa Alta?
Median Household Income in Toa Alta is $19,776.
What is Income or Wage Gap in Toa Alta?
Income or Wage Gap in Toa Alta is 6.3%.
Women in Toa Alta earn 93.7 cents for every dollar earned by a man.
What is Inequality or Gini Index in Toa Alta?
Inequality or Gini Index in Toa Alta is 0.48.
What is the Total Population of Toa Alta?
Total Population of Toa Alta is 3,251.
What is the Total Male Population of Toa Alta?
Total Male Population of Toa Alta is 1,557.
What is the Total Female Population of Toa Alta?
Total Female Population of Toa Alta is 1,694.
What is the Ratio of Males per 100 Females in Toa Alta?
There are 91.91 Males per 100 Females in Toa Alta.
What is the Ratio of Females per 100 Males in Toa Alta?
There are 108.80 Females per 100 Males in Toa Alta.
What is the Median Population Age in Toa Alta?
Median Population Age in Toa Alta is 45.4 Years.
What is the Average Family Size in Toa Alta
Average Family Size in Toa Alta is 3.0 People.
What is the Average Household Size in Toa Alta
Average Household Size in Toa Alta is 2.4 People.
How Large is the Labor Force in Toa Alta?
There are 854 People in the Labor Forcein in Toa Alta.
What is the Percentage of People in the Labor Force in Toa Alta?
30.9% of People are in the Labor Force in Toa Alta.
What is the Unemployment Rate in Toa Alta?
Unemployment Rate in Toa Alta is 7.4%.