Adjuntas, PR Map & Demographics
Adjuntas Map
Adjuntas Overview
$8,743
PER CAPITA INCOME
$19,000
AVG FAMILY INCOME
$17,752
AVG HOUSEHOLD INCOME
27.9%
WAGE / INCOME GAP [ % ]
72.1¢/ $1
WAGE / INCOME GAP [ $ ]
$10,252
FAMILY INCOME DEFICIT
0.44
INEQUALITY / GINI INDEX
4,765
TOTAL POPULATION
2,285
MALE POPULATION
2,480
FEMALE POPULATION
92.14
MALES / 100 FEMALES
108.53
FEMALES / 100 MALES
42.0
MEDIAN AGE
4.2
AVG FAMILY SIZE
3.2
AVG HOUSEHOLD SIZE
1,685
LABOR FORCE [ PEOPLE ]
43.8%
PERCENT IN LABOR FORCE
19.8%
UNEMPLOYMENT RATE
Adjuntas Zip Codes
Income in Adjuntas
Income Overview in Adjuntas
Per Capita Income in Adjuntas is $8,743, while median incomes of families and households are $19,000 and $17,752 respectively.
| Characteristic | Number | Measure |
| Per Capita Income | 4,765 | $8,743 |
| Median Family Income | 956 | $19,000 |
| Mean Family Income | 956 | $25,456 |
| Median Household Income | 1,503 | $17,752 |
| Mean Household Income | 1,503 | $22,140 |
| Income Deficit | 956 | $10,252 |
| Wage / Income Gap (%) | 4,765 | 27.94% |
| Wage / Income Gap ($) | 4,765 | 72.06¢ per $1 |
| Gini / Inequality Index | 4,765 | 0.44 |
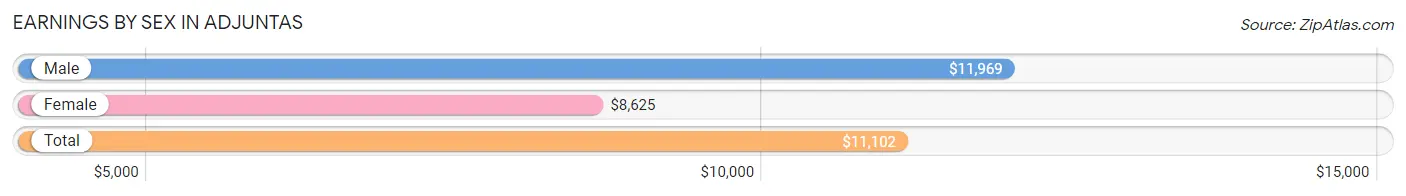
Earnings by Sex in Adjuntas
Average Earnings in Adjuntas are $11,102, $11,969 for men and $8,625 for women, a difference of 27.9%.
| Sex | Number | Average Earnings |
| Male | 953 (56.5%) | $11,969 |
| Female | 735 (43.5%) | $8,625 |
| Total | 1,688 (100.0%) | $11,102 |
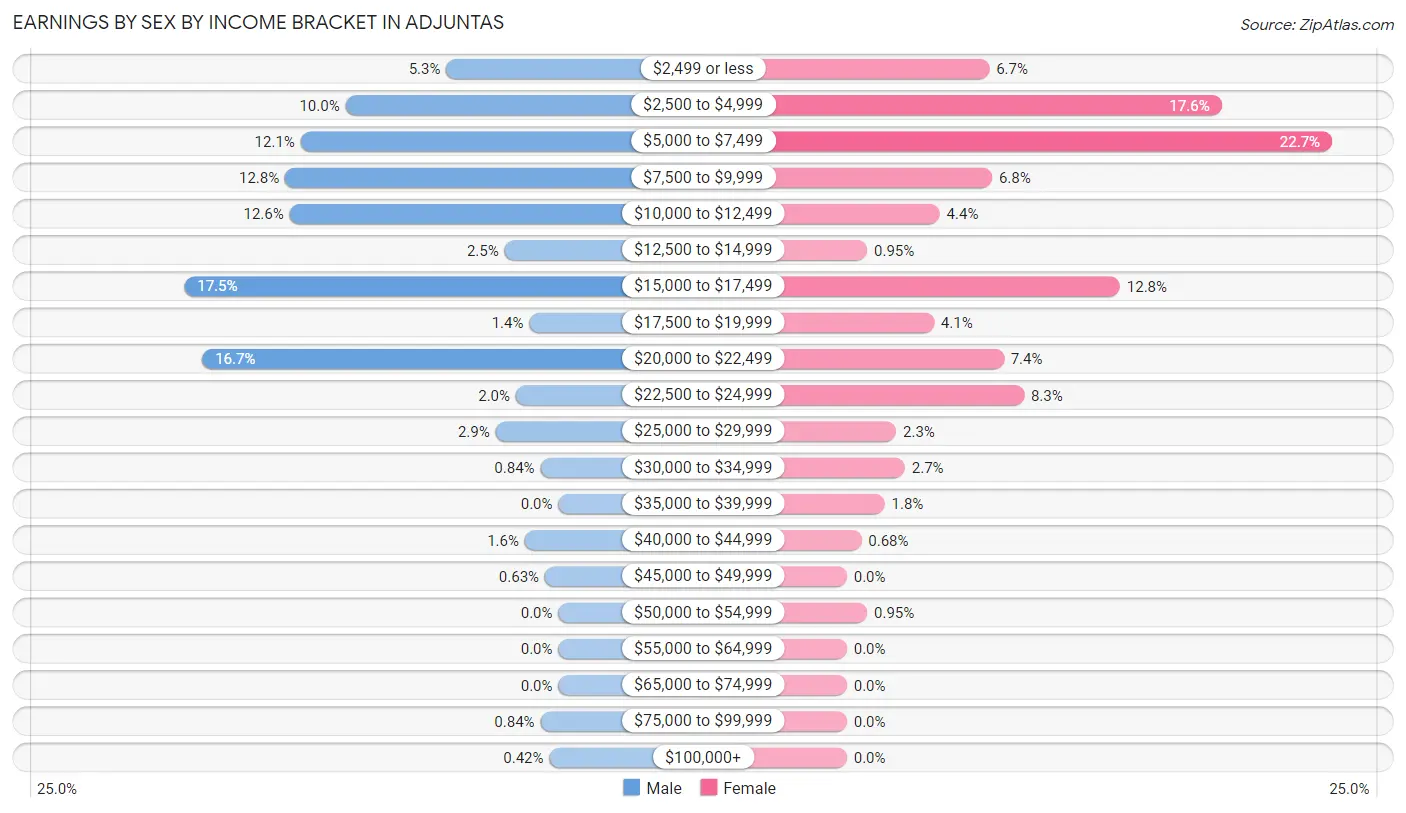
Earnings by Sex by Income Bracket in Adjuntas
The most common earnings brackets in Adjuntas are $15,000 to $17,499 for men (167 | 17.5%) and $5,000 to $7,499 for women (167 | 22.7%).
| Income | Male | Female |
| $2,499 or less | 50 (5.2%) | 49 (6.7%) |
| $2,500 to $4,999 | 95 (10.0%) | 129 (17.5%) |
| $5,000 to $7,499 | 115 (12.1%) | 167 (22.7%) |
| $7,500 to $9,999 | 122 (12.8%) | 50 (6.8%) |
| $10,000 to $12,499 | 120 (12.6%) | 32 (4.3%) |
| $12,500 to $14,999 | 24 (2.5%) | 7 (0.9%) |
| $15,000 to $17,499 | 167 (17.5%) | 94 (12.8%) |
| $17,500 to $19,999 | 13 (1.4%) | 30 (4.1%) |
| $20,000 to $22,499 | 159 (16.7%) | 54 (7.3%) |
| $22,500 to $24,999 | 19 (2.0%) | 61 (8.3%) |
| $25,000 to $29,999 | 28 (2.9%) | 17 (2.3%) |
| $30,000 to $34,999 | 8 (0.8%) | 20 (2.7%) |
| $35,000 to $39,999 | 0 (0.0%) | 13 (1.8%) |
| $40,000 to $44,999 | 15 (1.6%) | 5 (0.7%) |
| $45,000 to $49,999 | 6 (0.6%) | 0 (0.0%) |
| $50,000 to $54,999 | 0 (0.0%) | 7 (0.9%) |
| $55,000 to $64,999 | 0 (0.0%) | 0 (0.0%) |
| $65,000 to $74,999 | 0 (0.0%) | 0 (0.0%) |
| $75,000 to $99,999 | 8 (0.8%) | 0 (0.0%) |
| $100,000+ | 4 (0.4%) | 0 (0.0%) |
| Total | 953 (100.0%) | 735 (100.0%) |
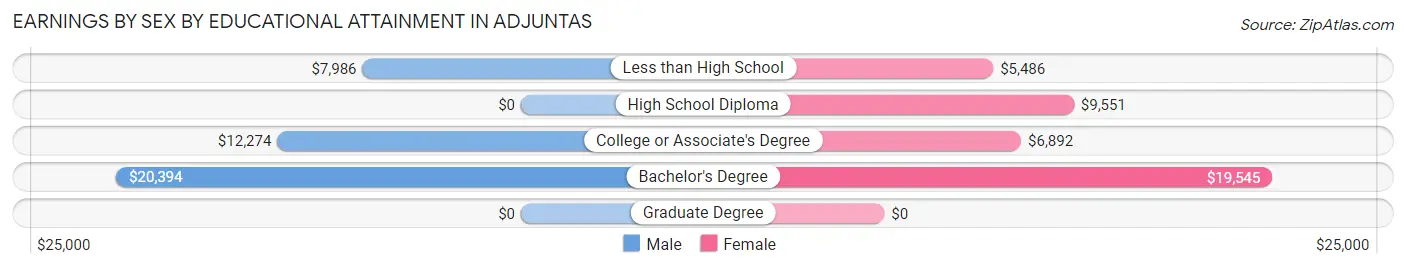
Earnings by Sex by Educational Attainment in Adjuntas
Average earnings in Adjuntas are $12,365 for men and $9,300 for women, a difference of 24.8%. Men with an educational attainment of bachelor's degree enjoy the highest average annual earnings of $20,394, while those with less than high school education earn the least with $7,986. Women with an educational attainment of bachelor's degree earn the most with the average annual earnings of $19,545, while those with less than high school education have the smallest earnings of $5,486.
| Educational Attainment | Male Income | Female Income |
| Less than High School | $7,986 | $5,486 |
| High School Diploma | - | - |
| College or Associate's Degree | $12,274 | $6,892 |
| Bachelor's Degree | $20,394 | $19,545 |
| Graduate Degree | - | - |
| Total | $12,365 | $9,300 |
Family Income in Adjuntas
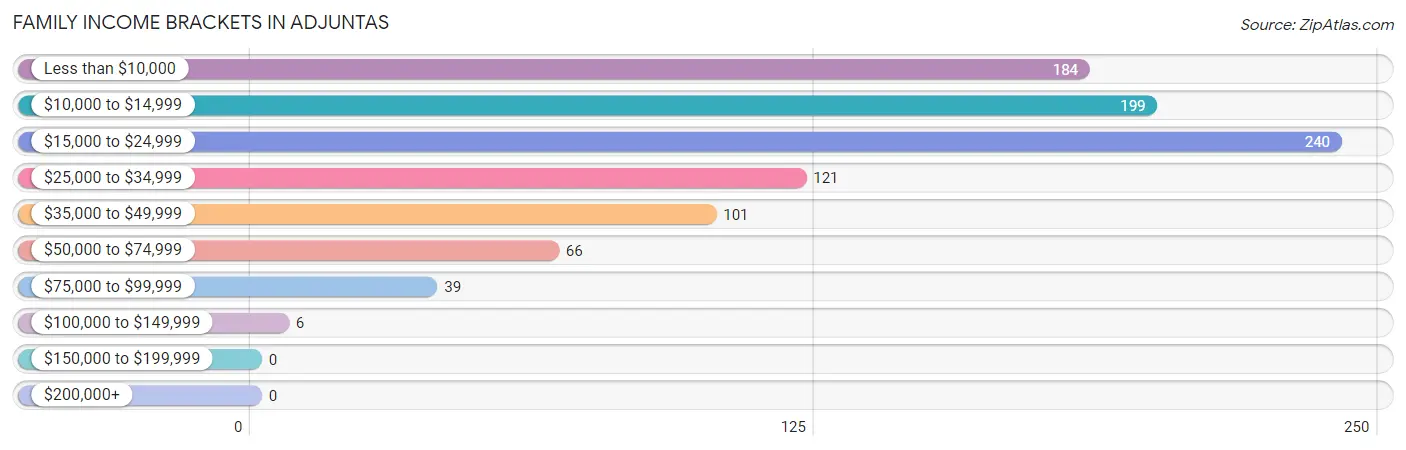
Family Income Brackets in Adjuntas
According to the Adjuntas family income data, there are 240 families falling into the $15,000 to $24,999 income range, which is the most common income bracket and makes up 25.1% of all families.
| Income Bracket | # Families | % Families |
| Less than $10,000 | 184 | 19.2% |
| $10,000 to $14,999 | 199 | 20.8% |
| $15,000 to $24,999 | 240 | 25.1% |
| $25,000 to $34,999 | 121 | 12.7% |
| $35,000 to $49,999 | 101 | 10.6% |
| $50,000 to $74,999 | 66 | 6.9% |
| $75,000 to $99,999 | 39 | 4.1% |
| $100,000 to $149,999 | 6 | 0.6% |
| $150,000 to $199,999 | 0 | 0.0% |
| $200,000+ | 0 | 0.0% |
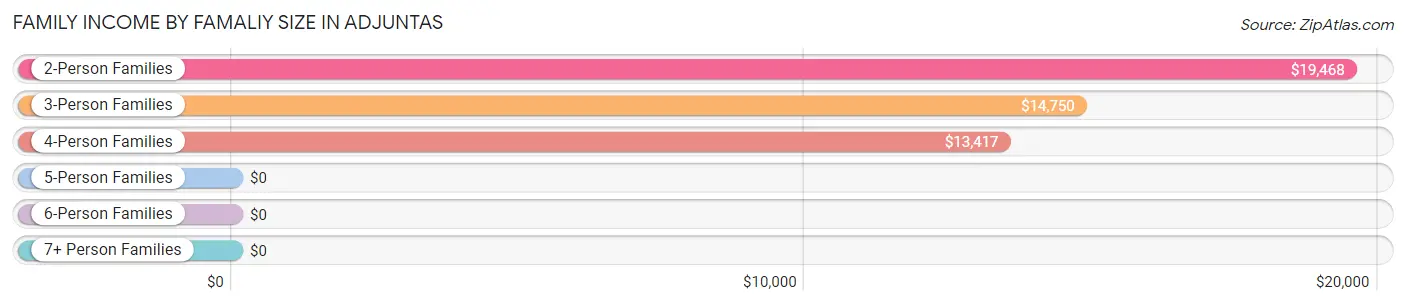
Family Income by Famaliy Size in Adjuntas
2-person families (527 | 55.1%) account for the highest median family income in Adjuntas with $19,468 per family, while 2-person families (527 | 55.1%) have the highest median income of $9,734 per family member.
| Income Bracket | # Families | Median Income |
| 2-Person Families | 527 (55.1%) | $19,468 |
| 3-Person Families | 220 (23.0%) | $14,750 |
| 4-Person Families | 161 (16.8%) | $13,417 |
| 5-Person Families | 24 (2.5%) | $0 |
| 6-Person Families | 0 (0.0%) | $0 |
| 7+ Person Families | 24 (2.5%) | $0 |
| Total | 956 (100.0%) | $19,000 |
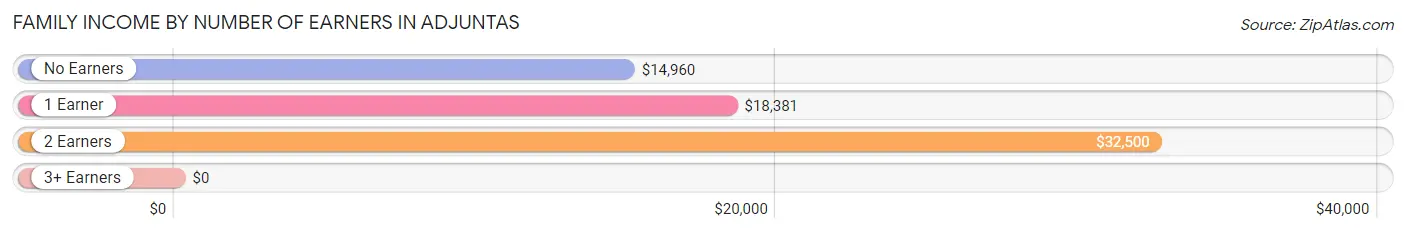
Family Income by Number of Earners in Adjuntas
| Number of Earners | # Families | Median Income |
| No Earners | 293 (30.6%) | $14,960 |
| 1 Earner | 447 (46.8%) | $18,381 |
| 2 Earners | 188 (19.7%) | $32,500 |
| 3+ Earners | 28 (2.9%) | $0 |
| Total | 956 (100.0%) | $19,000 |
Household Income in Adjuntas
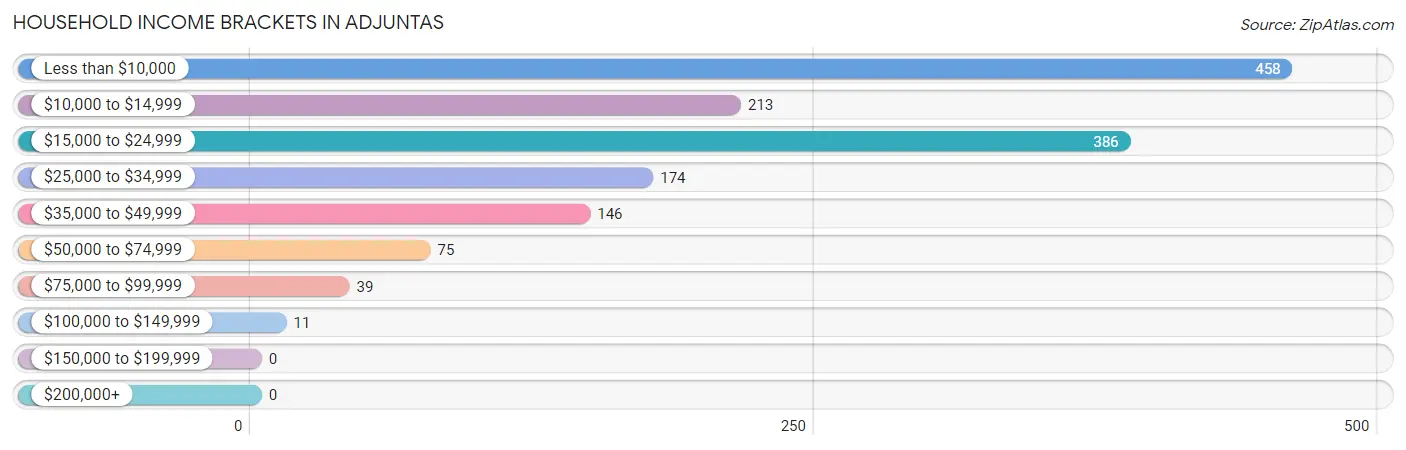
Household Income Brackets in Adjuntas
With 458 households falling in the category, the less than $10,000 income range is the most frequent in Adjuntas, accounting for 30.5% of all households.
| Income Bracket | # Households | % Households |
| Less than $10,000 | 458 | 30.5% |
| $10,000 to $14,999 | 213 | 14.2% |
| $15,000 to $24,999 | 386 | 25.7% |
| $25,000 to $34,999 | 174 | 11.6% |
| $35,000 to $49,999 | 146 | 9.7% |
| $50,000 to $74,999 | 75 | 5.0% |
| $75,000 to $99,999 | 39 | 2.6% |
| $100,000 to $149,999 | 11 | 0.7% |
| $150,000 to $199,999 | 0 | 0.0% |
| $200,000+ | 0 | 0.0% |
Household Income by Householder Age in Adjuntas
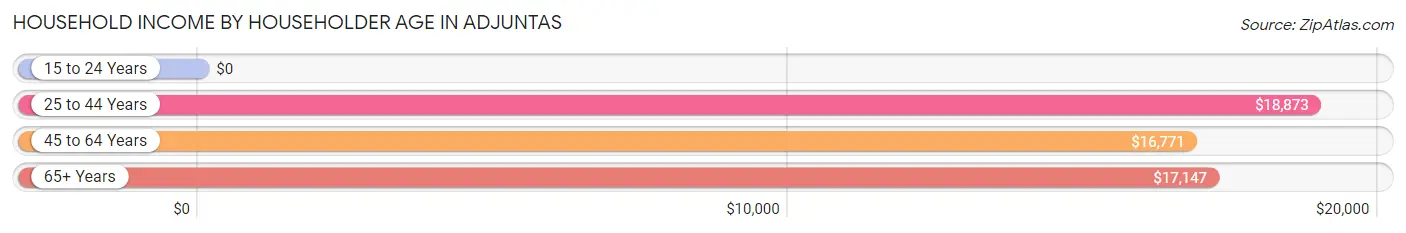
The median household income in Adjuntas is $17,752, with the highest median household income of $18,873 found in the 25 to 44 years age bracket for the primary householder. A total of 326 households (21.7%) fall into this category. Meanwhile, the 15 to 24 years age bracket for the primary householder has the lowest median household income of $0, with 5 households (0.3%) in this group.
| Income Bracket | # Households | Median Income |
| 15 to 24 Years | 5 (0.3%) | $0 |
| 25 to 44 Years | 326 (21.7%) | $18,873 |
| 45 to 64 Years | 501 (33.3%) | $16,771 |
| 65+ Years | 671 (44.6%) | $17,147 |
| Total | 1,503 (100.0%) | $17,752 |
Poverty in Adjuntas
Income Below Poverty by Sex and Age in Adjuntas
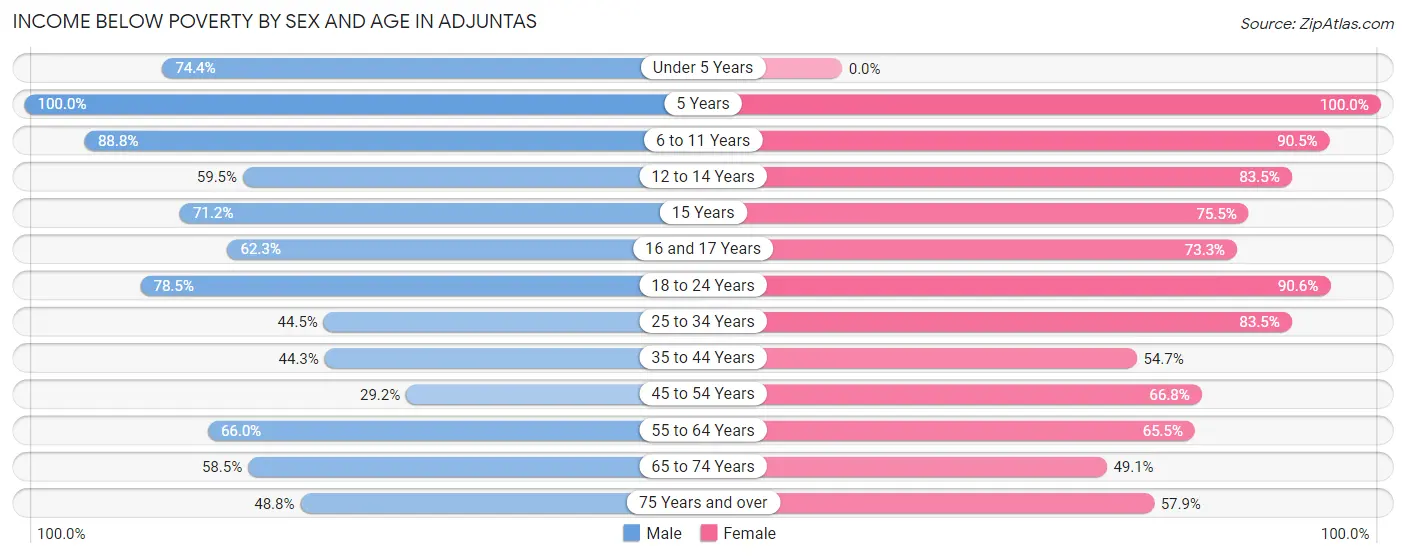
With 58.0% poverty level for males and 69.7% for females among the residents of Adjuntas, 5 year old males and 5 year old females are the most vulnerable to poverty, with 17 males (100.0%) and 41 females (100.0%) in their respective age groups living below the poverty level.
| Age Bracket | Male | Female |
| Under 5 Years | 96 (74.4%) | 0 (0.0%) |
| 5 Years | 17 (100.0%) | 41 (100.0%) |
| 6 to 11 Years | 198 (88.8%) | 181 (90.5%) |
| 12 to 14 Years | 47 (59.5%) | 106 (83.5%) |
| 15 Years | 37 (71.2%) | 37 (75.5%) |
| 16 and 17 Years | 48 (62.3%) | 22 (73.3%) |
| 18 to 24 Years | 124 (78.5%) | 116 (90.6%) |
| 25 to 34 Years | 105 (44.5%) | 374 (83.5%) |
| 35 to 44 Years | 144 (44.3%) | 122 (54.7%) |
| 45 to 54 Years | 73 (29.2%) | 193 (66.8%) |
| 55 to 64 Years | 186 (66.0%) | 171 (65.5%) |
| 65 to 74 Years | 168 (58.5%) | 168 (49.1%) |
| 75 Years and over | 83 (48.8%) | 198 (57.9%) |
| Total | 1,326 (58.0%) | 1,729 (69.7%) |
Income Above Poverty by Sex and Age in Adjuntas
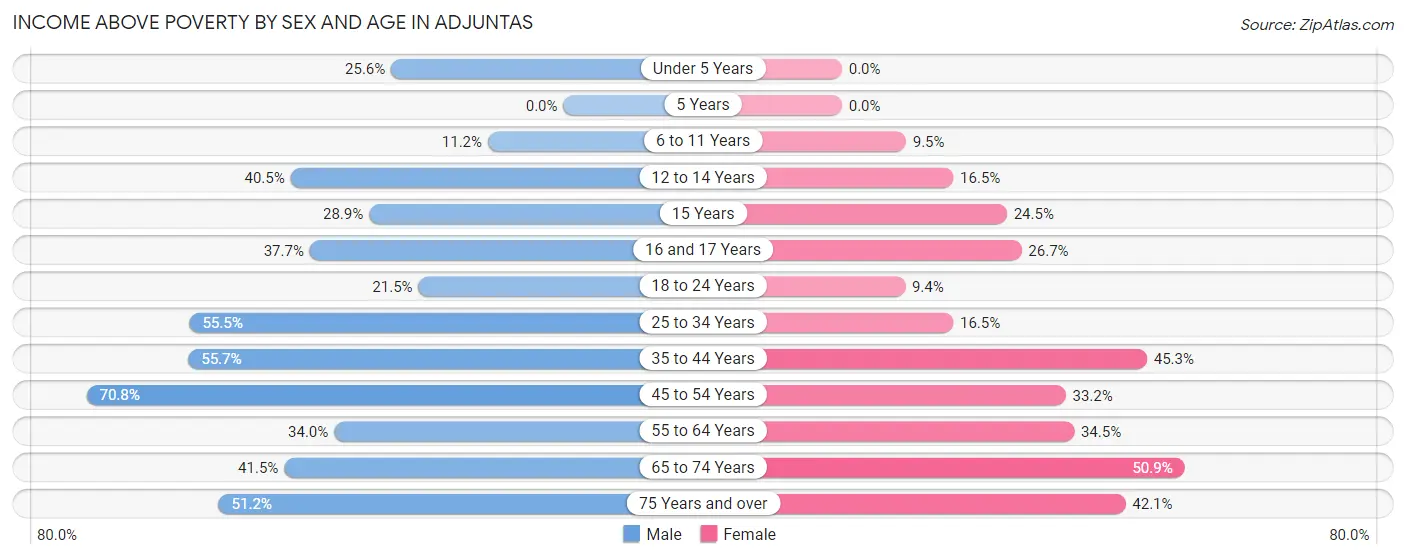
According to the poverty statistics in Adjuntas, males aged 45 to 54 years and females aged 65 to 74 years are the age groups that are most secure financially, with 70.8% of males and 50.9% of females in these age groups living above the poverty line.
| Age Bracket | Male | Female |
| Under 5 Years | 33 (25.6%) | 0 (0.0%) |
| 5 Years | 0 (0.0%) | 0 (0.0%) |
| 6 to 11 Years | 25 (11.2%) | 19 (9.5%) |
| 12 to 14 Years | 32 (40.5%) | 21 (16.5%) |
| 15 Years | 15 (28.8%) | 12 (24.5%) |
| 16 and 17 Years | 29 (37.7%) | 8 (26.7%) |
| 18 to 24 Years | 34 (21.5%) | 12 (9.4%) |
| 25 to 34 Years | 131 (55.5%) | 74 (16.5%) |
| 35 to 44 Years | 181 (55.7%) | 101 (45.3%) |
| 45 to 54 Years | 177 (70.8%) | 96 (33.2%) |
| 55 to 64 Years | 96 (34.0%) | 90 (34.5%) |
| 65 to 74 Years | 119 (41.5%) | 174 (50.9%) |
| 75 Years and over | 87 (51.2%) | 144 (42.1%) |
| Total | 959 (42.0%) | 751 (30.3%) |
Income Below Poverty Among Married-Couple Families in Adjuntas
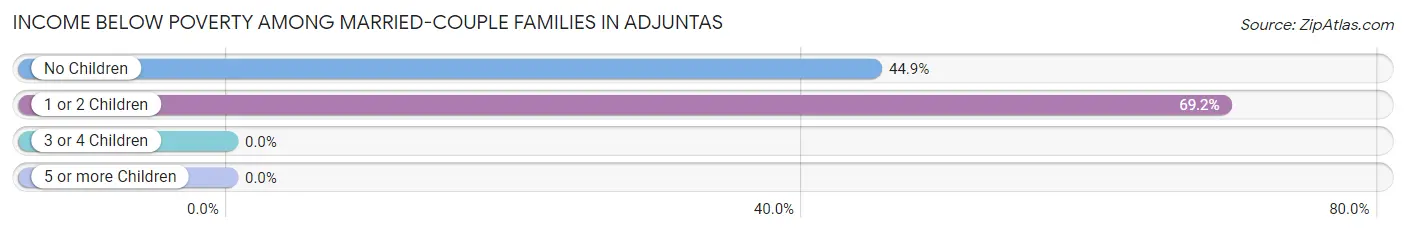
The poverty statistics for married-couple families in Adjuntas show that 51.8% or 218 of the total 421 families live below the poverty line. Families with 1 or 2 children have the highest poverty rate of 69.2%, comprising of 83 families. On the other hand, families with no children have the lowest poverty rate of 44.9%, which includes 135 families.
| Children | Above Poverty | Below Poverty |
| No Children | 166 (55.1%) | 135 (44.9%) |
| 1 or 2 Children | 37 (30.8%) | 83 (69.2%) |
| 3 or 4 Children | 0 (0.0%) | 0 (0.0%) |
| 5 or more Children | 0 (0.0%) | 0 (0.0%) |
| Total | 203 (48.2%) | 218 (51.8%) |
Income Below Poverty Among Single-Parent Households in Adjuntas
According to the poverty data in Adjuntas, 46.7% or 43 single-father households and 69.1% or 306 single-mother households are living below the poverty line. Among single-father households, those with no children have the highest poverty rate, with 43 households (51.2%) experiencing poverty. Likewise, among single-mother households, those with 3 or 4 children have the highest poverty rate, with 53 households (100.0%) falling below the poverty line.
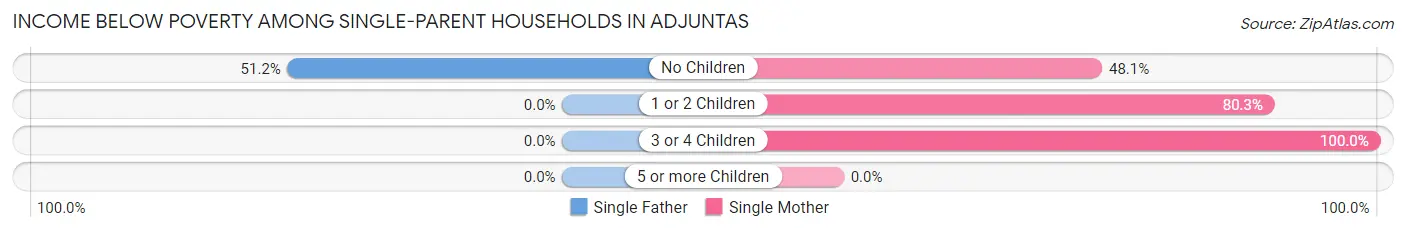
| Children | Single Father | Single Mother |
| No Children | 43 (51.2%) | 90 (48.1%) |
| 1 or 2 Children | 0 (0.0%) | 163 (80.3%) |
| 3 or 4 Children | 0 (0.0%) | 53 (100.0%) |
| 5 or more Children | 0 (0.0%) | 0 (0.0%) |
| Total | 43 (46.7%) | 306 (69.1%) |
Income Below Poverty Among Married-Couple vs Single-Parent Households in Adjuntas
The poverty data for Adjuntas shows that 218 of the married-couple family households (51.8%) and 349 of the single-parent households (65.2%) are living below the poverty level. Within the married-couple family households, those with 1 or 2 children have the highest poverty rate, with 83 households (69.2%) falling below the poverty line. Among the single-parent households, those with 3 or 4 children have the highest poverty rate, with 53 household (100.0%) living below poverty.
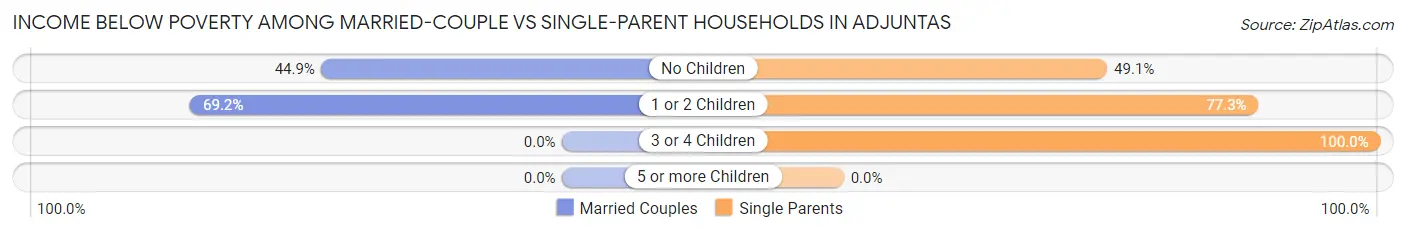
| Children | Married-Couple Families | Single-Parent Households |
| No Children | 135 (44.9%) | 133 (49.1%) |
| 1 or 2 Children | 83 (69.2%) | 163 (77.2%) |
| 3 or 4 Children | 0 (0.0%) | 53 (100.0%) |
| 5 or more Children | 0 (0.0%) | 0 (0.0%) |
| Total | 218 (51.8%) | 349 (65.2%) |
Race in Adjuntas
The most populous races in Adjuntas are Hispanic or Latino (4,706 | 98.8%), White / Caucasian (3,726 | 78.2%), and Two or more Races (489 | 10.3%).
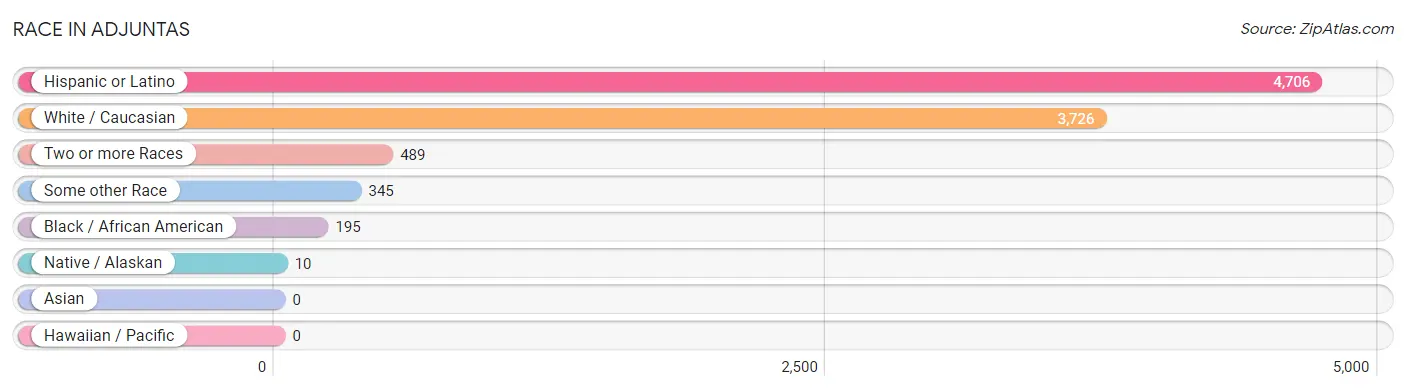
| Race | # Population | % Population |
| Asian | 0 | 0.0% |
| Black / African American | 195 | 4.1% |
| Hawaiian / Pacific | 0 | 0.0% |
| Hispanic or Latino | 4,706 | 98.8% |
| Native / Alaskan | 10 | 0.2% |
| White / Caucasian | 3,726 | 78.2% |
| Two or more Races | 489 | 10.3% |
| Some other Race | 345 | 7.2% |
| Total | 4,765 | 100.0% |
Ancestry in Adjuntas
The most populous ancestries reported in Adjuntas are Puerto Rican (4,689 | 98.4%), Central American Indian (10 | 0.2%), American (9 | 0.2%), Spaniard (9 | 0.2%), and Cuban (8 | 0.2%), together accounting for 99.2% of all Adjuntas residents.
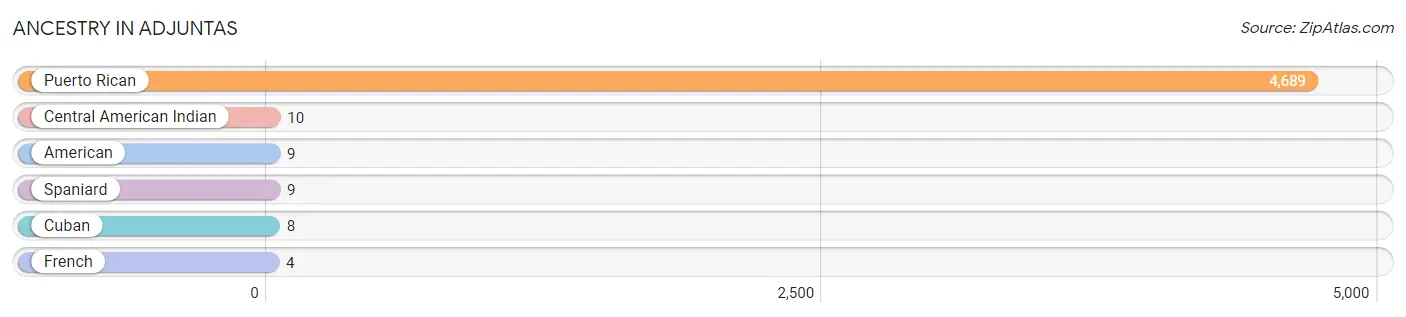
| Ancestry | # Population | % Population |
| American | 9 | 0.2% |
| Central American Indian | 10 | 0.2% |
| Cuban | 8 | 0.2% |
| French | 4 | 0.1% |
| Puerto Rican | 4,689 | 98.4% |
| Spaniard | 9 | 0.2% | View All 6 Rows |
Immigrants in Adjuntas

| Immigration Origin | # Population | % Population | View All 0 Rows |
Sex and Age in Adjuntas
Sex and Age in Adjuntas
The most populous age groups in Adjuntas are 55 to 59 Years (206 | 9.0%) for men and 10 to 14 Years (225 | 9.1%) for women.
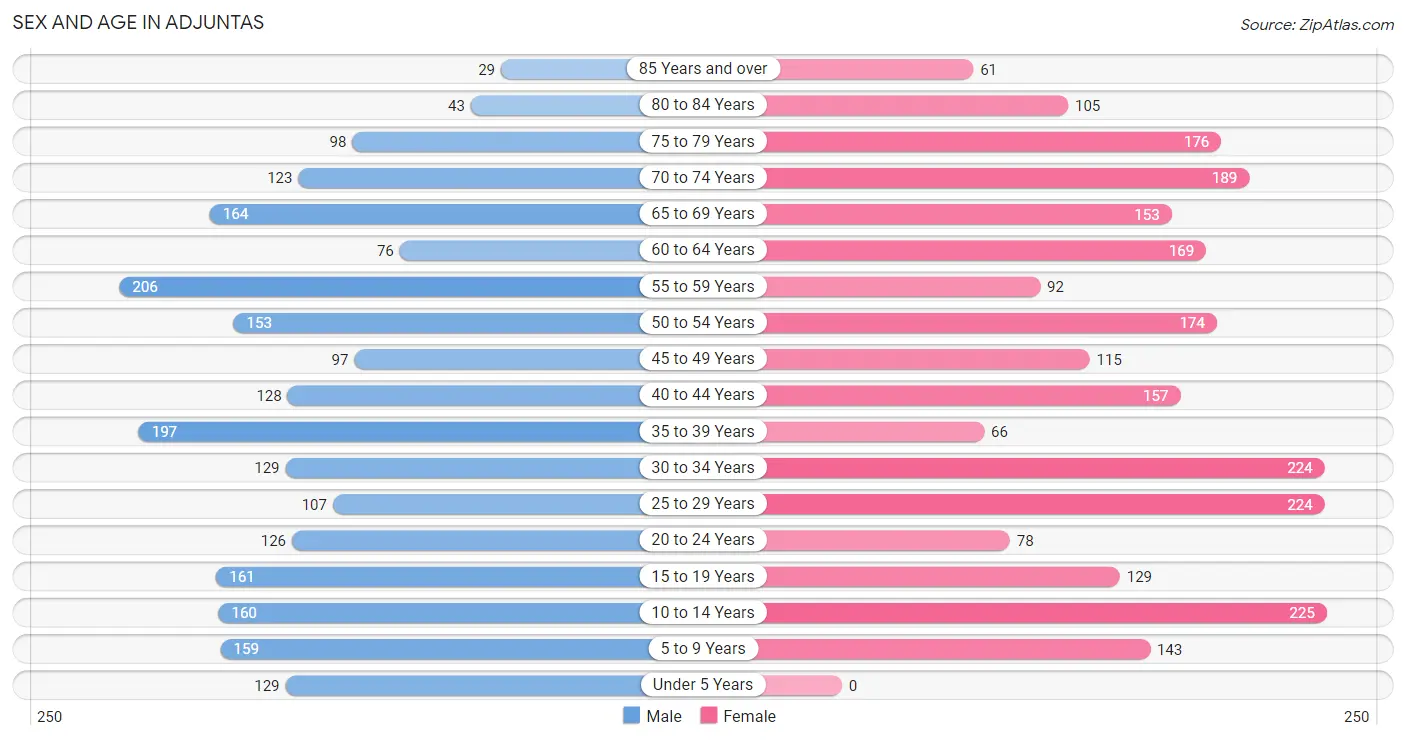
| Age Bracket | Male | Female |
| Under 5 Years | 129 (5.7%) | 0 (0.0%) |
| 5 to 9 Years | 159 (7.0%) | 143 (5.8%) |
| 10 to 14 Years | 160 (7.0%) | 225 (9.1%) |
| 15 to 19 Years | 161 (7.0%) | 129 (5.2%) |
| 20 to 24 Years | 126 (5.5%) | 78 (3.2%) |
| 25 to 29 Years | 107 (4.7%) | 224 (9.0%) |
| 30 to 34 Years | 129 (5.7%) | 224 (9.0%) |
| 35 to 39 Years | 197 (8.6%) | 66 (2.7%) |
| 40 to 44 Years | 128 (5.6%) | 157 (6.3%) |
| 45 to 49 Years | 97 (4.3%) | 115 (4.6%) |
| 50 to 54 Years | 153 (6.7%) | 174 (7.0%) |
| 55 to 59 Years | 206 (9.0%) | 92 (3.7%) |
| 60 to 64 Years | 76 (3.3%) | 169 (6.8%) |
| 65 to 69 Years | 164 (7.2%) | 153 (6.2%) |
| 70 to 74 Years | 123 (5.4%) | 189 (7.6%) |
| 75 to 79 Years | 98 (4.3%) | 176 (7.1%) |
| 80 to 84 Years | 43 (1.9%) | 105 (4.2%) |
| 85 Years and over | 29 (1.3%) | 61 (2.5%) |
| Total | 2,285 (100.0%) | 2,480 (100.0%) |
Families and Households in Adjuntas
Median Family Size in Adjuntas
The median family size in Adjuntas is 4.20 persons per family, with single female/mother families (443 | 46.3%) accounting for the largest median family size of 4.61 persons per family. On the other hand, married-couple families (421 | 44.0%) represent the smallest median family size with 3.76 persons per family.
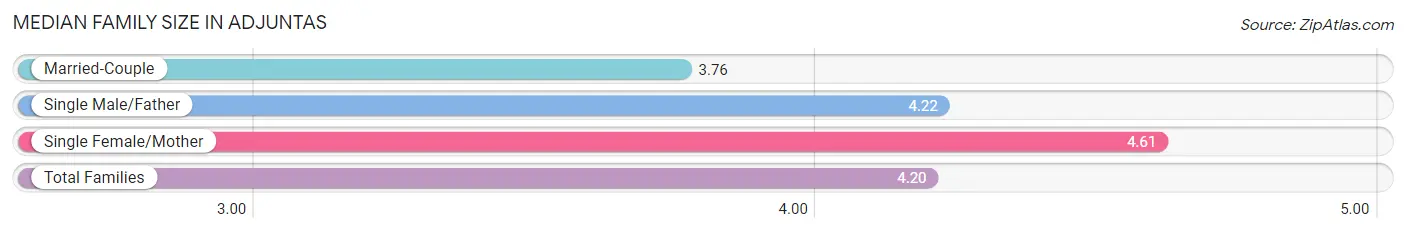
| Family Type | # Families | Family Size |
| Married-Couple | 421 (44.0%) | 3.76 |
| Single Male/Father | 92 (9.6%) | 4.22 |
| Single Female/Mother | 443 (46.3%) | 4.61 |
| Total Families | 956 (100.0%) | 4.20 |
Median Household Size in Adjuntas
The median household size in Adjuntas is 3.16 persons per household, with single female/mother households (443 | 29.5%) accounting for the largest median household size of 4.84 persons per household. non-family households (547 | 36.4%) represent the smallest median household size with 1.12 persons per household.
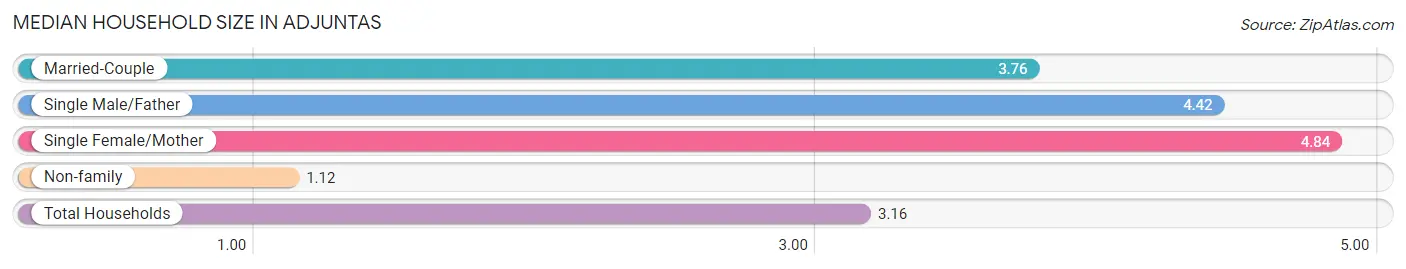
| Household Type | # Households | Household Size |
| Married-Couple | 421 (28.0%) | 3.76 |
| Single Male/Father | 92 (6.1%) | 4.42 |
| Single Female/Mother | 443 (29.5%) | 4.84 |
| Non-family | 547 (36.4%) | 1.12 |
| Total Households | 1,503 (100.0%) | 3.16 |
Household Size by Marriage Status in Adjuntas
Out of a total of 1,503 households in Adjuntas, 956 (63.6%) are family households, while 547 (36.4%) are nonfamily households. The most numerous type of family households are 2-person households, comprising 473, and the most common type of nonfamily households are 1-person households, comprising 495.
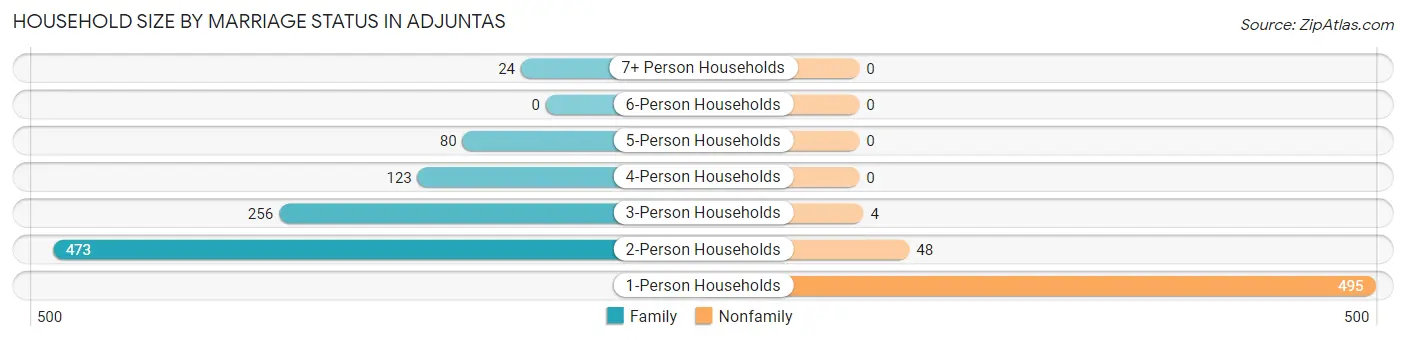
| Household Size | Family Households | Nonfamily Households |
| 1-Person Households | - | 495 (32.9%) |
| 2-Person Households | 473 (31.5%) | 48 (3.2%) |
| 3-Person Households | 256 (17.0%) | 4 (0.3%) |
| 4-Person Households | 123 (8.2%) | 0 (0.0%) |
| 5-Person Households | 80 (5.3%) | 0 (0.0%) |
| 6-Person Households | 0 (0.0%) | 0 (0.0%) |
| 7+ Person Households | 24 (1.6%) | 0 (0.0%) |
| Total | 956 (63.6%) | 547 (36.4%) |
Female Fertility in Adjuntas
Fertility by Age in Adjuntas
| Age Bracket | Women with Births | Births / 1,000 Women |
| 15 to 19 years | 0 (0.0%) | 0.0 |
| 20 to 34 years | 0 (0.0%) | 0.0 |
| 35 to 50 years | 0 (0.0%) | 0.0 |
| Total | 0 (0.0%) | 0.0 |
Fertility by Age by Marriage Status in Adjuntas
| Age Bracket | Married | Unmarried |
| 15 to 19 years | 0 (0.0%) | 0 (0.0%) |
| 20 to 34 years | 0 (0.0%) | 0 (0.0%) |
| 35 to 50 years | 0 (0.0%) | 0 (0.0%) |
| Total | 0 (0.0%) | 0 (0.0%) |
Fertility by Education in Adjuntas
| Educational Attainment | Women with Births | Births / 1,000 Women |
| Less than High School | 0 (0.0%) | 0.0 |
| High School Diploma | 0 (0.0%) | 0.0 |
| College or Associate's Degree | 0 (0.0%) | 0.0 |
| Bachelor's Degree | 0 (0.0%) | 0.0 |
| Graduate Degree | 0 (0.0%) | 0.0 |
| Total | 0 (0.0%) | 0.0 |
Fertility by Education by Marriage Status in Adjuntas
| Educational Attainment | Married | Unmarried |
| Less than High School | 0 (0.0%) | 0 (0.0%) |
| High School Diploma | 0 (0.0%) | 0 (0.0%) |
| College or Associate's Degree | 0 (0.0%) | 0 (0.0%) |
| Bachelor's Degree | 0 (0.0%) | 0 (0.0%) |
| Graduate Degree | 0 (0.0%) | 0 (0.0%) |
| Total | 0 (0.0%) | 0 (0.0%) |
Employment Characteristics in Adjuntas
Employment by Class of Employer in Adjuntas
Among the 1,349 employed individuals in Adjuntas, private company employees (747 | 55.4%), state government employees (204 | 15.1%), and self-employed (not incorporated) (182 | 13.5%) make up the most common classes of employment.
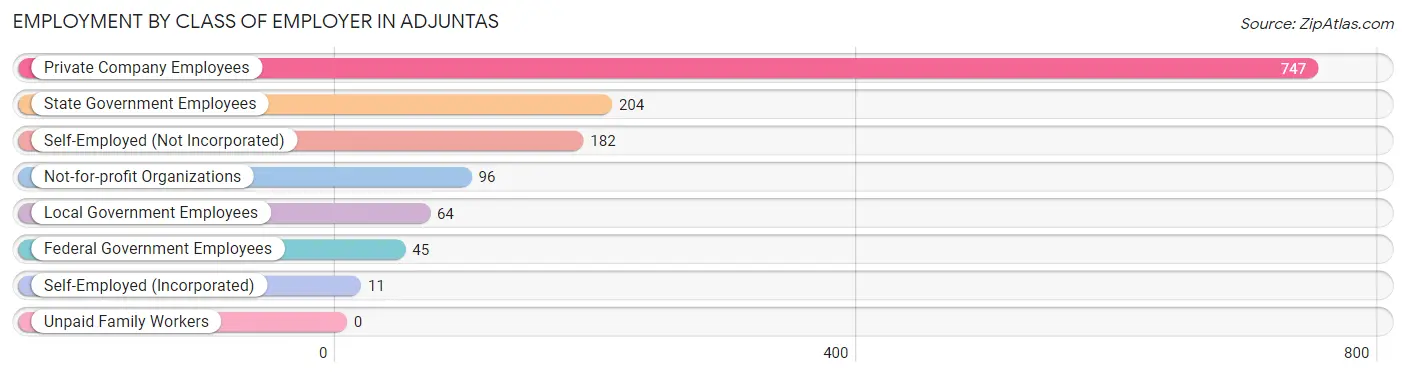
| Employer Class | # Employees | % Employees |
| Private Company Employees | 747 | 55.4% |
| Self-Employed (Incorporated) | 11 | 0.8% |
| Self-Employed (Not Incorporated) | 182 | 13.5% |
| Not-for-profit Organizations | 96 | 7.1% |
| Local Government Employees | 64 | 4.7% |
| State Government Employees | 204 | 15.1% |
| Federal Government Employees | 45 | 3.3% |
| Unpaid Family Workers | 0 | 0.0% |
| Total | 1,349 | 100.0% |
Employment Status by Age in Adjuntas
According to the labor force statistics for Adjuntas, out of the total population over 16 years of age (3,848), 43.8% or 1,685 individuals are in the labor force, with 19.8% or 334 of them unemployed. The age group with the highest labor force participation rate is 35 to 44 years, with 78.8% or 432 individuals in the labor force. Within the labor force, the 20 to 24 years age range has the highest percentage of unemployed individuals, with 64.9% or 63 of them being unemployed.
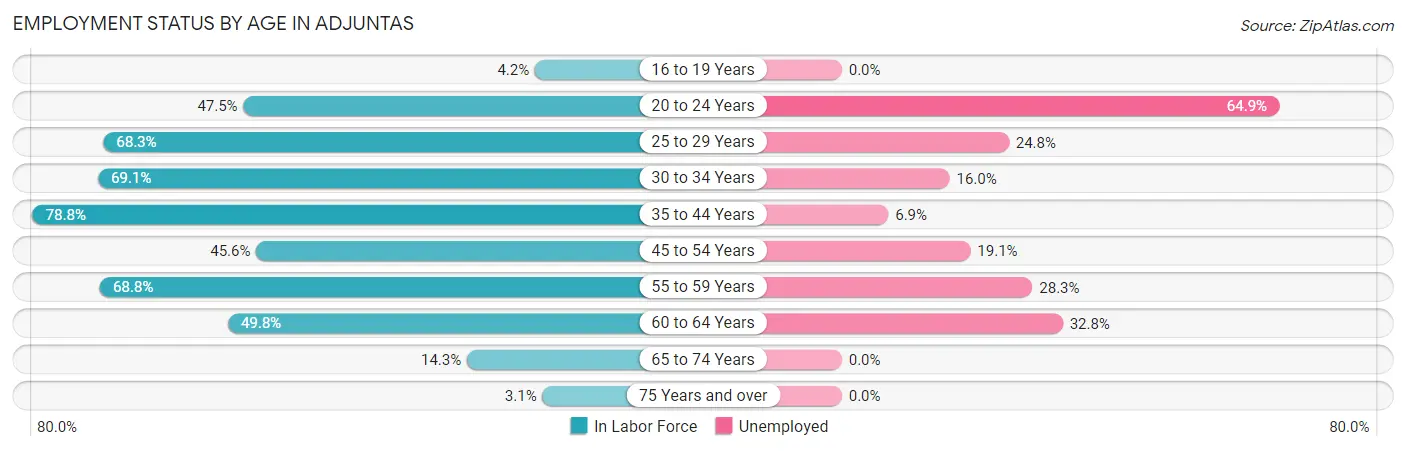
| Age Bracket | In Labor Force | Unemployed |
| 16 to 19 Years | 8 (4.2%) | 0 (0.0%) |
| 20 to 24 Years | 97 (47.5%) | 63 (64.9%) |
| 25 to 29 Years | 226 (68.3%) | 56 (24.8%) |
| 30 to 34 Years | 244 (69.1%) | 39 (16.0%) |
| 35 to 44 Years | 432 (78.8%) | 30 (6.9%) |
| 45 to 54 Years | 246 (45.6%) | 47 (19.1%) |
| 55 to 59 Years | 205 (68.8%) | 58 (28.3%) |
| 60 to 64 Years | 122 (49.8%) | 40 (32.8%) |
| 65 to 74 Years | 90 (14.3%) | 0 (0.0%) |
| 75 Years and over | 16 (3.1%) | 0 (0.0%) |
| Total | 1,685 (43.8%) | 334 (19.8%) |
Employment Status by Educational Attainment in Adjuntas
According to labor force statistics for Adjuntas, 63.7% of individuals (1,474) out of the total population between 25 and 64 years of age (2,314) are in the labor force, with 18.3% or 270 of them being unemployed. The group with the highest labor force participation rate are those with the educational attainment of college / associate degree, with 83.4% or 533 individuals in the labor force. Within the labor force, individuals with high school diploma education have the highest percentage of unemployment, with 30.4% or 109 of them being unemployed.
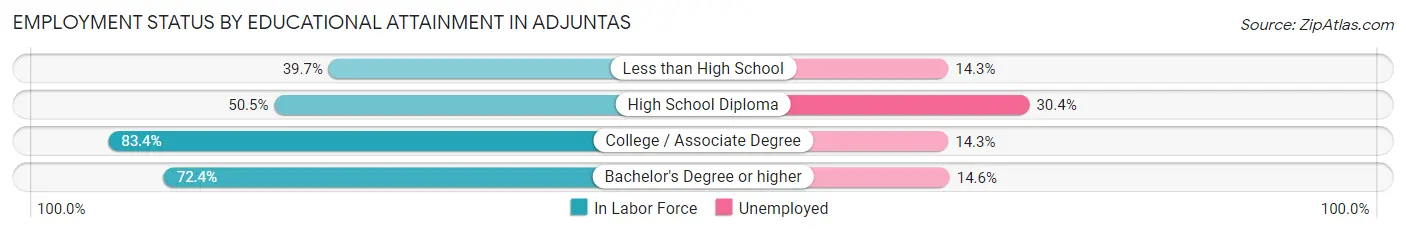
| Educational Attainment | In Labor Force | Unemployed |
| Less than High School | 140 (39.7%) | 50 (14.3%) |
| High School Diploma | 358 (50.5%) | 216 (30.4%) |
| College / Associate Degree | 533 (83.4%) | 91 (14.3%) |
| Bachelor's Degree or higher | 444 (72.4%) | 89 (14.6%) |
| Total | 1,474 (63.7%) | 423 (18.3%) |
Employment Occupations by Sex in Adjuntas
Management, Business, Science and Arts Occupations
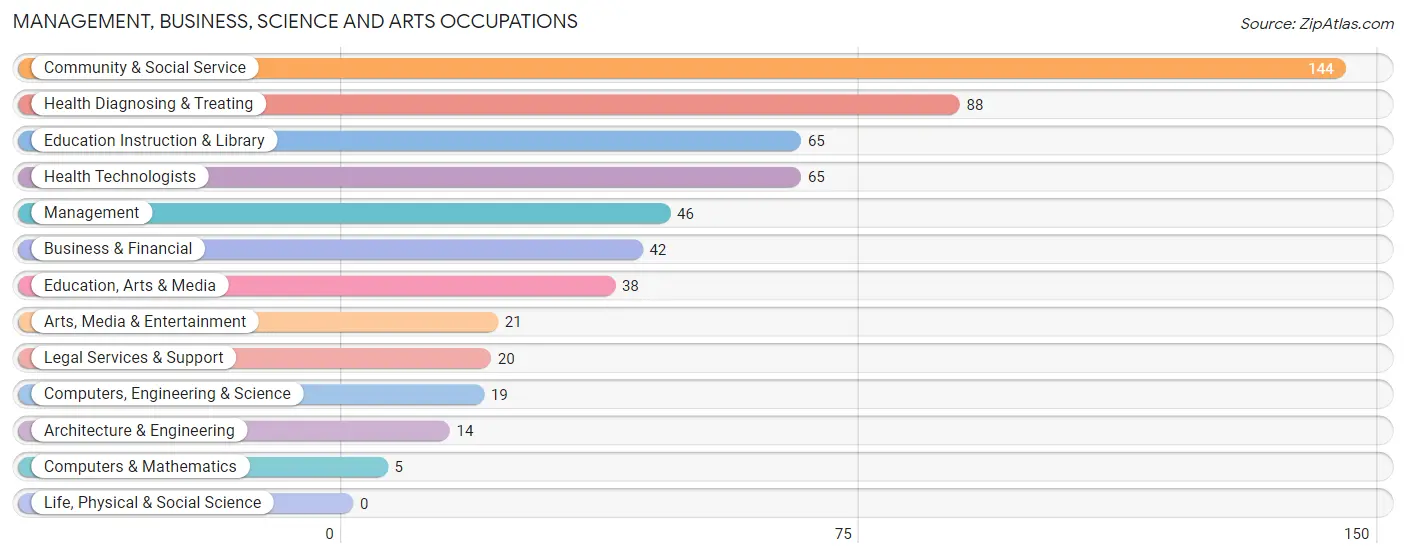
The most common Management, Business, Science and Arts occupations in Adjuntas are Community & Social Service (144 | 10.6%), Health Diagnosing & Treating (88 | 6.5%), Education Instruction & Library (65 | 4.8%), Health Technologists (65 | 4.8%), and Management (46 | 3.4%).
Management, Business, Science and Arts Occupations by Sex
Within the Management, Business, Science and Arts occupations in Adjuntas, the most male-oriented occupations are Computers, Engineering & Science (100.0%), Computers & Mathematics (100.0%), and Architecture & Engineering (100.0%), while the most female-oriented occupations are Education Instruction & Library (100.0%), Health Diagnosing & Treating (84.1%), and Health Technologists (78.5%).
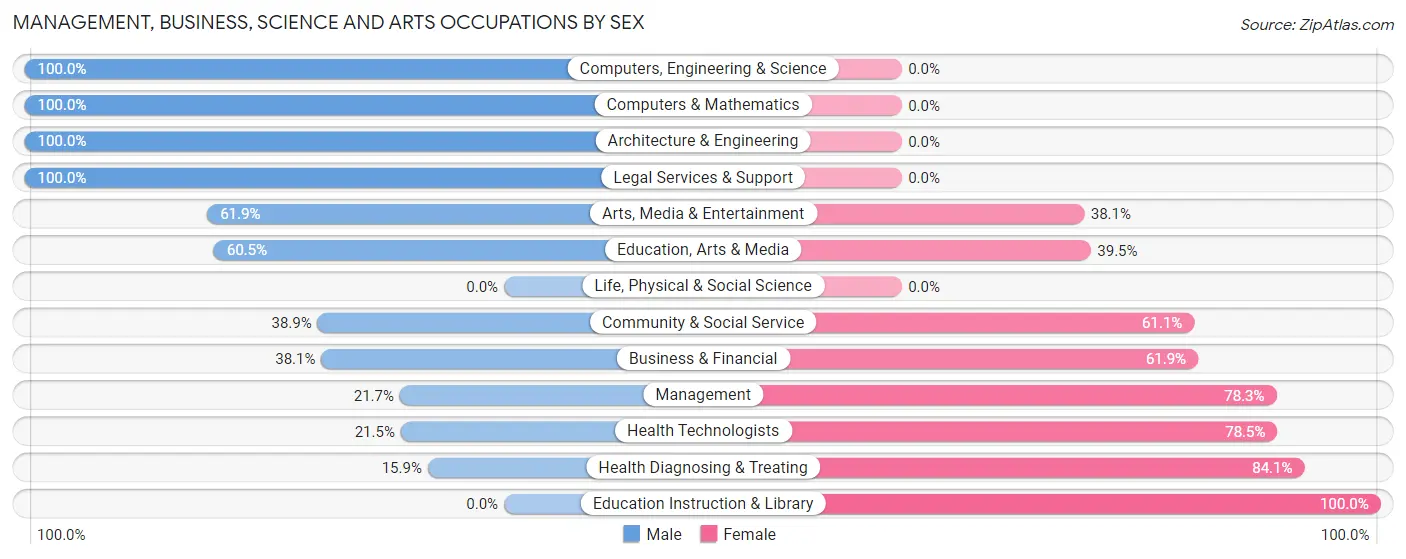
| Occupation | Male | Female |
| Management | 10 (21.7%) | 36 (78.3%) |
| Business & Financial | 16 (38.1%) | 26 (61.9%) |
| Computers, Engineering & Science | 19 (100.0%) | 0 (0.0%) |
| Computers & Mathematics | 5 (100.0%) | 0 (0.0%) |
| Architecture & Engineering | 14 (100.0%) | 0 (0.0%) |
| Life, Physical & Social Science | 0 (0.0%) | 0 (0.0%) |
| Community & Social Service | 56 (38.9%) | 88 (61.1%) |
| Education, Arts & Media | 23 (60.5%) | 15 (39.5%) |
| Legal Services & Support | 20 (100.0%) | 0 (0.0%) |
| Education Instruction & Library | 0 (0.0%) | 65 (100.0%) |
| Arts, Media & Entertainment | 13 (61.9%) | 8 (38.1%) |
| Health Diagnosing & Treating | 14 (15.9%) | 74 (84.1%) |
| Health Technologists | 14 (21.5%) | 51 (78.5%) |
| Total (Category) | 115 (33.9%) | 224 (66.1%) |
| Total (Overall) | 711 (52.5%) | 642 (47.4%) |
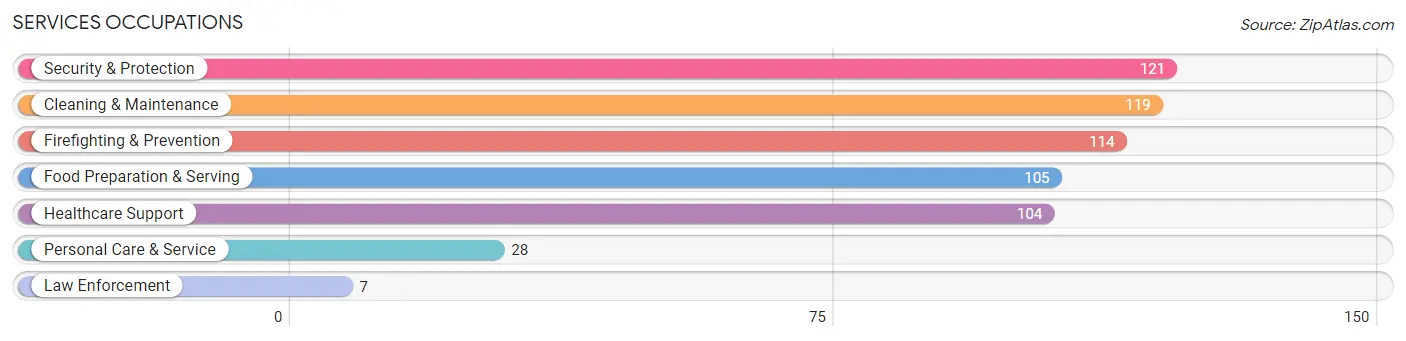
Services Occupations
The most common Services occupations in Adjuntas are Security & Protection (121 | 8.9%), Cleaning & Maintenance (119 | 8.8%), Firefighting & Prevention (114 | 8.4%), Food Preparation & Serving (105 | 7.8%), and Healthcare Support (104 | 7.7%).
Services Occupations by Sex
Within the Services occupations in Adjuntas, the most male-oriented occupations are Law Enforcement (100.0%), Security & Protection (95.0%), and Firefighting & Prevention (94.7%), while the most female-oriented occupations are Healthcare Support (87.5%), Food Preparation & Serving (61.9%), and Personal Care & Service (60.7%).
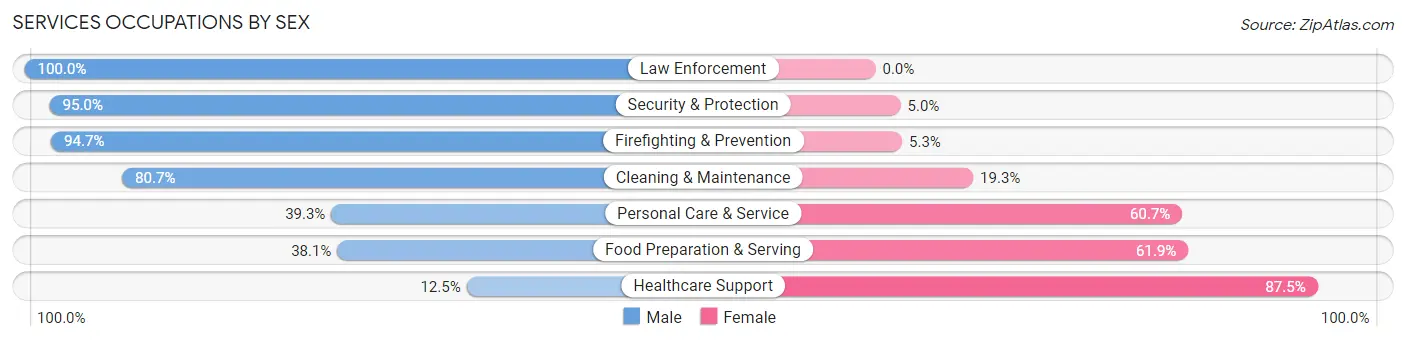
| Occupation | Male | Female |
| Healthcare Support | 13 (12.5%) | 91 (87.5%) |
| Security & Protection | 115 (95.0%) | 6 (5.0%) |
| Firefighting & Prevention | 108 (94.7%) | 6 (5.3%) |
| Law Enforcement | 7 (100.0%) | 0 (0.0%) |
| Food Preparation & Serving | 40 (38.1%) | 65 (61.9%) |
| Cleaning & Maintenance | 96 (80.7%) | 23 (19.3%) |
| Personal Care & Service | 11 (39.3%) | 17 (60.7%) |
| Total (Category) | 275 (57.7%) | 202 (42.3%) |
| Total (Overall) | 711 (52.5%) | 642 (47.4%) |
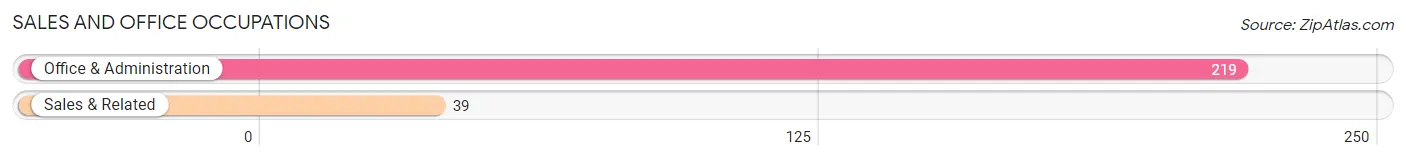
Sales and Office Occupations
The most common Sales and Office occupations in Adjuntas are Office & Administration (219 | 16.2%), and Sales & Related (39 | 2.9%).
Sales and Office Occupations by Sex
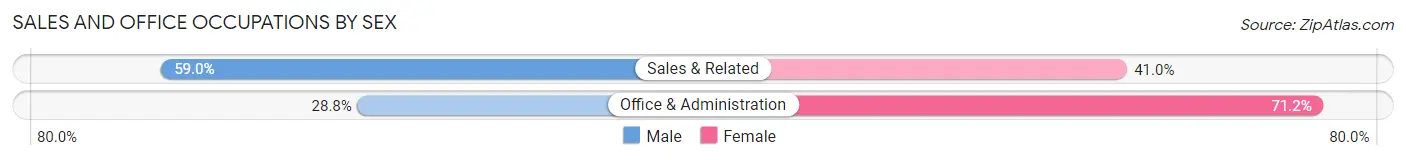
| Occupation | Male | Female |
| Sales & Related | 23 (59.0%) | 16 (41.0%) |
| Office & Administration | 63 (28.8%) | 156 (71.2%) |
| Total (Category) | 86 (33.3%) | 172 (66.7%) |
| Total (Overall) | 711 (52.5%) | 642 (47.4%) |
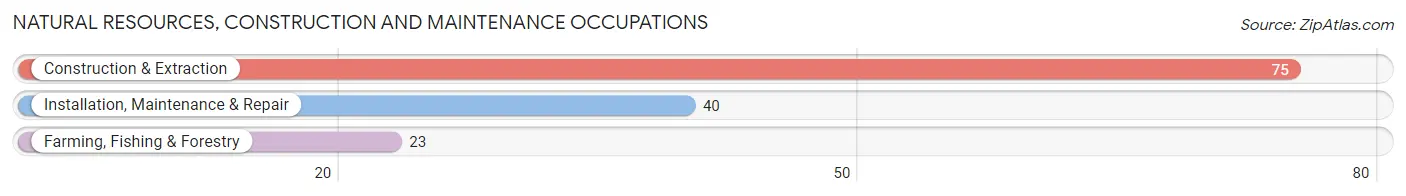
Natural Resources, Construction and Maintenance Occupations
The most common Natural Resources, Construction and Maintenance occupations in Adjuntas are Construction & Extraction (75 | 5.5%), Installation, Maintenance & Repair (40 | 3.0%), and Farming, Fishing & Forestry (23 | 1.7%).
Natural Resources, Construction and Maintenance Occupations by Sex
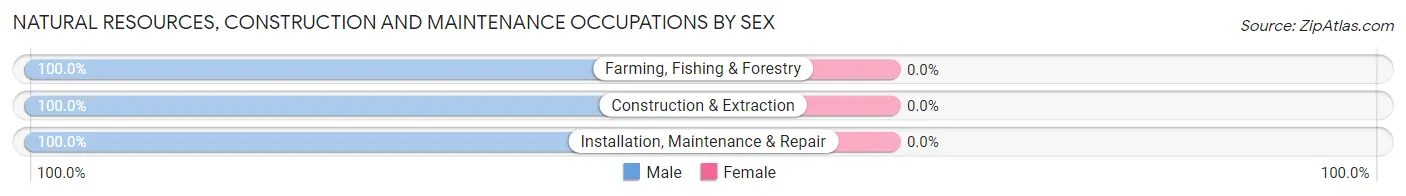
| Occupation | Male | Female |
| Farming, Fishing & Forestry | 23 (100.0%) | 0 (0.0%) |
| Construction & Extraction | 75 (100.0%) | 0 (0.0%) |
| Installation, Maintenance & Repair | 40 (100.0%) | 0 (0.0%) |
| Total (Category) | 138 (100.0%) | 0 (0.0%) |
| Total (Overall) | 711 (52.5%) | 642 (47.4%) |
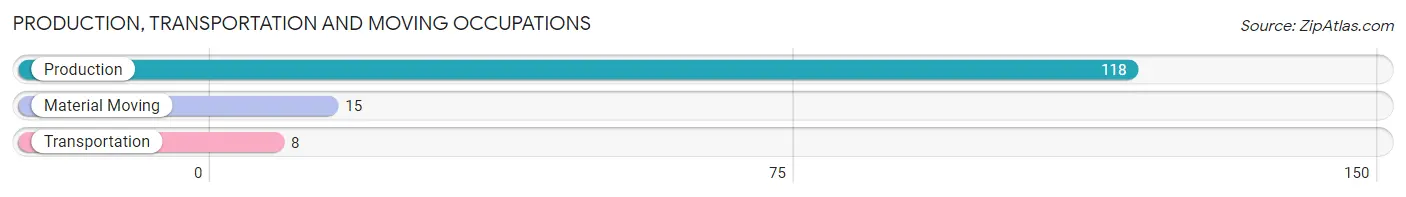
Production, Transportation and Moving Occupations
The most common Production, Transportation and Moving occupations in Adjuntas are Production (118 | 8.7%), Material Moving (15 | 1.1%), and Transportation (8 | 0.6%).
Production, Transportation and Moving Occupations by Sex
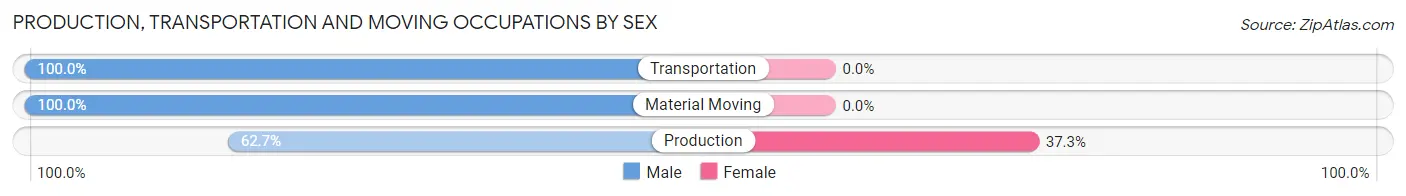
| Occupation | Male | Female |
| Production | 74 (62.7%) | 44 (37.3%) |
| Transportation | 8 (100.0%) | 0 (0.0%) |
| Material Moving | 15 (100.0%) | 0 (0.0%) |
| Total (Category) | 97 (68.8%) | 44 (31.2%) |
| Total (Overall) | 711 (52.5%) | 642 (47.4%) |
Employment Industries by Sex in Adjuntas
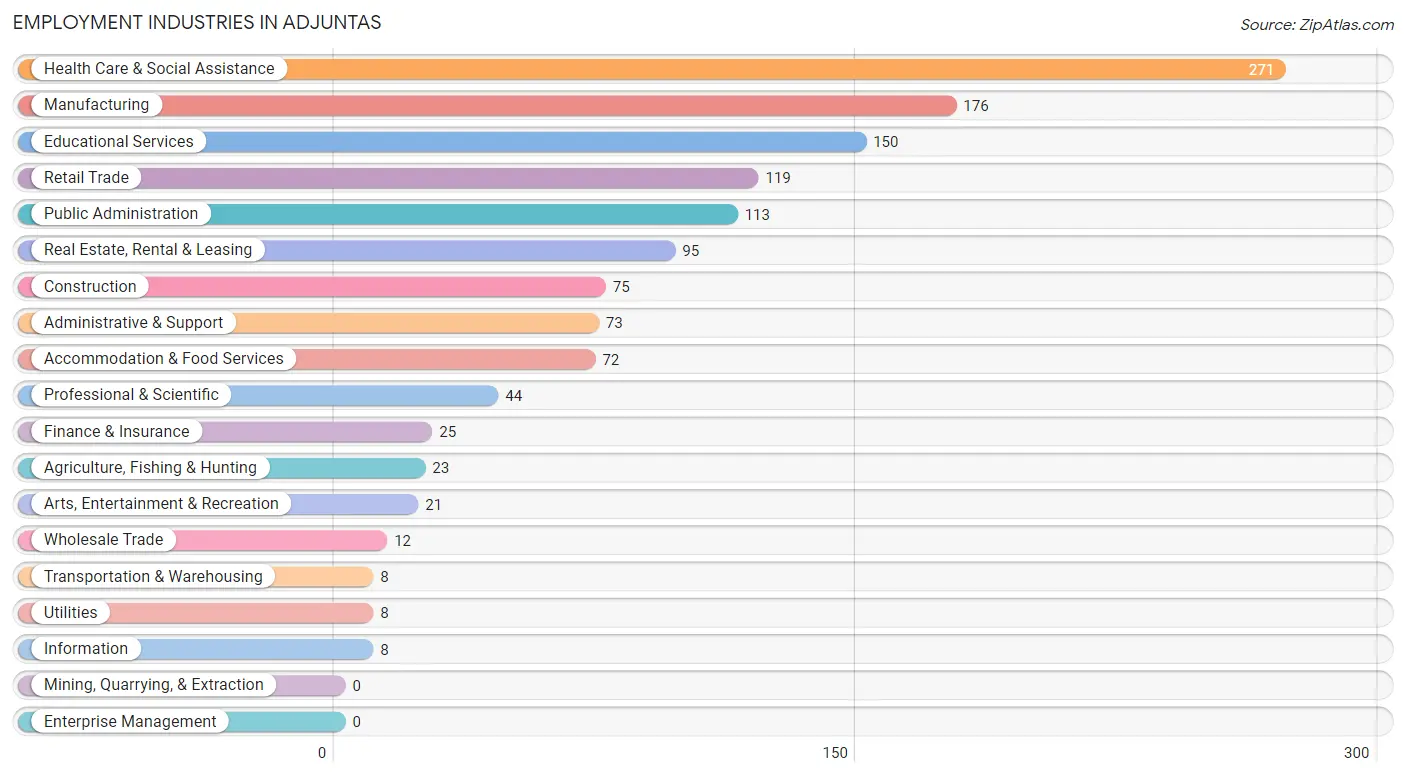
Employment Industries in Adjuntas
The major employment industries in Adjuntas include Health Care & Social Assistance (271 | 20.0%), Manufacturing (176 | 13.0%), Educational Services (150 | 11.1%), Retail Trade (119 | 8.8%), and Public Administration (113 | 8.4%).
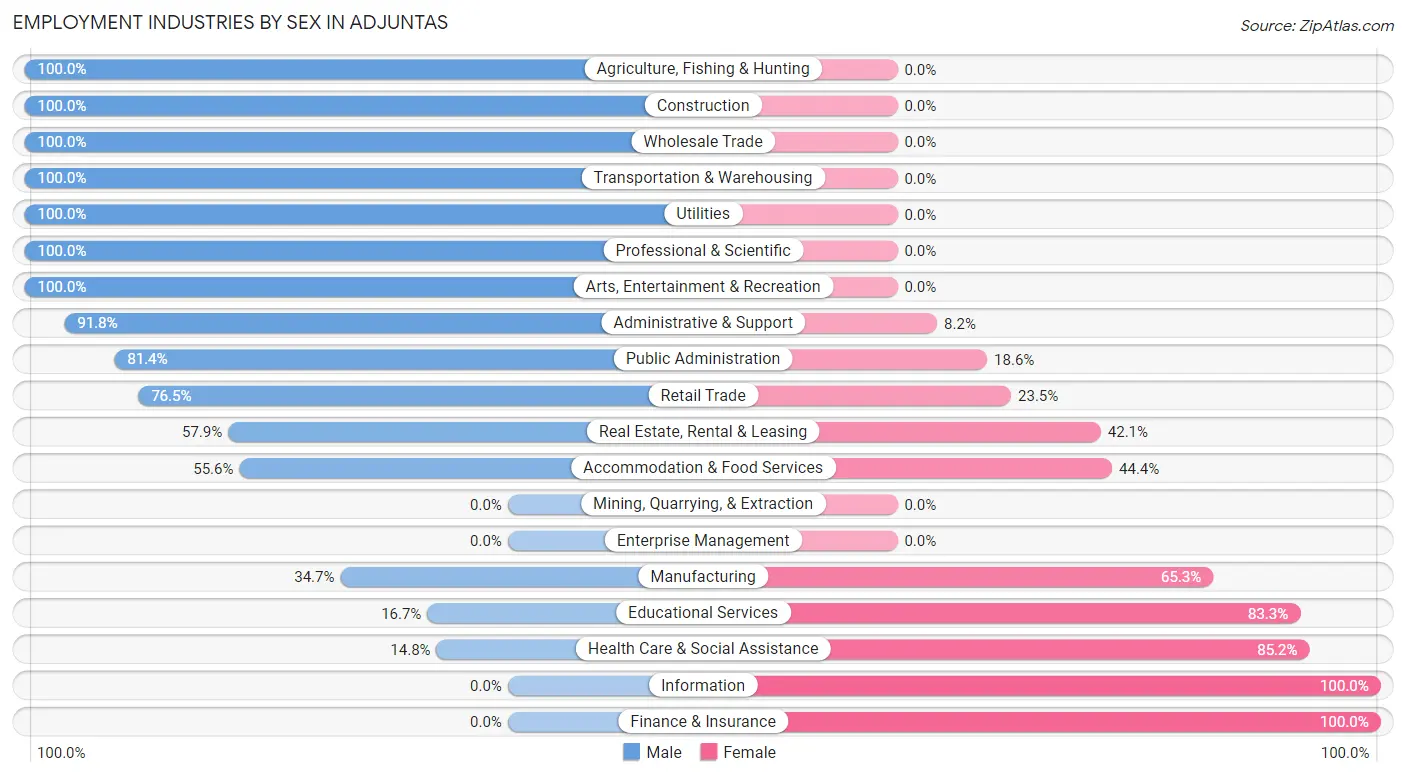
Employment Industries by Sex in Adjuntas
The Adjuntas industries that see more men than women are Agriculture, Fishing & Hunting (100.0%), Construction (100.0%), and Wholesale Trade (100.0%), whereas the industries that tend to have a higher number of women are Information (100.0%), Finance & Insurance (100.0%), and Health Care & Social Assistance (85.2%).
| Industry | Male | Female |
| Agriculture, Fishing & Hunting | 23 (100.0%) | 0 (0.0%) |
| Mining, Quarrying, & Extraction | 0 (0.0%) | 0 (0.0%) |
| Construction | 75 (100.0%) | 0 (0.0%) |
| Manufacturing | 61 (34.7%) | 115 (65.3%) |
| Wholesale Trade | 12 (100.0%) | 0 (0.0%) |
| Retail Trade | 91 (76.5%) | 28 (23.5%) |
| Transportation & Warehousing | 8 (100.0%) | 0 (0.0%) |
| Utilities | 8 (100.0%) | 0 (0.0%) |
| Information | 0 (0.0%) | 8 (100.0%) |
| Finance & Insurance | 0 (0.0%) | 25 (100.0%) |
| Real Estate, Rental & Leasing | 55 (57.9%) | 40 (42.1%) |
| Professional & Scientific | 44 (100.0%) | 0 (0.0%) |
| Enterprise Management | 0 (0.0%) | 0 (0.0%) |
| Administrative & Support | 67 (91.8%) | 6 (8.2%) |
| Educational Services | 25 (16.7%) | 125 (83.3%) |
| Health Care & Social Assistance | 40 (14.8%) | 231 (85.2%) |
| Arts, Entertainment & Recreation | 21 (100.0%) | 0 (0.0%) |
| Accommodation & Food Services | 40 (55.6%) | 32 (44.4%) |
| Public Administration | 92 (81.4%) | 21 (18.6%) |
| Total | 711 (52.5%) | 642 (47.4%) |
Education in Adjuntas
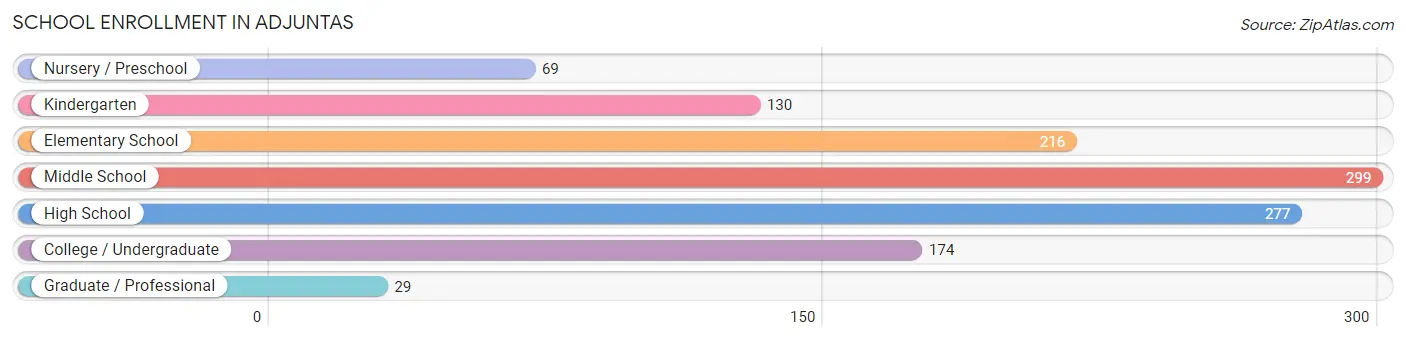
School Enrollment in Adjuntas
The most common levels of schooling among the 1,194 students in Adjuntas are middle school (299 | 25.0%), high school (277 | 23.2%), and elementary school (216 | 18.1%).
| School Level | # Students | % Students |
| Nursery / Preschool | 69 | 5.8% |
| Kindergarten | 130 | 10.9% |
| Elementary School | 216 | 18.1% |
| Middle School | 299 | 25.0% |
| High School | 277 | 23.2% |
| College / Undergraduate | 174 | 14.6% |
| Graduate / Professional | 29 | 2.4% |
| Total | 1,194 | 100.0% |
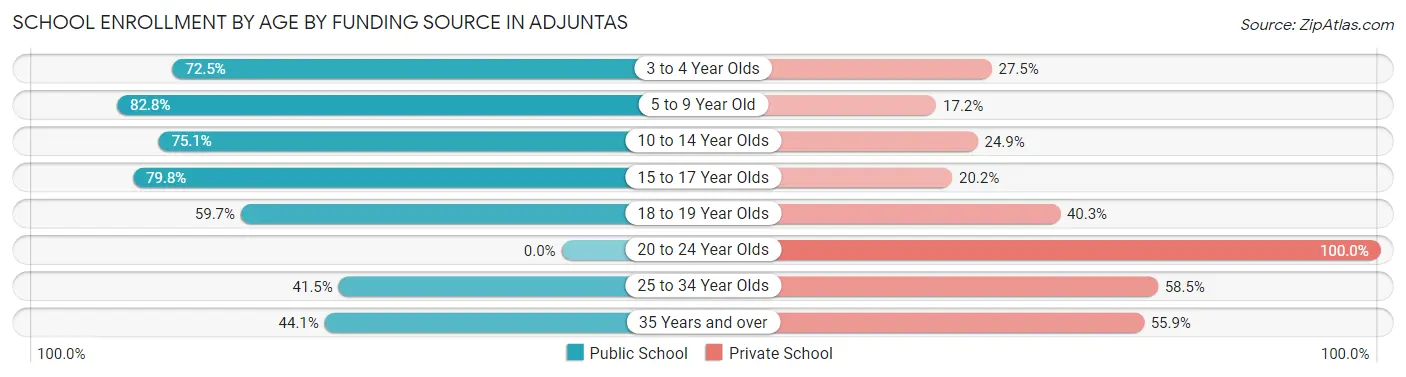
School Enrollment by Age by Funding Source in Adjuntas
Out of a total of 1,194 students who are enrolled in schools in Adjuntas, 359 (30.1%) attend a private institution, while the remaining 835 (69.9%) are enrolled in public schools. The age group of 20 to 24 year olds has the highest likelihood of being enrolled in private schools, with 71 (100.0% in the age bracket) enrolled. Conversely, the age group of 5 to 9 year old has the lowest likelihood of being enrolled in a private school, with 250 (82.8% in the age bracket) attending a public institution.
| Age Bracket | Public School | Private School |
| 3 to 4 Year Olds | 50 (72.5%) | 19 (27.5%) |
| 5 to 9 Year Old | 250 (82.8%) | 52 (17.2%) |
| 10 to 14 Year Olds | 289 (75.1%) | 96 (24.9%) |
| 15 to 17 Year Olds | 166 (79.8%) | 42 (20.2%) |
| 18 to 19 Year Olds | 43 (59.7%) | 29 (40.3%) |
| 20 to 24 Year Olds | 0 (0.0%) | 71 (100.0%) |
| 25 to 34 Year Olds | 22 (41.5%) | 31 (58.5%) |
| 35 Years and over | 15 (44.1%) | 19 (55.9%) |
| Total | 835 (69.9%) | 359 (30.1%) |
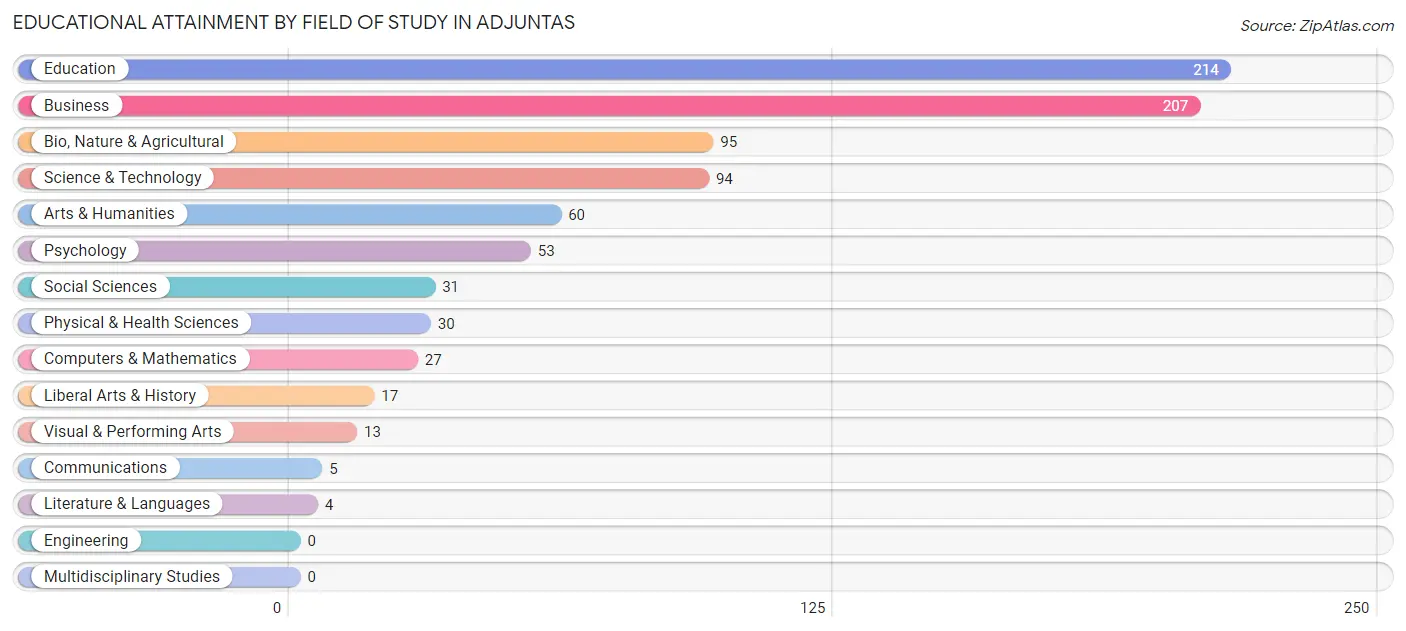
Educational Attainment by Field of Study in Adjuntas
Education (214 | 25.2%), business (207 | 24.3%), bio, nature & agricultural (95 | 11.2%), science & technology (94 | 11.1%), and arts & humanities (60 | 7.1%) are the most common fields of study among 850 individuals in Adjuntas who have obtained a bachelor's degree or higher.
| Field of Study | # Graduates | % Graduates |
| Computers & Mathematics | 27 | 3.2% |
| Bio, Nature & Agricultural | 95 | 11.2% |
| Physical & Health Sciences | 30 | 3.5% |
| Psychology | 53 | 6.2% |
| Social Sciences | 31 | 3.6% |
| Engineering | 0 | 0.0% |
| Multidisciplinary Studies | 0 | 0.0% |
| Science & Technology | 94 | 11.1% |
| Business | 207 | 24.3% |
| Education | 214 | 25.2% |
| Literature & Languages | 4 | 0.5% |
| Liberal Arts & History | 17 | 2.0% |
| Visual & Performing Arts | 13 | 1.5% |
| Communications | 5 | 0.6% |
| Arts & Humanities | 60 | 7.1% |
| Total | 850 | 100.0% |
Transportation & Commute in Adjuntas
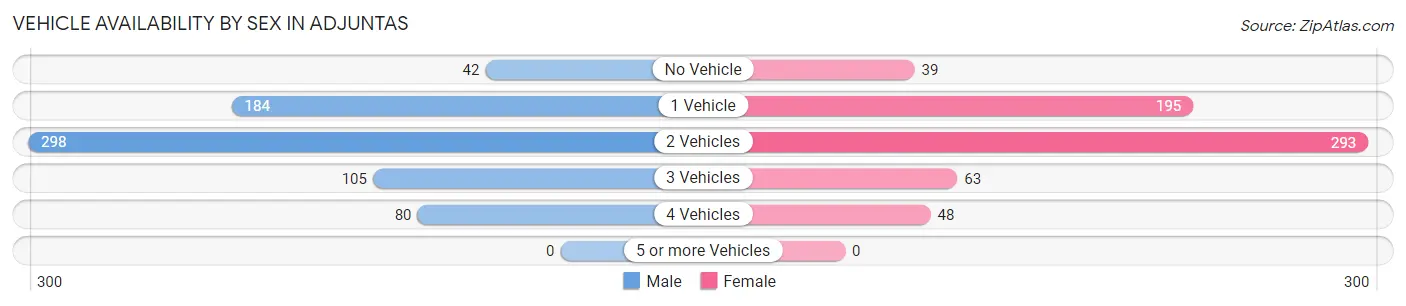
Vehicle Availability by Sex in Adjuntas
The most prevalent vehicle ownership categories in Adjuntas are males with 2 vehicles (298, accounting for 42.0%) and females with 2 vehicles (293, making up 46.7%).
| Vehicles Available | Male | Female |
| No Vehicle | 42 (5.9%) | 39 (6.1%) |
| 1 Vehicle | 184 (26.0%) | 195 (30.6%) |
| 2 Vehicles | 298 (42.0%) | 293 (45.9%) |
| 3 Vehicles | 105 (14.8%) | 63 (9.9%) |
| 4 Vehicles | 80 (11.3%) | 48 (7.5%) |
| 5 or more Vehicles | 0 (0.0%) | 0 (0.0%) |
| Total | 709 (100.0%) | 638 (100.0%) |
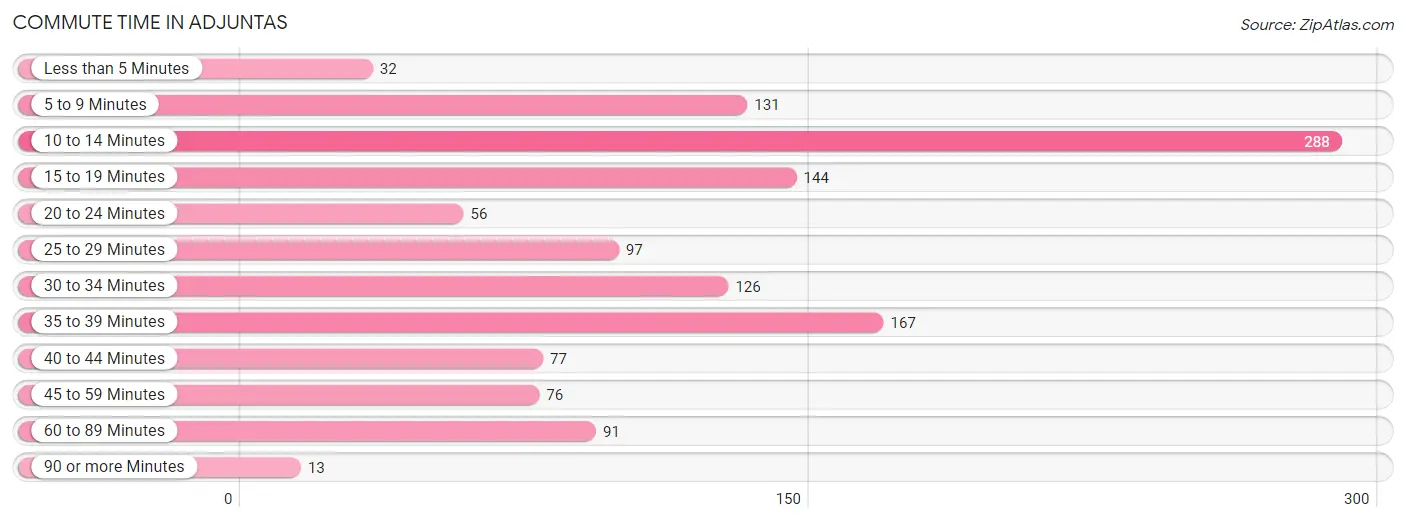
Commute Time in Adjuntas
The most frequently occuring commute durations in Adjuntas are 10 to 14 minutes (288 commuters, 22.2%), 35 to 39 minutes (167 commuters, 12.9%), and 15 to 19 minutes (144 commuters, 11.1%).
| Commute Time | # Commuters | % Commuters |
| Less than 5 Minutes | 32 | 2.5% |
| 5 to 9 Minutes | 131 | 10.1% |
| 10 to 14 Minutes | 288 | 22.2% |
| 15 to 19 Minutes | 144 | 11.1% |
| 20 to 24 Minutes | 56 | 4.3% |
| 25 to 29 Minutes | 97 | 7.5% |
| 30 to 34 Minutes | 126 | 9.7% |
| 35 to 39 Minutes | 167 | 12.9% |
| 40 to 44 Minutes | 77 | 5.9% |
| 45 to 59 Minutes | 76 | 5.9% |
| 60 to 89 Minutes | 91 | 7.0% |
| 90 or more Minutes | 13 | 1.0% |
Commute Time by Sex in Adjuntas
The most common commute times in Adjuntas are 10 to 14 minutes (177 commuters, 25.4%) for males and 35 to 39 minutes (133 commuters, 22.2%) for females.
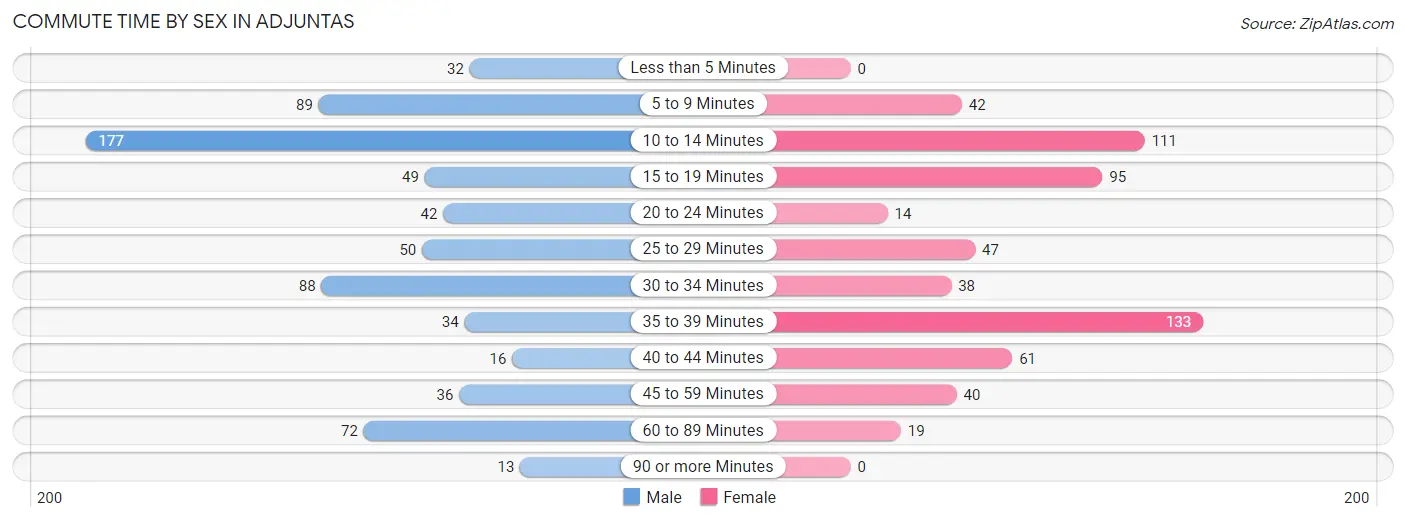
| Commute Time | Male | Female |
| Less than 5 Minutes | 32 (4.6%) | 0 (0.0%) |
| 5 to 9 Minutes | 89 (12.8%) | 42 (7.0%) |
| 10 to 14 Minutes | 177 (25.4%) | 111 (18.5%) |
| 15 to 19 Minutes | 49 (7.0%) | 95 (15.8%) |
| 20 to 24 Minutes | 42 (6.0%) | 14 (2.3%) |
| 25 to 29 Minutes | 50 (7.2%) | 47 (7.8%) |
| 30 to 34 Minutes | 88 (12.6%) | 38 (6.3%) |
| 35 to 39 Minutes | 34 (4.9%) | 133 (22.2%) |
| 40 to 44 Minutes | 16 (2.3%) | 61 (10.2%) |
| 45 to 59 Minutes | 36 (5.2%) | 40 (6.7%) |
| 60 to 89 Minutes | 72 (10.3%) | 19 (3.2%) |
| 90 or more Minutes | 13 (1.9%) | 0 (0.0%) |
Time of Departure to Work by Sex in Adjuntas
The most frequent times of departure to work in Adjuntas are 7:00 AM to 7:29 AM (190, 27.2%) for males and 7:30 AM to 7:59 AM (214, 35.7%) for females.
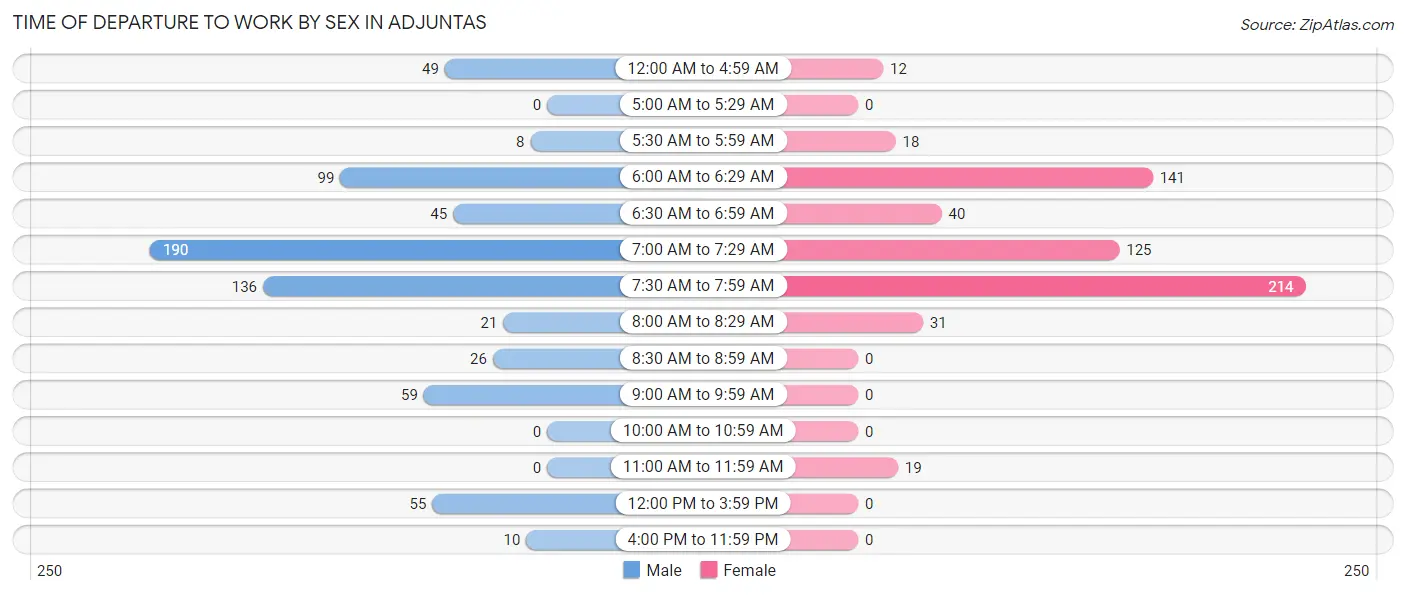
| Time of Departure | Male | Female |
| 12:00 AM to 4:59 AM | 49 (7.0%) | 12 (2.0%) |
| 5:00 AM to 5:29 AM | 0 (0.0%) | 0 (0.0%) |
| 5:30 AM to 5:59 AM | 8 (1.1%) | 18 (3.0%) |
| 6:00 AM to 6:29 AM | 99 (14.2%) | 141 (23.5%) |
| 6:30 AM to 6:59 AM | 45 (6.5%) | 40 (6.7%) |
| 7:00 AM to 7:29 AM | 190 (27.2%) | 125 (20.8%) |
| 7:30 AM to 7:59 AM | 136 (19.5%) | 214 (35.7%) |
| 8:00 AM to 8:29 AM | 21 (3.0%) | 31 (5.2%) |
| 8:30 AM to 8:59 AM | 26 (3.7%) | 0 (0.0%) |
| 9:00 AM to 9:59 AM | 59 (8.5%) | 0 (0.0%) |
| 10:00 AM to 10:59 AM | 0 (0.0%) | 0 (0.0%) |
| 11:00 AM to 11:59 AM | 0 (0.0%) | 19 (3.2%) |
| 12:00 PM to 3:59 PM | 55 (7.9%) | 0 (0.0%) |
| 4:00 PM to 11:59 PM | 10 (1.4%) | 0 (0.0%) |
| Total | 698 (100.0%) | 600 (100.0%) |
Housing Occupancy in Adjuntas
Occupancy by Ownership in Adjuntas
Of the total 1,503 dwellings in Adjuntas, owner-occupied units account for 811 (54.0%), while renter-occupied units make up 692 (46.0%).
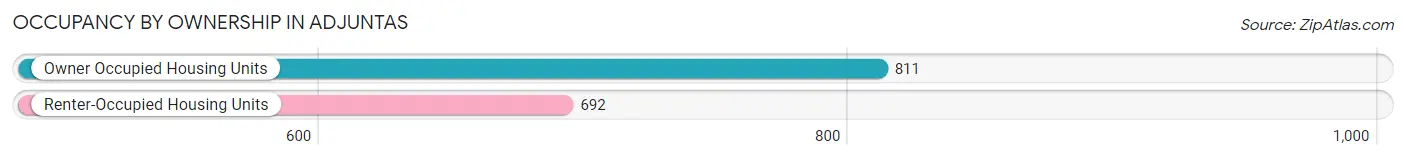
| Occupancy | # Housing Units | % Housing Units |
| Owner Occupied Housing Units | 811 | 54.0% |
| Renter-Occupied Housing Units | 692 | 46.0% |
| Total Occupied Housing Units | 1,503 | 100.0% |
Occupancy by Household Size in Adjuntas
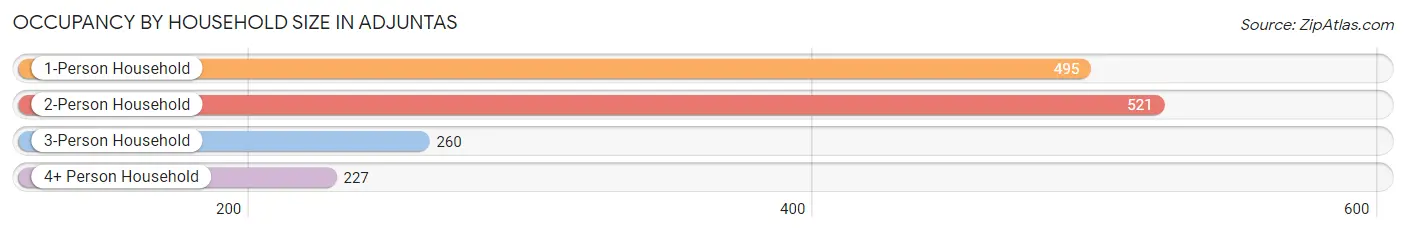
| Household Size | # Housing Units | % Housing Units |
| 1-Person Household | 495 | 32.9% |
| 2-Person Household | 521 | 34.7% |
| 3-Person Household | 260 | 17.3% |
| 4+ Person Household | 227 | 15.1% |
| Total Housing Units | 1,503 | 100.0% |
Occupancy by Ownership by Household Size in Adjuntas
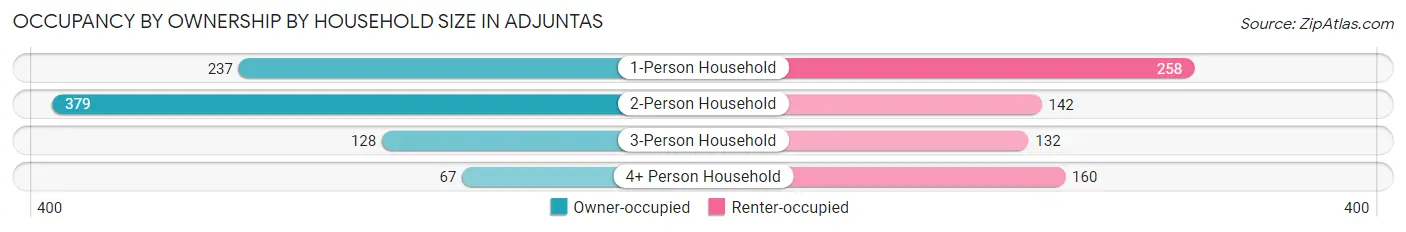
| Household Size | Owner-occupied | Renter-occupied |
| 1-Person Household | 237 (47.9%) | 258 (52.1%) |
| 2-Person Household | 379 (72.7%) | 142 (27.3%) |
| 3-Person Household | 128 (49.2%) | 132 (50.8%) |
| 4+ Person Household | 67 (29.5%) | 160 (70.5%) |
| Total Housing Units | 811 (54.0%) | 692 (46.0%) |
Occupancy by Educational Attainment in Adjuntas
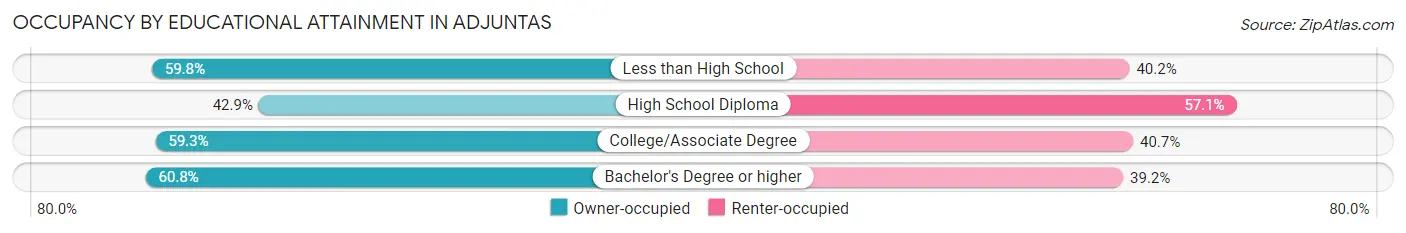
| Household Size | Owner-occupied | Renter-occupied |
| Less than High School | 204 (59.8%) | 137 (40.2%) |
| High School Diploma | 228 (42.9%) | 304 (57.1%) |
| College/Associate Degree | 160 (59.3%) | 110 (40.7%) |
| Bachelor's Degree or higher | 219 (60.8%) | 141 (39.2%) |
Occupancy by Age of Householder in Adjuntas
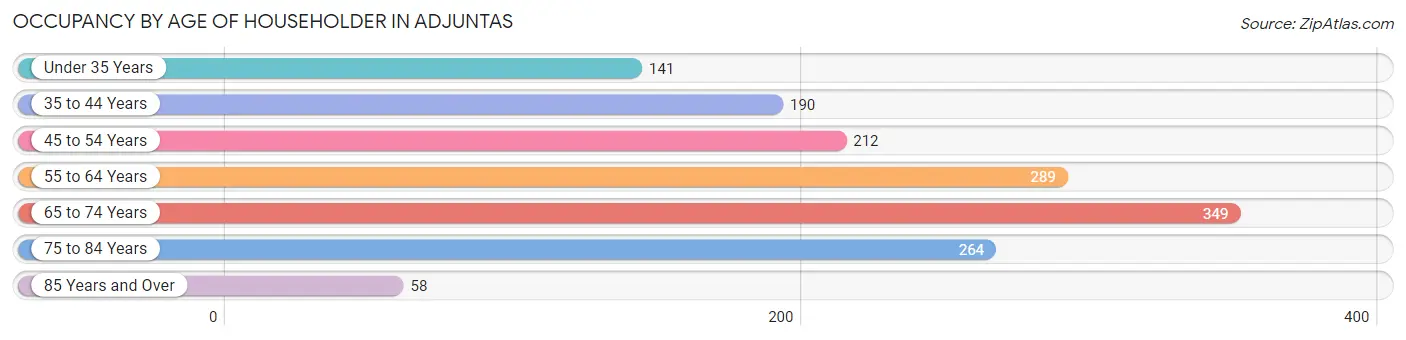
| Age Bracket | # Households | % Households |
| Under 35 Years | 141 | 9.4% |
| 35 to 44 Years | 190 | 12.6% |
| 45 to 54 Years | 212 | 14.1% |
| 55 to 64 Years | 289 | 19.2% |
| 65 to 74 Years | 349 | 23.2% |
| 75 to 84 Years | 264 | 17.6% |
| 85 Years and Over | 58 | 3.9% |
| Total | 1,503 | 100.0% |
Housing Finances in Adjuntas
Median Income by Occupancy in Adjuntas
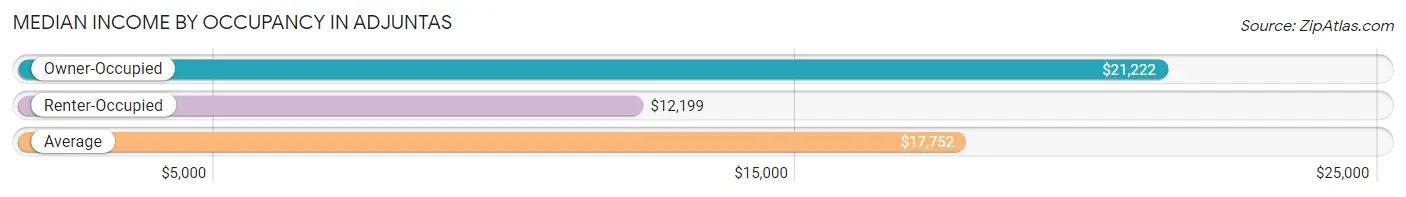
| Occupancy Type | # Households | Median Income |
| Owner-Occupied | 811 (54.0%) | $21,222 |
| Renter-Occupied | 692 (46.0%) | $12,199 |
| Average | 1,503 (100.0%) | $17,752 |
Occupancy by Householder Income Bracket in Adjuntas
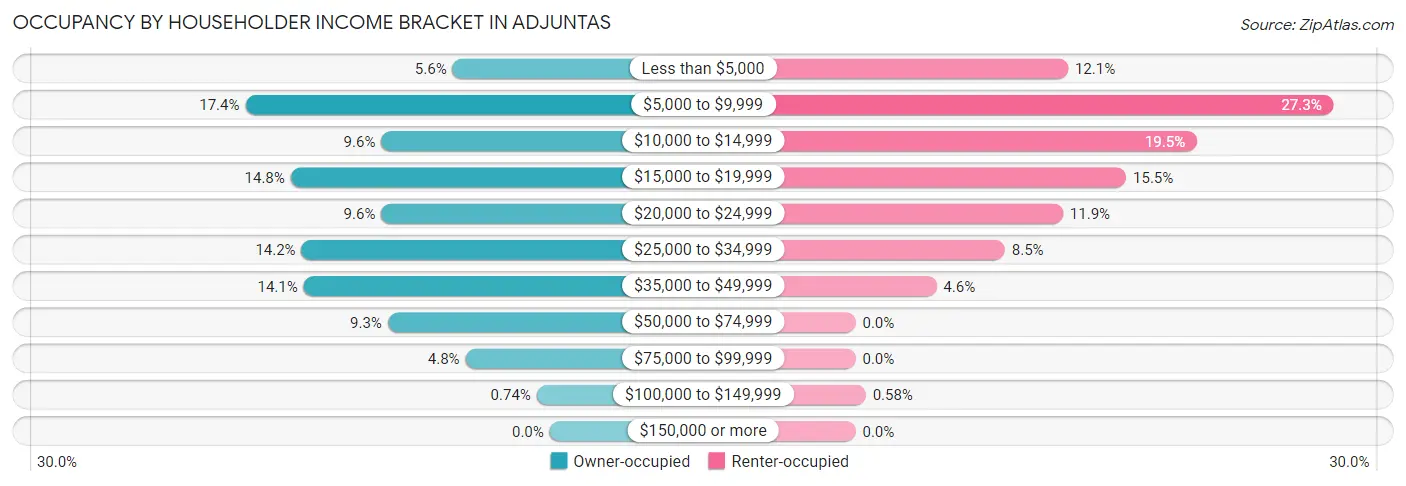
| Income Bracket | Owner-occupied | Renter-occupied |
| Less than $5,000 | 45 (5.6%) | 84 (12.1%) |
| $5,000 to $9,999 | 141 (17.4%) | 189 (27.3%) |
| $10,000 to $14,999 | 78 (9.6%) | 135 (19.5%) |
| $15,000 to $19,999 | 120 (14.8%) | 107 (15.5%) |
| $20,000 to $24,999 | 78 (9.6%) | 82 (11.8%) |
| $25,000 to $34,999 | 115 (14.2%) | 59 (8.5%) |
| $35,000 to $49,999 | 114 (14.1%) | 32 (4.6%) |
| $50,000 to $74,999 | 75 (9.2%) | 0 (0.0%) |
| $75,000 to $99,999 | 39 (4.8%) | 0 (0.0%) |
| $100,000 to $149,999 | 6 (0.7%) | 4 (0.6%) |
| $150,000 or more | 0 (0.0%) | 0 (0.0%) |
| Total | 811 (100.0%) | 692 (100.0%) |
Monthly Housing Cost Tiers in Adjuntas
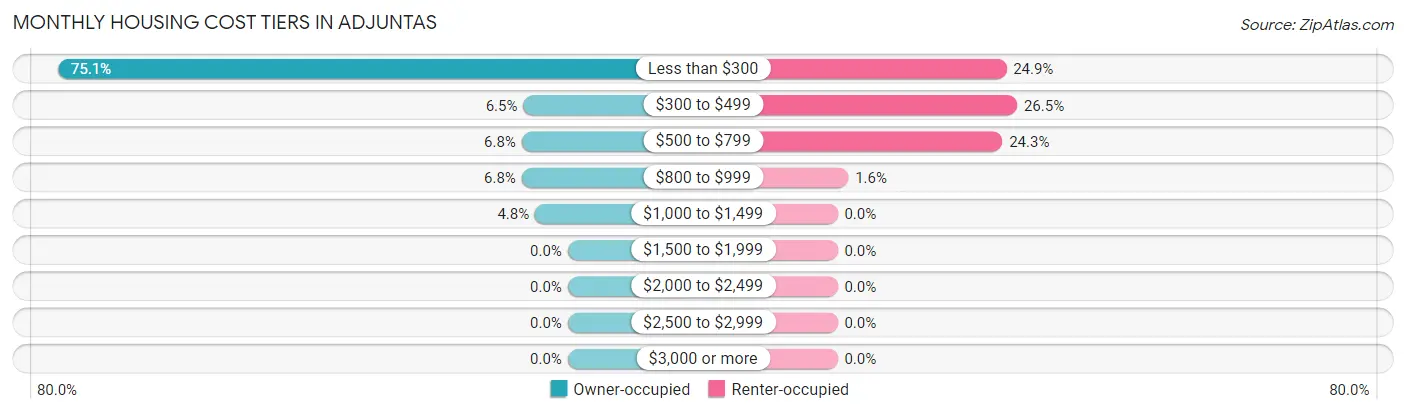
| Monthly Cost | Owner-occupied | Renter-occupied |
| Less than $300 | 609 (75.1%) | 172 (24.9%) |
| $300 to $499 | 53 (6.5%) | 183 (26.5%) |
| $500 to $799 | 55 (6.8%) | 168 (24.3%) |
| $800 to $999 | 55 (6.8%) | 11 (1.6%) |
| $1,000 to $1,499 | 39 (4.8%) | 0 (0.0%) |
| $1,500 to $1,999 | 0 (0.0%) | 0 (0.0%) |
| $2,000 to $2,499 | 0 (0.0%) | 0 (0.0%) |
| $2,500 to $2,999 | 0 (0.0%) | 0 (0.0%) |
| $3,000 or more | 0 (0.0%) | 0 (0.0%) |
| Total | 811 (100.0%) | 692 (100.0%) |
Physical Housing Characteristics in Adjuntas
Housing Structures in Adjuntas
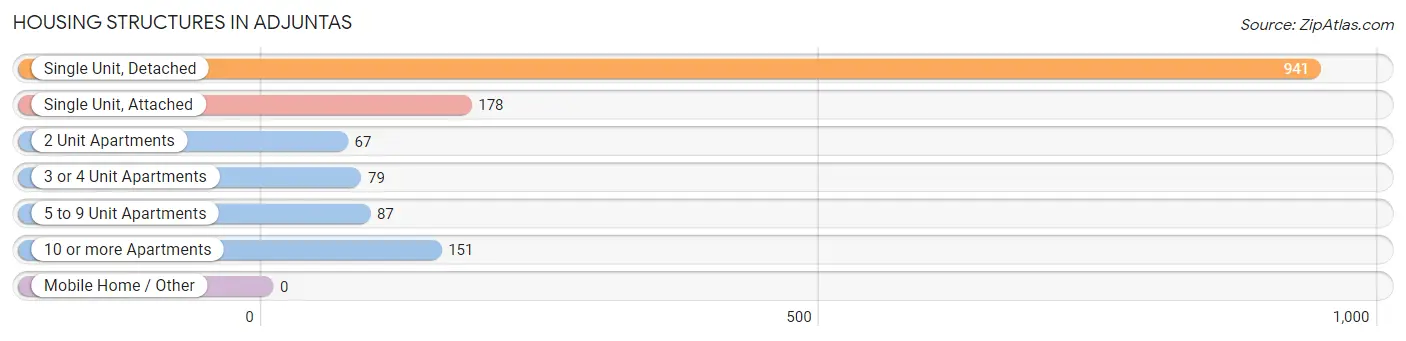
| Structure Type | # Housing Units | % Housing Units |
| Single Unit, Detached | 941 | 62.6% |
| Single Unit, Attached | 178 | 11.8% |
| 2 Unit Apartments | 67 | 4.5% |
| 3 or 4 Unit Apartments | 79 | 5.3% |
| 5 to 9 Unit Apartments | 87 | 5.8% |
| 10 or more Apartments | 151 | 10.1% |
| Mobile Home / Other | 0 | 0.0% |
| Total | 1,503 | 100.0% |
Housing Structures by Occupancy in Adjuntas
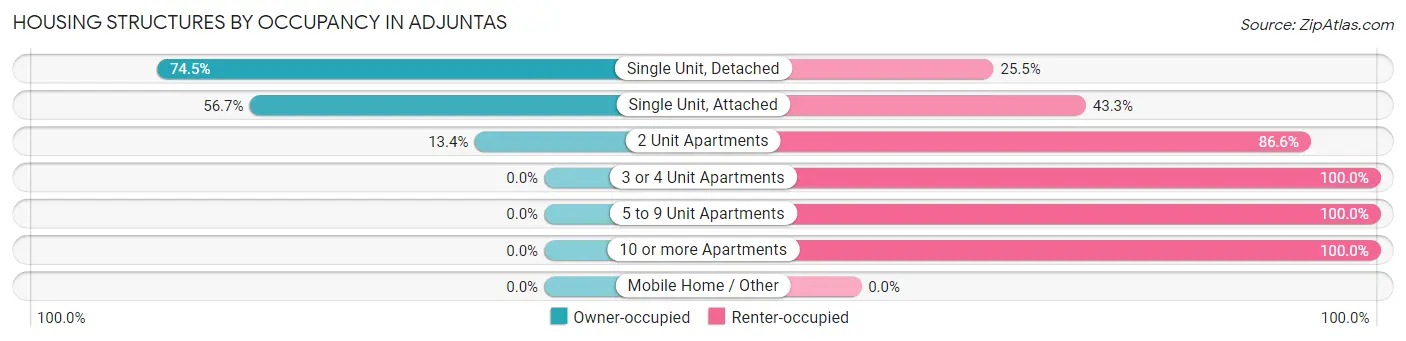
| Structure Type | Owner-occupied | Renter-occupied |
| Single Unit, Detached | 701 (74.5%) | 240 (25.5%) |
| Single Unit, Attached | 101 (56.7%) | 77 (43.3%) |
| 2 Unit Apartments | 9 (13.4%) | 58 (86.6%) |
| 3 or 4 Unit Apartments | 0 (0.0%) | 79 (100.0%) |
| 5 to 9 Unit Apartments | 0 (0.0%) | 87 (100.0%) |
| 10 or more Apartments | 0 (0.0%) | 151 (100.0%) |
| Mobile Home / Other | 0 (0.0%) | 0 (0.0%) |
| Total | 811 (54.0%) | 692 (46.0%) |
Housing Structures by Number of Rooms in Adjuntas
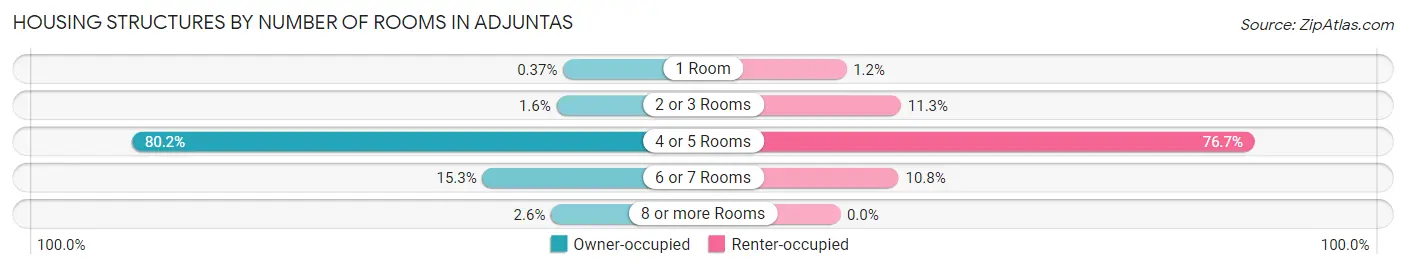
| Number of Rooms | Owner-occupied | Renter-occupied |
| 1 Room | 3 (0.4%) | 8 (1.2%) |
| 2 or 3 Rooms | 13 (1.6%) | 78 (11.3%) |
| 4 or 5 Rooms | 650 (80.1%) | 531 (76.7%) |
| 6 or 7 Rooms | 124 (15.3%) | 75 (10.8%) |
| 8 or more Rooms | 21 (2.6%) | 0 (0.0%) |
| Total | 811 (100.0%) | 692 (100.0%) |
Housing Structure by Heating Type in Adjuntas

| Heating Type | Owner-occupied | Renter-occupied |
| Utility Gas | 0 (0.0%) | 0 (0.0%) |
| Bottled, Tank, or LP Gas | 0 (0.0%) | 4 (0.6%) |
| Electricity | 66 (8.1%) | 65 (9.4%) |
| Fuel Oil or Kerosene | 0 (0.0%) | 0 (0.0%) |
| Coal or Coke | 0 (0.0%) | 0 (0.0%) |
| All other Fuels | 41 (5.1%) | 0 (0.0%) |
| No Fuel Used | 704 (86.8%) | 623 (90.0%) |
| Total | 811 (100.0%) | 692 (100.0%) |
Household Vehicle Usage in Adjuntas
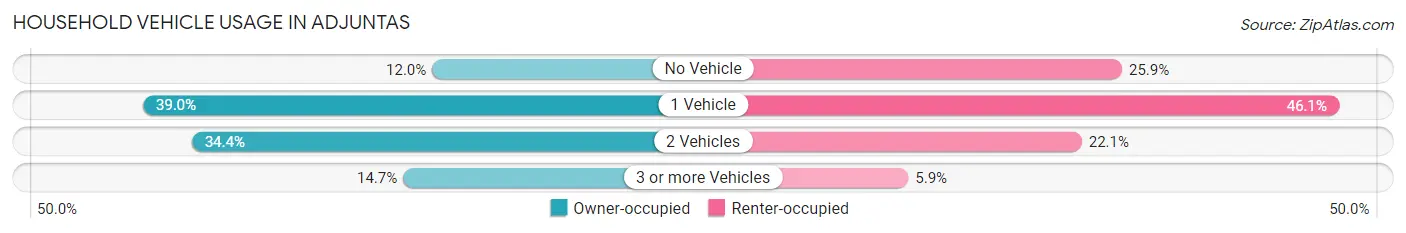
| Vehicles per Household | Owner-occupied | Renter-occupied |
| No Vehicle | 97 (12.0%) | 179 (25.9%) |
| 1 Vehicle | 316 (39.0%) | 319 (46.1%) |
| 2 Vehicles | 279 (34.4%) | 153 (22.1%) |
| 3 or more Vehicles | 119 (14.7%) | 41 (5.9%) |
| Total | 811 (100.0%) | 692 (100.0%) |
Real Estate & Mortgages in Adjuntas
Real Estate and Mortgage Overview in Adjuntas
| Characteristic | Without Mortgage | With Mortgage |
| Housing Units | 647 | 164 |
| Median Property Value | $95,400 | $129,600 |
| Median Household Income | $19,512 | $0 |
| Monthly Housing Costs | $150 | $0 |
| Real Estate Taxes | - | - |
Property Value by Mortgage Status in Adjuntas
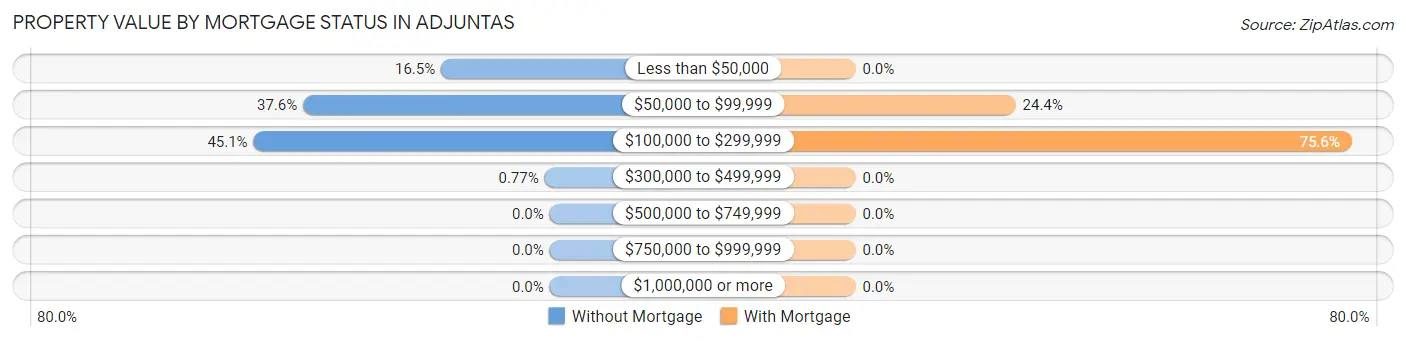
| Property Value | Without Mortgage | With Mortgage |
| Less than $50,000 | 107 (16.5%) | 0 (0.0%) |
| $50,000 to $99,999 | 243 (37.6%) | 40 (24.4%) |
| $100,000 to $299,999 | 292 (45.1%) | 124 (75.6%) |
| $300,000 to $499,999 | 5 (0.8%) | 0 (0.0%) |
| $500,000 to $749,999 | 0 (0.0%) | 0 (0.0%) |
| $750,000 to $999,999 | 0 (0.0%) | 0 (0.0%) |
| $1,000,000 or more | 0 (0.0%) | 0 (0.0%) |
| Total | 647 (100.0%) | 164 (100.0%) |
Household Income by Mortgage Status in Adjuntas
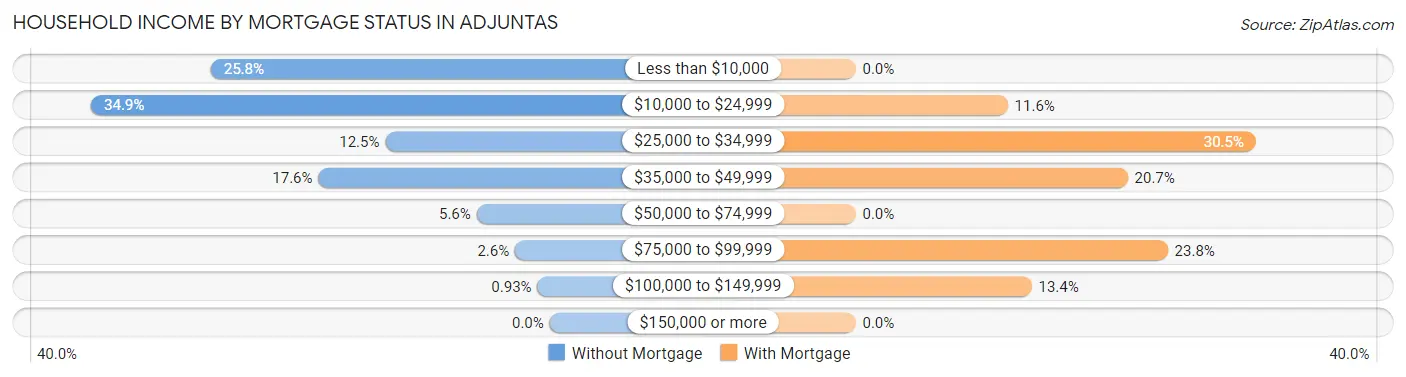
| Household Income | Without Mortgage | With Mortgage |
| Less than $10,000 | 167 (25.8%) | 0 (0.0%) |
| $10,000 to $24,999 | 226 (34.9%) | 19 (11.6%) |
| $25,000 to $34,999 | 81 (12.5%) | 50 (30.5%) |
| $35,000 to $49,999 | 114 (17.6%) | 34 (20.7%) |
| $50,000 to $74,999 | 36 (5.6%) | 0 (0.0%) |
| $75,000 to $99,999 | 17 (2.6%) | 39 (23.8%) |
| $100,000 to $149,999 | 6 (0.9%) | 22 (13.4%) |
| $150,000 or more | 0 (0.0%) | 0 (0.0%) |
| Total | 647 (100.0%) | 164 (100.0%) |
Property Value to Household Income Ratio in Adjuntas
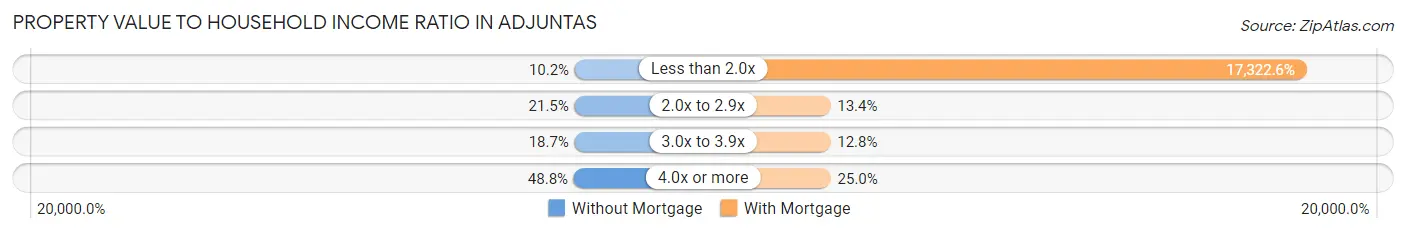
| Value-to-Income Ratio | Without Mortgage | With Mortgage |
| Less than 2.0x | 66 (10.2%) | 28,409 (17,322.6%) |
| 2.0x to 2.9x | 139 (21.5%) | 22 (13.4%) |
| 3.0x to 3.9x | 121 (18.7%) | 21 (12.8%) |
| 4.0x or more | 316 (48.8%) | 41 (25.0%) |
| Total | 647 (100.0%) | 164 (100.0%) |
Real Estate Taxes by Mortgage Status in Adjuntas
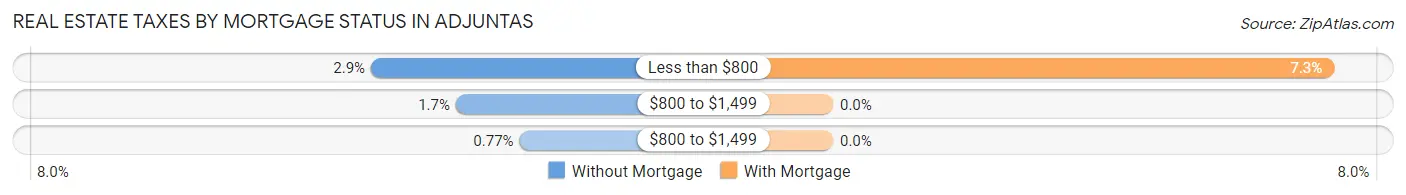
| Property Taxes | Without Mortgage | With Mortgage |
| Less than $800 | 19 (2.9%) | 12 (7.3%) |
| $800 to $1,499 | 11 (1.7%) | 0 (0.0%) |
| $800 to $1,499 | 5 (0.8%) | 0 (0.0%) |
| Total | 647 (100.0%) | 164 (100.0%) |
Health & Disability in Adjuntas
Health Insurance Coverage by Age in Adjuntas
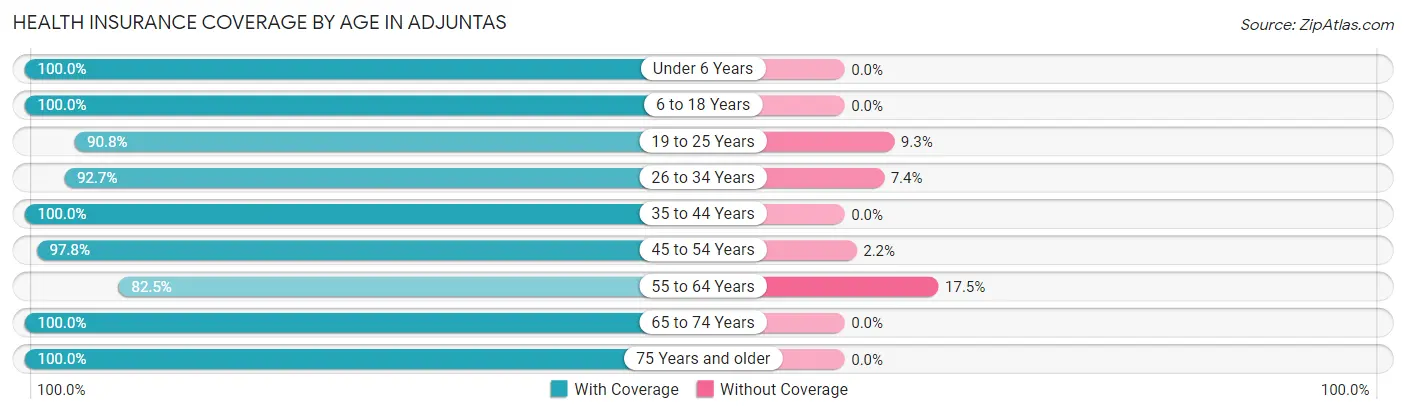
| Age Bracket | With Coverage | Without Coverage |
| Under 6 Years | 187 (100.0%) | 0 (0.0%) |
| 6 to 18 Years | 903 (100.0%) | 0 (0.0%) |
| 19 to 25 Years | 265 (90.7%) | 27 (9.2%) |
| 26 to 34 Years | 567 (92.6%) | 45 (7.3%) |
| 35 to 44 Years | 548 (100.0%) | 0 (0.0%) |
| 45 to 54 Years | 527 (97.8%) | 12 (2.2%) |
| 55 to 64 Years | 448 (82.5%) | 95 (17.5%) |
| 65 to 74 Years | 629 (100.0%) | 0 (0.0%) |
| 75 Years and older | 512 (100.0%) | 0 (0.0%) |
| Total | 4,586 (96.2%) | 179 (3.8%) |
Health Insurance Coverage by Citizenship Status in Adjuntas
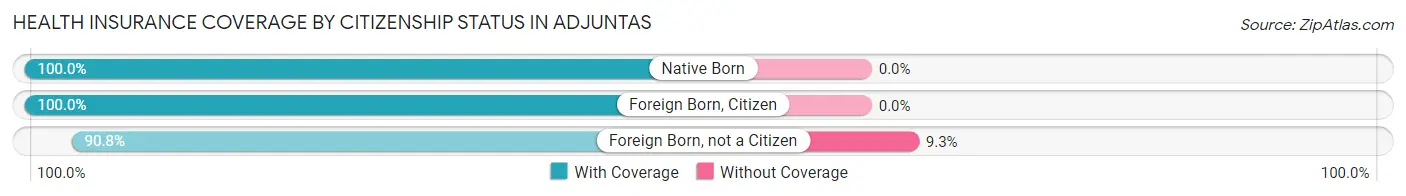
| Citizenship Status | With Coverage | Without Coverage |
| Native Born | 187 (100.0%) | 0 (0.0%) |
| Foreign Born, Citizen | 903 (100.0%) | 0 (0.0%) |
| Foreign Born, not a Citizen | 265 (90.7%) | 27 (9.2%) |
Health Insurance Coverage by Household Income in Adjuntas
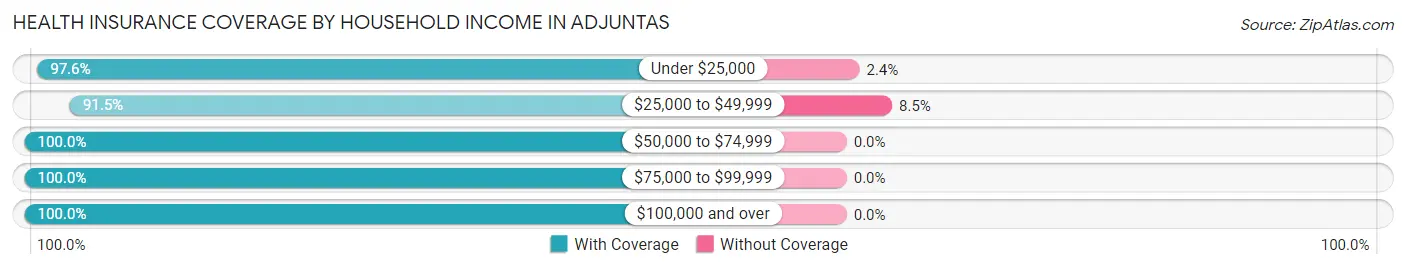
| Household Income | With Coverage | Without Coverage |
| Under $25,000 | 3,058 (97.6%) | 75 (2.4%) |
| $25,000 to $49,999 | 1,121 (91.5%) | 104 (8.5%) |
| $50,000 to $74,999 | 209 (100.0%) | 0 (0.0%) |
| $75,000 to $99,999 | 131 (100.0%) | 0 (0.0%) |
| $100,000 and over | 45 (100.0%) | 0 (0.0%) |
Public vs Private Health Insurance Coverage by Age in Adjuntas
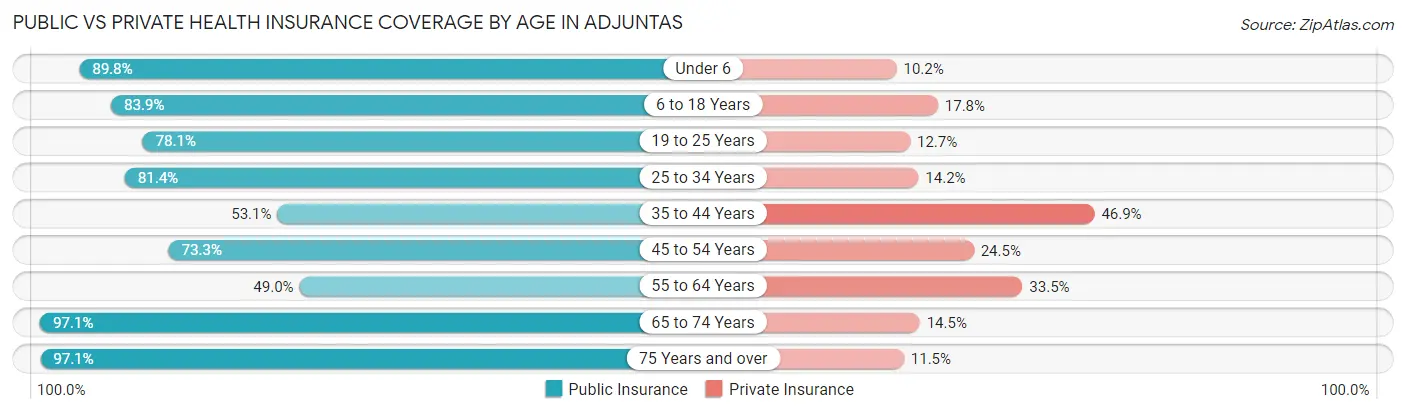
| Age Bracket | Public Insurance | Private Insurance |
| Under 6 | 168 (89.8%) | 19 (10.2%) |
| 6 to 18 Years | 758 (83.9%) | 161 (17.8%) |
| 19 to 25 Years | 228 (78.1%) | 37 (12.7%) |
| 25 to 34 Years | 498 (81.4%) | 87 (14.2%) |
| 35 to 44 Years | 291 (53.1%) | 257 (46.9%) |
| 45 to 54 Years | 395 (73.3%) | 132 (24.5%) |
| 55 to 64 Years | 266 (49.0%) | 182 (33.5%) |
| 65 to 74 Years | 611 (97.1%) | 91 (14.5%) |
| 75 Years and over | 497 (97.1%) | 59 (11.5%) |
| Total | 3,712 (77.9%) | 1,025 (21.5%) |
Disability Status by Sex by Age in Adjuntas
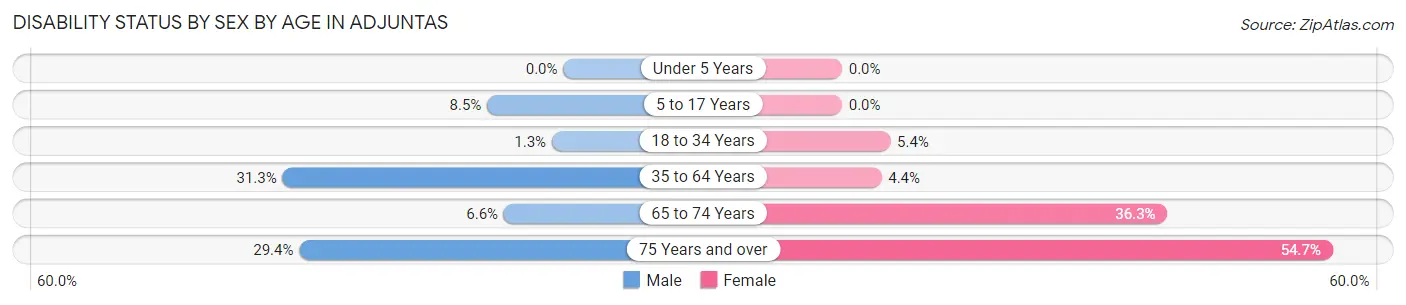
| Age Bracket | Male | Female |
| Under 5 Years | 0 (0.0%) | 0 (0.0%) |
| 5 to 17 Years | 38 (8.5%) | 0 (0.0%) |
| 18 to 34 Years | 5 (1.3%) | 31 (5.4%) |
| 35 to 64 Years | 268 (31.3%) | 34 (4.4%) |
| 65 to 74 Years | 19 (6.6%) | 124 (36.3%) |
| 75 Years and over | 50 (29.4%) | 187 (54.7%) |
Disability Class by Sex by Age in Adjuntas
Disability Class: Hearing Difficulty
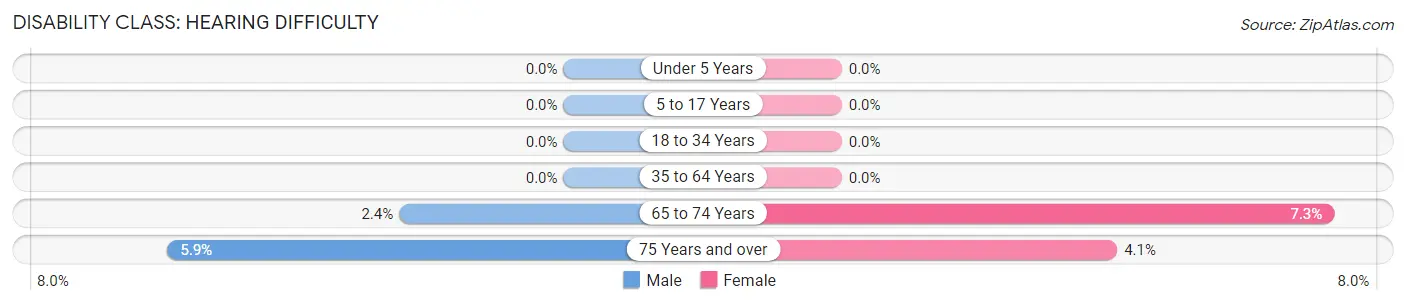
| Age Bracket | Male | Female |
| Under 5 Years | 0 (0.0%) | 0 (0.0%) |
| 5 to 17 Years | 0 (0.0%) | 0 (0.0%) |
| 18 to 34 Years | 0 (0.0%) | 0 (0.0%) |
| 35 to 64 Years | 0 (0.0%) | 0 (0.0%) |
| 65 to 74 Years | 7 (2.4%) | 25 (7.3%) |
| 75 Years and over | 10 (5.9%) | 14 (4.1%) |
Disability Class: Vision Difficulty
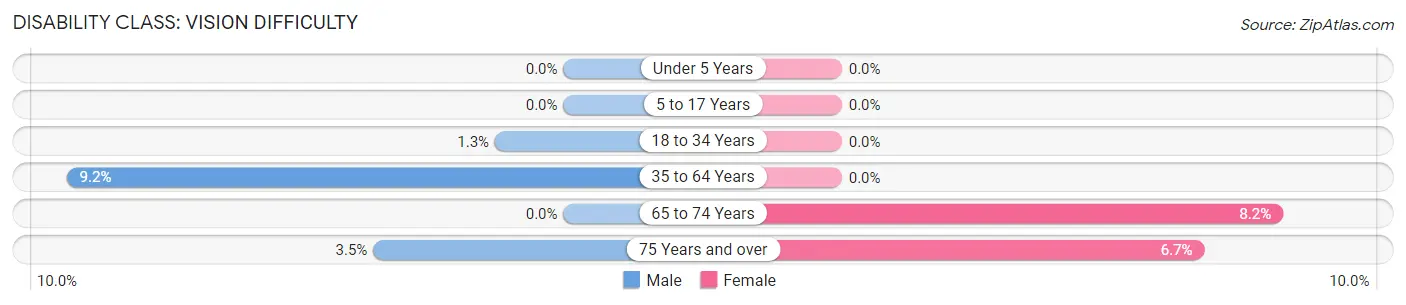
| Age Bracket | Male | Female |
| Under 5 Years | 0 (0.0%) | 0 (0.0%) |
| 5 to 17 Years | 0 (0.0%) | 0 (0.0%) |
| 18 to 34 Years | 5 (1.3%) | 0 (0.0%) |
| 35 to 64 Years | 79 (9.2%) | 0 (0.0%) |
| 65 to 74 Years | 0 (0.0%) | 28 (8.2%) |
| 75 Years and over | 6 (3.5%) | 23 (6.7%) |
Disability Class: Cognitive Difficulty
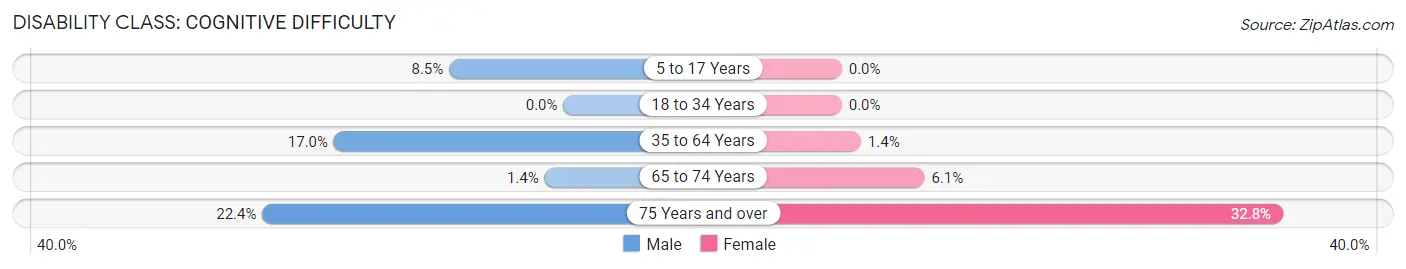
| Age Bracket | Male | Female |
| 5 to 17 Years | 38 (8.5%) | 0 (0.0%) |
| 18 to 34 Years | 0 (0.0%) | 0 (0.0%) |
| 35 to 64 Years | 146 (17.0%) | 11 (1.4%) |
| 65 to 74 Years | 4 (1.4%) | 21 (6.1%) |
| 75 Years and over | 38 (22.4%) | 112 (32.8%) |
Disability Class: Ambulatory Difficulty
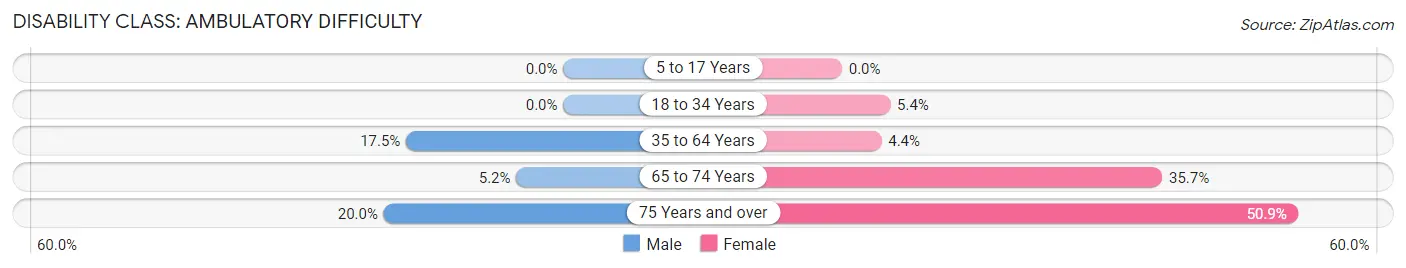
| Age Bracket | Male | Female |
| 5 to 17 Years | 0 (0.0%) | 0 (0.0%) |
| 18 to 34 Years | 0 (0.0%) | 31 (5.4%) |
| 35 to 64 Years | 150 (17.5%) | 34 (4.4%) |
| 65 to 74 Years | 15 (5.2%) | 122 (35.7%) |
| 75 Years and over | 34 (20.0%) | 174 (50.9%) |
Disability Class: Self-Care Difficulty
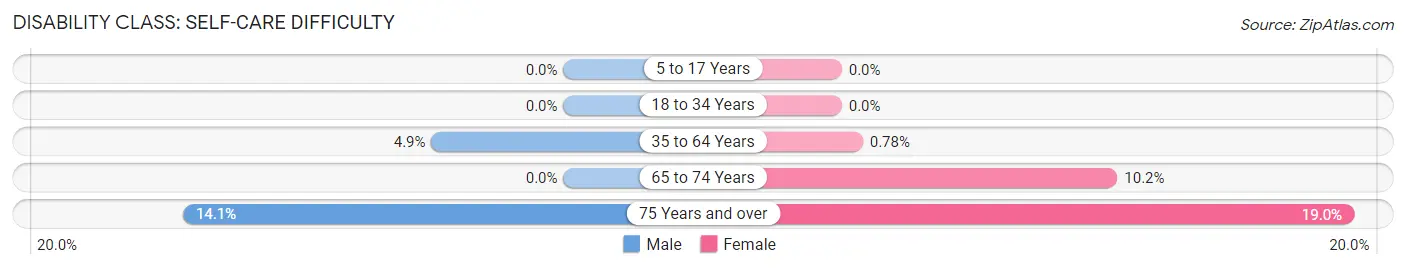
| Age Bracket | Male | Female |
| 5 to 17 Years | 0 (0.0%) | 0 (0.0%) |
| 18 to 34 Years | 0 (0.0%) | 0 (0.0%) |
| 35 to 64 Years | 42 (4.9%) | 6 (0.8%) |
| 65 to 74 Years | 0 (0.0%) | 35 (10.2%) |
| 75 Years and over | 24 (14.1%) | 65 (19.0%) |
Technology Access in Adjuntas
Computing Device Access in Adjuntas
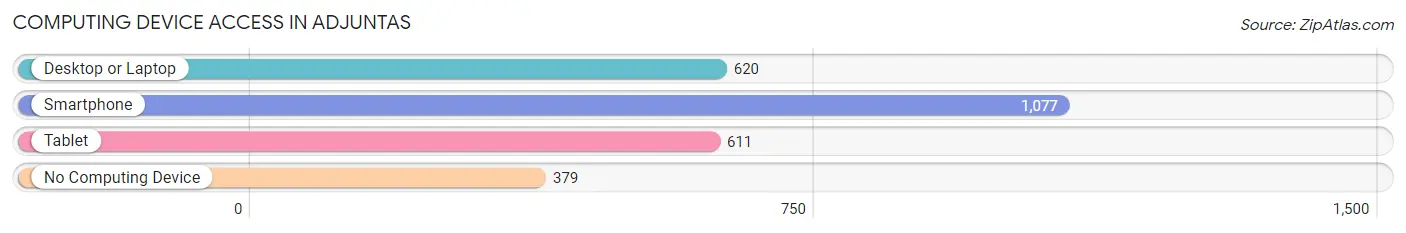
| Device Type | # Households | % Households |
| Desktop or Laptop | 620 | 41.2% |
| Smartphone | 1,077 | 71.7% |
| Tablet | 611 | 40.6% |
| No Computing Device | 379 | 25.2% |
| Total | 1,503 | 100.0% |
Internet Access in Adjuntas
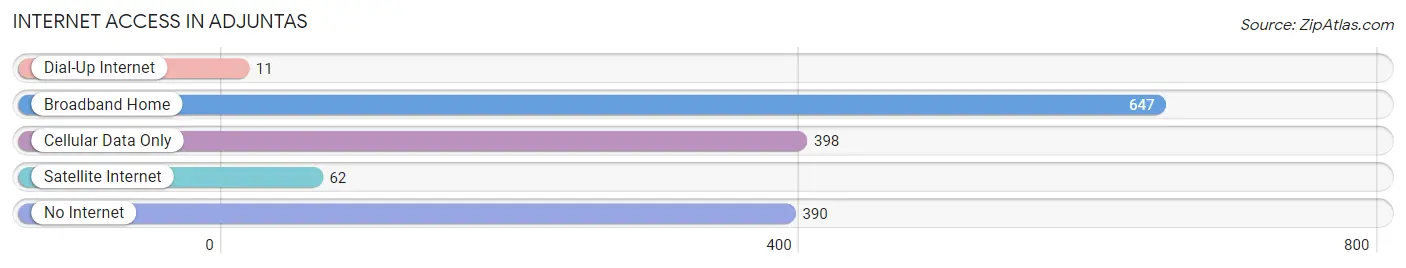
| Internet Type | # Households | % Households |
| Dial-Up Internet | 11 | 0.7% |
| Broadband Home | 647 | 43.0% |
| Cellular Data Only | 398 | 26.5% |
| Satellite Internet | 62 | 4.1% |
| No Internet | 390 | 26.0% |
| Total | 1,503 | 100.0% |
Adjuntas Summary
Adjuntas is a municipality located in the central mountain range of Puerto Rico. It is the largest municipality in the region and is known for its lush vegetation and mountainous terrain. Adjuntas is located in the western part of the island, approximately two hours from San Juan. The municipality is bordered by the municipalities of Utuado, Lares, Yauco, and Ponce.
Geography
Adjuntas is located in the central mountain range of Puerto Rico, in the western part of the island. It is bordered by the municipalities of Utuado, Lares, Yauco, and Ponce. The municipality is located at an elevation of 1,000 feet above sea level and covers an area of approximately 75 square miles. The terrain is mostly mountainous, with some flat areas in the lower elevations. The highest point in the municipality is Cerro de Punta, which is located at an elevation of 3,087 feet. The climate is tropical, with temperatures ranging from the mid-70s to the mid-80s.
Economy
Adjuntas is an agricultural municipality, with the majority of its economy based on the production of coffee, bananas, and other tropical fruits. The municipality also has a small manufacturing sector, which produces furniture, clothing, and other goods. Tourism is also an important part of the economy, with many visitors coming to the area to enjoy its natural beauty and outdoor activities.
Demographics
As of the 2010 census, Adjuntas had a population of 16,845. The population is mostly of Puerto Rican descent, with a small percentage of African and European ancestry. The majority of the population is Roman Catholic, with a small percentage of other religious affiliations. The median household income is $14,845, and the median age is 38.
History
Adjuntas was founded in 1815 by Don Juan de la Cruz, who named the town after his father, Don Juan de la Cruz Adjuntas. The town was originally a small farming community, but it grew in size and importance over the years. In 1848, Adjuntas was declared a municipality, and it has remained so ever since. During the 19th century, the town was an important center of the coffee industry, and it was also a major stop on the railroad line that connected San Juan to Ponce.
Adjuntas has a long and rich history, and it is known for its beautiful scenery and lush vegetation. The town is also home to several important historical sites, including the ruins of the old railroad station, the old sugar mill, and the old coffee plantation. Adjuntas is a popular tourist destination, and it is also home to several festivals and events throughout the year.
Common Questions
What is Per Capita Income in Adjuntas?
Per Capita income in Adjuntas is $8,743.
What is the Median Family Income in Adjuntas?
Median Family Income in Adjuntas is $19,000.
What is the Median Household income in Adjuntas?
Median Household Income in Adjuntas is $17,752.
What is Income or Wage Gap in Adjuntas?
Income or Wage Gap in Adjuntas is 27.9%.
Women in Adjuntas earn 72.1 cents for every dollar earned by a man.
What is Family Income Deficit in Adjuntas?
Family Income Deficit in Adjuntas is $10,252.
Families that are below poverty line in Adjuntas earn $10,252 less on average than the poverty threshold level.
What is Inequality or Gini Index in Adjuntas?
Inequality or Gini Index in Adjuntas is 0.44.
What is the Total Population of Adjuntas?
Total Population of Adjuntas is 4,765.
What is the Total Male Population of Adjuntas?
Total Male Population of Adjuntas is 2,285.
What is the Total Female Population of Adjuntas?
Total Female Population of Adjuntas is 2,480.
What is the Ratio of Males per 100 Females in Adjuntas?
There are 92.14 Males per 100 Females in Adjuntas.
What is the Ratio of Females per 100 Males in Adjuntas?
There are 108.53 Females per 100 Males in Adjuntas.
What is the Median Population Age in Adjuntas?
Median Population Age in Adjuntas is 42.0 Years.
What is the Average Family Size in Adjuntas
Average Family Size in Adjuntas is 4.2 People.
What is the Average Household Size in Adjuntas
Average Household Size in Adjuntas is 3.2 People.
How Large is the Labor Force in Adjuntas?
There are 1,685 People in the Labor Forcein in Adjuntas.
What is the Percentage of People in the Labor Force in Adjuntas?
43.8% of People are in the Labor Force in Adjuntas.
What is the Unemployment Rate in Adjuntas?
Unemployment Rate in Adjuntas is 19.8%.