Tallaboa Alta, PR Map & Demographics
Tallaboa Alta Map
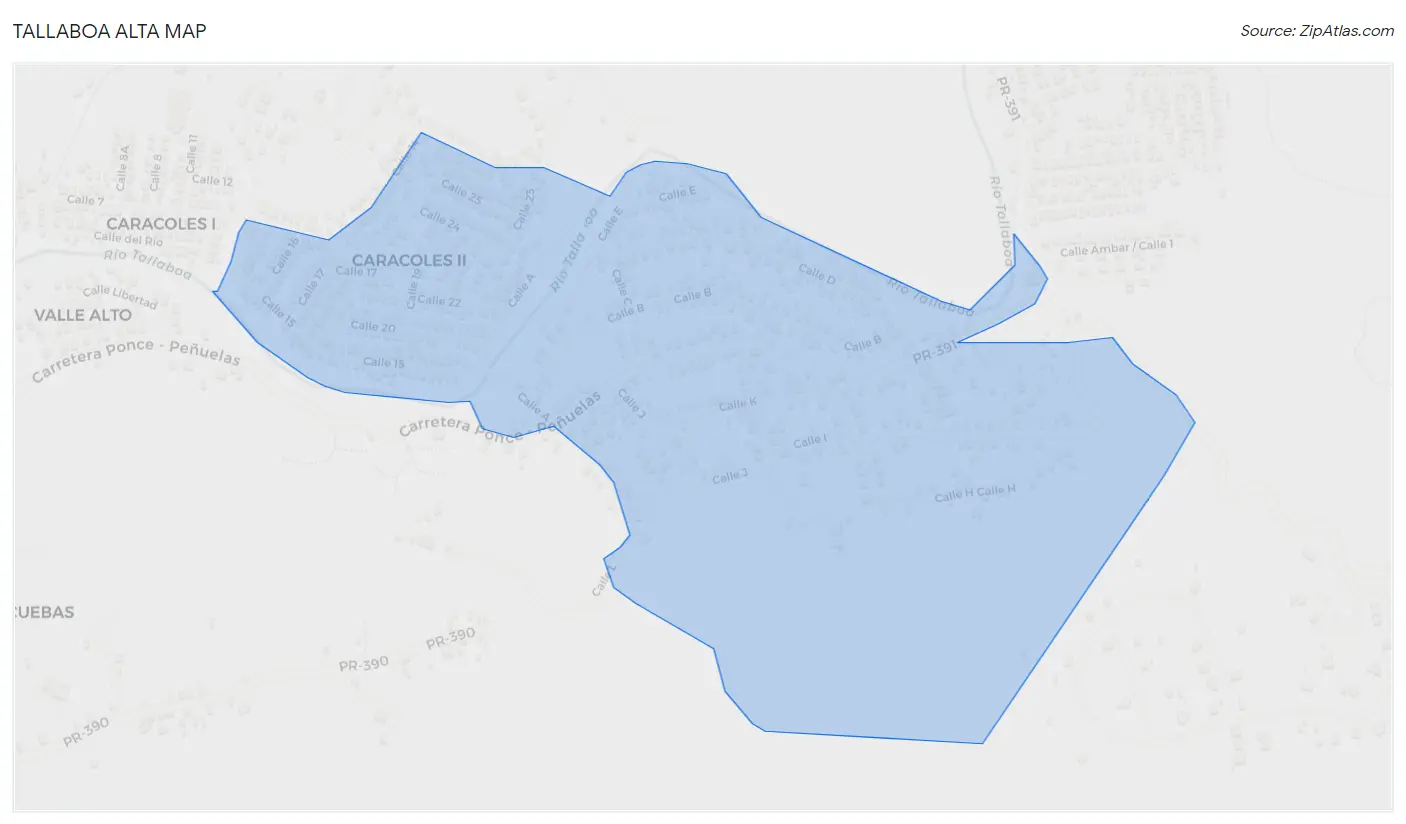
Tallaboa Alta Overview
$8,238
PER CAPITA INCOME
$13,598
AVG FAMILY INCOME
$12,715
AVG HOUSEHOLD INCOME
0.54
INEQUALITY / GINI INDEX
1,354
TOTAL POPULATION
735
MALE POPULATION
619
FEMALE POPULATION
118.74
MALES / 100 FEMALES
84.22
FEMALES / 100 MALES
40.6
MEDIAN AGE
3.6
AVG FAMILY SIZE
3.1
AVG HOUSEHOLD SIZE
407
LABOR FORCE [ PEOPLE ]
37.0%
PERCENT IN LABOR FORCE
14.0%
UNEMPLOYMENT RATE
Income in Tallaboa Alta
Income Overview in Tallaboa Alta
Per Capita Income in Tallaboa Alta is $8,238, while median incomes of families and households are $13,598 and $12,715 respectively.
| Characteristic | Number | Measure |
| Per Capita Income | 1,354 | $8,238 |
| Median Family Income | 340 | $13,598 |
| Mean Family Income | 340 | $25,222 |
| Median Household Income | 441 | $12,715 |
| Mean Household Income | 441 | $22,230 |
| Income Deficit | 340 | $0 |
| Wage / Income Gap (%) | 1,354 | 0.00% |
| Wage / Income Gap ($) | 1,354 | 100.00¢ per $1 |
| Gini / Inequality Index | 1,354 | 0.54 |
Earnings by Sex in Tallaboa Alta
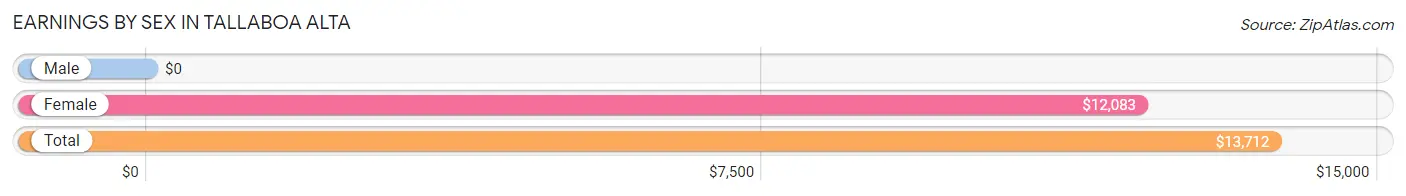
| Sex | Number | Average Earnings |
| Male | 308 (68.4%) | $0 |
| Female | 142 (31.6%) | $12,083 |
| Total | 450 (100.0%) | $13,712 |
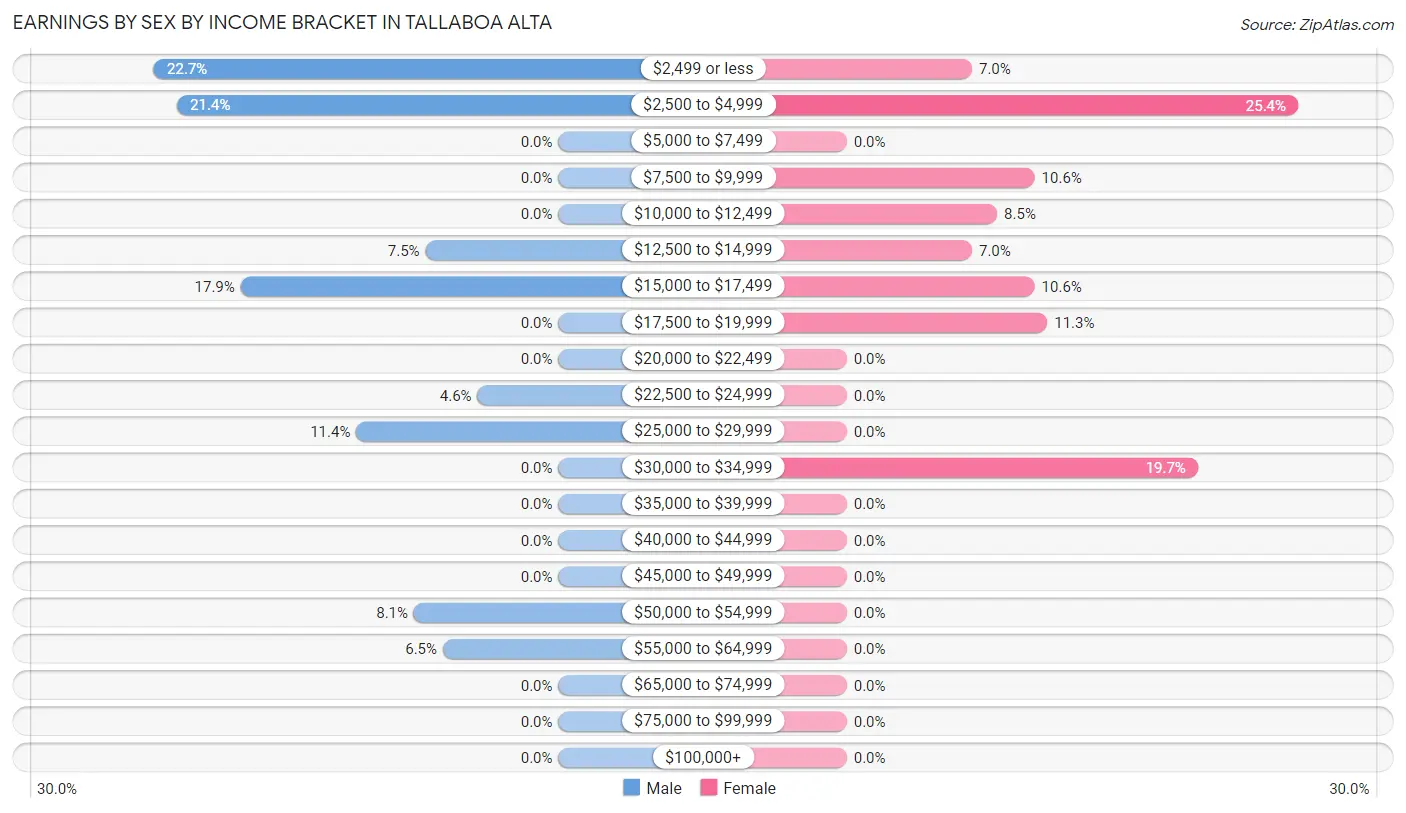
Earnings by Sex by Income Bracket in Tallaboa Alta
The most common earnings brackets in Tallaboa Alta are $2,499 or less for men (70 | 22.7%) and $2,500 to $4,999 for women (36 | 25.4%).
| Income | Male | Female |
| $2,499 or less | 70 (22.7%) | 10 (7.0%) |
| $2,500 to $4,999 | 66 (21.4%) | 36 (25.4%) |
| $5,000 to $7,499 | 0 (0.0%) | 0 (0.0%) |
| $7,500 to $9,999 | 0 (0.0%) | 15 (10.6%) |
| $10,000 to $12,499 | 0 (0.0%) | 12 (8.5%) |
| $12,500 to $14,999 | 23 (7.5%) | 10 (7.0%) |
| $15,000 to $17,499 | 55 (17.9%) | 15 (10.6%) |
| $17,500 to $19,999 | 0 (0.0%) | 16 (11.3%) |
| $20,000 to $22,499 | 0 (0.0%) | 0 (0.0%) |
| $22,500 to $24,999 | 14 (4.5%) | 0 (0.0%) |
| $25,000 to $29,999 | 35 (11.4%) | 0 (0.0%) |
| $30,000 to $34,999 | 0 (0.0%) | 28 (19.7%) |
| $35,000 to $39,999 | 0 (0.0%) | 0 (0.0%) |
| $40,000 to $44,999 | 0 (0.0%) | 0 (0.0%) |
| $45,000 to $49,999 | 0 (0.0%) | 0 (0.0%) |
| $50,000 to $54,999 | 25 (8.1%) | 0 (0.0%) |
| $55,000 to $64,999 | 20 (6.5%) | 0 (0.0%) |
| $65,000 to $74,999 | 0 (0.0%) | 0 (0.0%) |
| $75,000 to $99,999 | 0 (0.0%) | 0 (0.0%) |
| $100,000+ | 0 (0.0%) | 0 (0.0%) |
| Total | 308 (100.0%) | 142 (100.0%) |
Earnings by Sex by Educational Attainment in Tallaboa Alta
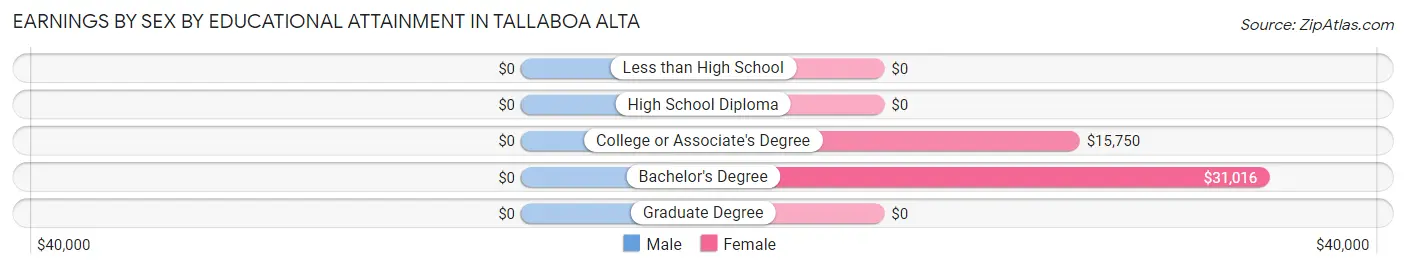
| Educational Attainment | Male Income | Female Income |
| Less than High School | - | - |
| High School Diploma | - | - |
| College or Associate's Degree | - | - |
| Bachelor's Degree | - | - |
| Graduate Degree | - | - |
| Total | - | - |
Family Income in Tallaboa Alta
Family Income Brackets in Tallaboa Alta
According to the Tallaboa Alta family income data, there are 117 families falling into the less than $10,000 income range, which is the most common income bracket and makes up 34.4% of all families.
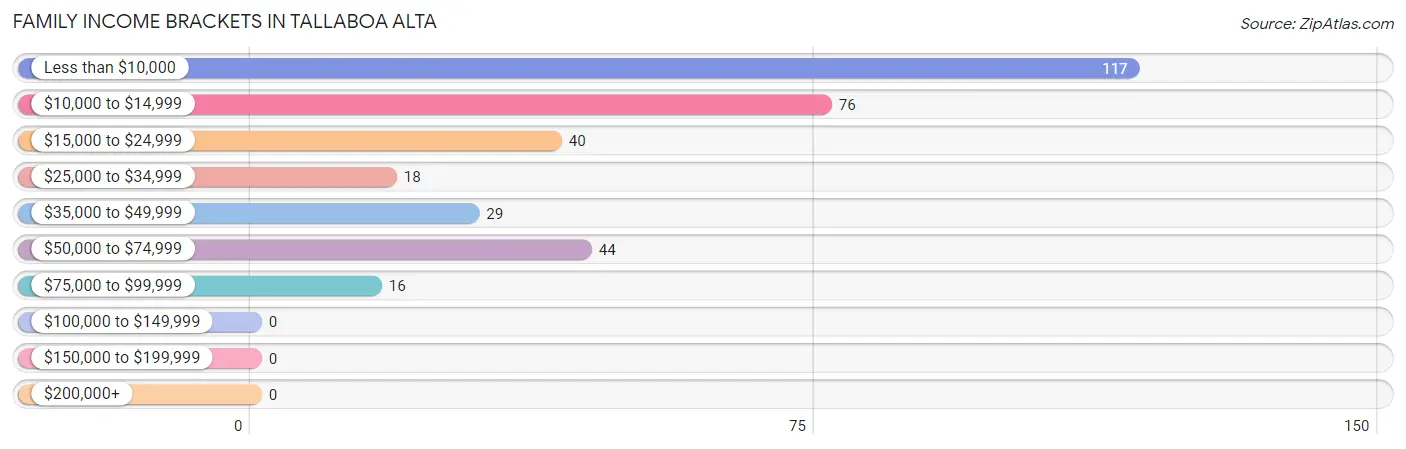
| Income Bracket | # Families | % Families |
| Less than $10,000 | 117 | 34.4% |
| $10,000 to $14,999 | 76 | 22.4% |
| $15,000 to $24,999 | 40 | 11.8% |
| $25,000 to $34,999 | 18 | 5.3% |
| $35,000 to $49,999 | 29 | 8.5% |
| $50,000 to $74,999 | 44 | 12.9% |
| $75,000 to $99,999 | 16 | 4.7% |
| $100,000 to $149,999 | 0 | 0.0% |
| $150,000 to $199,999 | 0 | 0.0% |
| $200,000+ | 0 | 0.0% |
Family Income by Famaliy Size in Tallaboa Alta
2-person families (169 | 49.7%) account for the highest median family income in Tallaboa Alta with $11,797 per family, while 2-person families (169 | 49.7%) have the highest median income of $5,898 per family member.
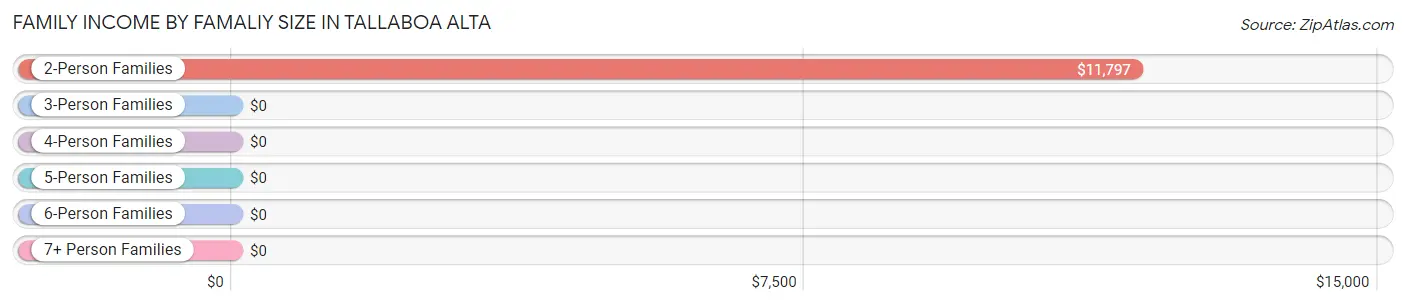
| Income Bracket | # Families | Median Income |
| 2-Person Families | 169 (49.7%) | $11,797 |
| 3-Person Families | 76 (22.4%) | $0 |
| 4-Person Families | 95 (27.9%) | $0 |
| 5-Person Families | 0 (0.0%) | $0 |
| 6-Person Families | 0 (0.0%) | $0 |
| 7+ Person Families | 0 (0.0%) | $0 |
| Total | 340 (100.0%) | $13,598 |
Family Income by Number of Earners in Tallaboa Alta
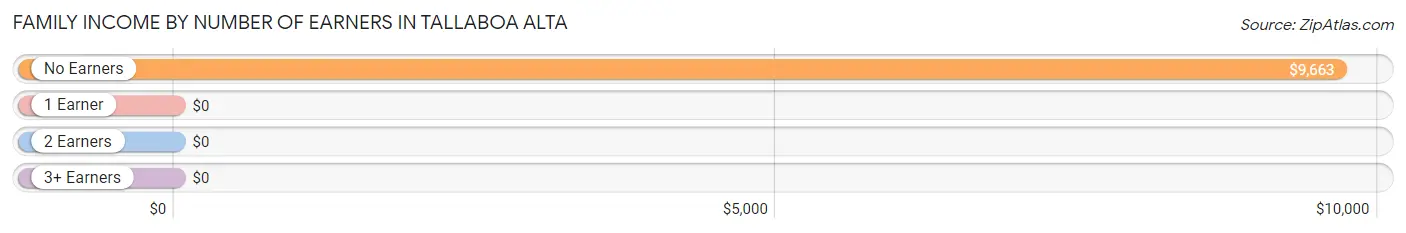
| Number of Earners | # Families | Median Income |
| No Earners | 177 (52.1%) | $9,663 |
| 1 Earner | 88 (25.9%) | $0 |
| 2 Earners | 49 (14.4%) | $0 |
| 3+ Earners | 26 (7.6%) | $0 |
| Total | 340 (100.0%) | $13,598 |
Household Income in Tallaboa Alta
Household Income Brackets in Tallaboa Alta
With 168 households falling in the category, the less than $10,000 income range is the most frequent in Tallaboa Alta, accounting for 38.1% of all households.
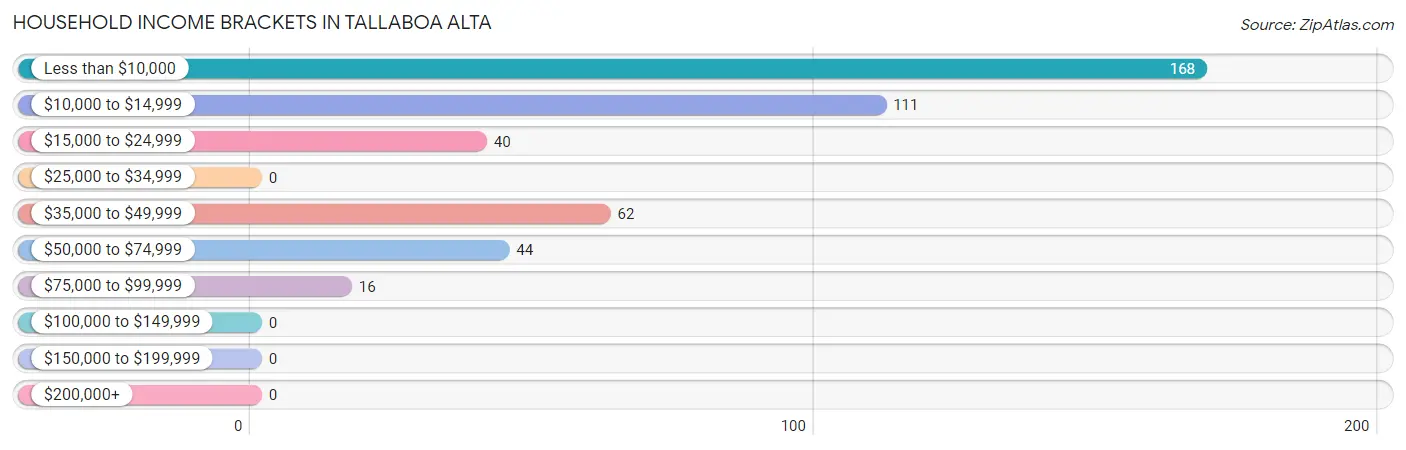
| Income Bracket | # Households | % Households |
| Less than $10,000 | 168 | 38.1% |
| $10,000 to $14,999 | 111 | 25.2% |
| $15,000 to $24,999 | 40 | 9.1% |
| $25,000 to $34,999 | 0 | 0.0% |
| $35,000 to $49,999 | 62 | 14.1% |
| $50,000 to $74,999 | 44 | 10.0% |
| $75,000 to $99,999 | 16 | 3.6% |
| $100,000 to $149,999 | 0 | 0.0% |
| $150,000 to $199,999 | 0 | 0.0% |
| $200,000+ | 0 | 0.0% |
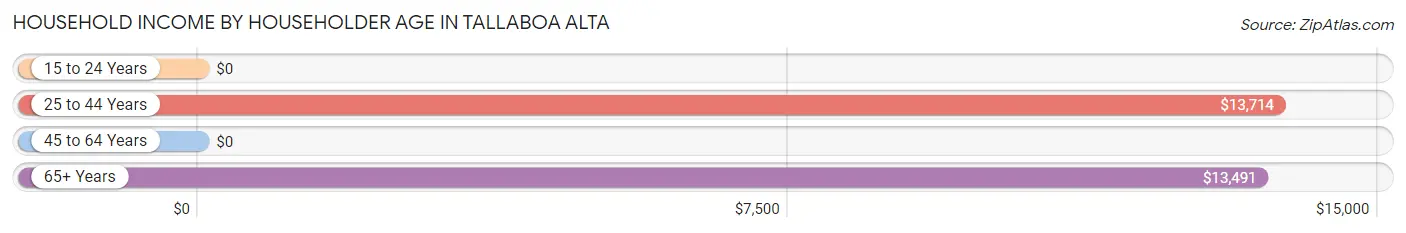
Household Income by Householder Age in Tallaboa Alta
The median household income in Tallaboa Alta is $12,715, with the highest median household income of $13,714 found in the 25 to 44 years age bracket for the primary householder. A total of 156 households (35.4%) fall into this category. Meanwhile, the 15 to 24 years age bracket for the primary householder has the lowest median household income of $0, with 10 households (2.3%) in this group.
| Income Bracket | # Households | Median Income |
| 15 to 24 Years | 10 (2.3%) | $0 |
| 25 to 44 Years | 156 (35.4%) | $13,714 |
| 45 to 64 Years | 108 (24.5%) | $0 |
| 65+ Years | 167 (37.9%) | $13,491 |
| Total | 441 (100.0%) | $12,715 |
Poverty in Tallaboa Alta
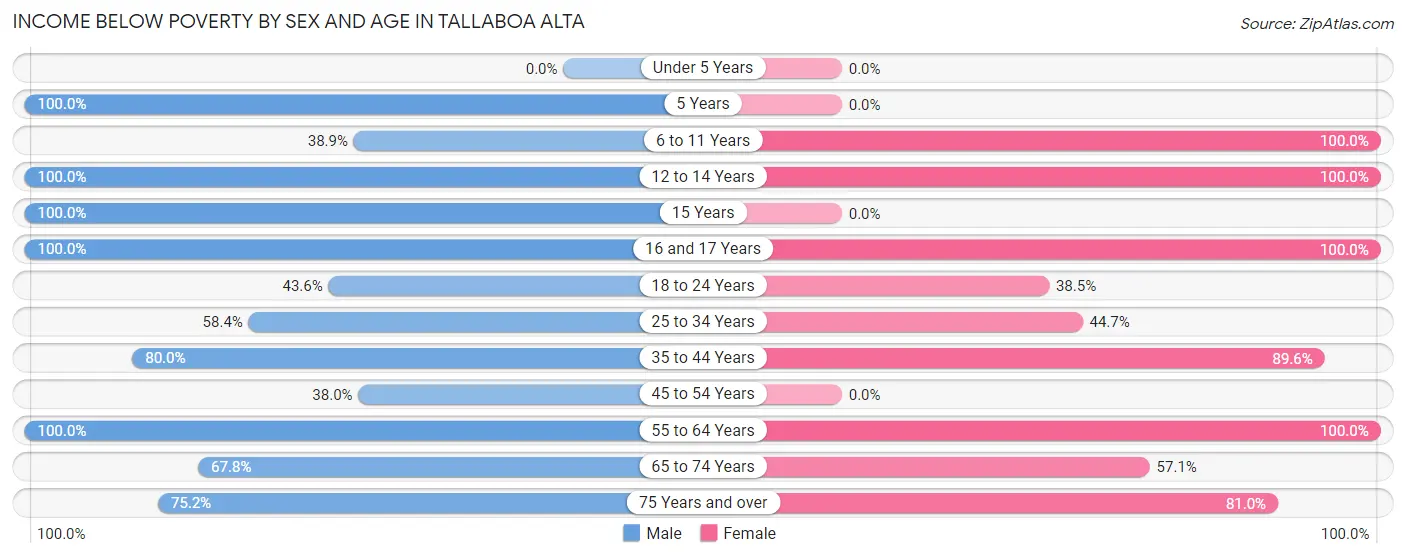
Income Below Poverty by Sex and Age in Tallaboa Alta
With 67.6% poverty level for males and 73.5% for females among the residents of Tallaboa Alta, 5 year old males and 6 to 11 year old females are the most vulnerable to poverty, with 20 males (100.0%) and 84 females (100.0%) in their respective age groups living below the poverty level.
| Age Bracket | Male | Female |
| Under 5 Years | 0 (0.0%) | 0 (0.0%) |
| 5 Years | 20 (100.0%) | 0 (0.0%) |
| 6 to 11 Years | 28 (38.9%) | 84 (100.0%) |
| 12 to 14 Years | 28 (100.0%) | 22 (100.0%) |
| 15 Years | 16 (100.0%) | 0 (0.0%) |
| 16 and 17 Years | 30 (100.0%) | 25 (100.0%) |
| 18 to 24 Years | 17 (43.6%) | 10 (38.5%) |
| 25 to 34 Years | 66 (58.4%) | 42 (44.7%) |
| 35 to 44 Years | 92 (80.0%) | 138 (89.6%) |
| 45 to 54 Years | 35 (38.0%) | 0 (0.0%) |
| 55 to 64 Years | 46 (100.0%) | 56 (100.0%) |
| 65 to 74 Years | 40 (67.8%) | 44 (57.1%) |
| 75 Years and over | 79 (75.2%) | 34 (80.9%) |
| Total | 497 (67.6%) | 455 (73.5%) |
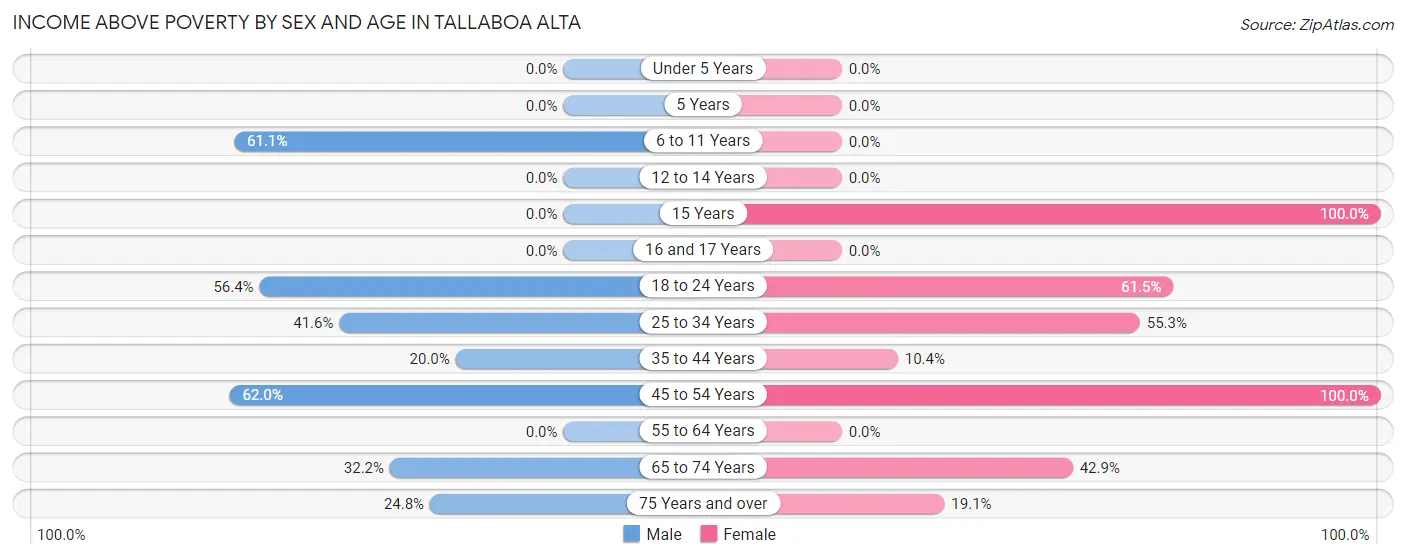
Income Above Poverty by Sex and Age in Tallaboa Alta
According to the poverty statistics in Tallaboa Alta, males aged 45 to 54 years and females aged 15 years are the age groups that are most secure financially, with 62.0% of males and 100.0% of females in these age groups living above the poverty line.
| Age Bracket | Male | Female |
| Under 5 Years | 0 (0.0%) | 0 (0.0%) |
| 5 Years | 0 (0.0%) | 0 (0.0%) |
| 6 to 11 Years | 44 (61.1%) | 0 (0.0%) |
| 12 to 14 Years | 0 (0.0%) | 0 (0.0%) |
| 15 Years | 0 (0.0%) | 11 (100.0%) |
| 16 and 17 Years | 0 (0.0%) | 0 (0.0%) |
| 18 to 24 Years | 22 (56.4%) | 16 (61.5%) |
| 25 to 34 Years | 47 (41.6%) | 52 (55.3%) |
| 35 to 44 Years | 23 (20.0%) | 16 (10.4%) |
| 45 to 54 Years | 57 (62.0%) | 28 (100.0%) |
| 55 to 64 Years | 0 (0.0%) | 0 (0.0%) |
| 65 to 74 Years | 19 (32.2%) | 33 (42.9%) |
| 75 Years and over | 26 (24.8%) | 8 (19.1%) |
| Total | 238 (32.4%) | 164 (26.5%) |
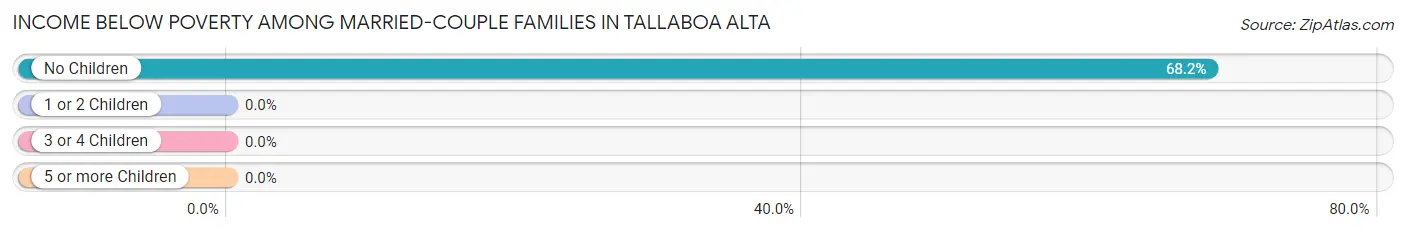
Income Below Poverty Among Married-Couple Families in Tallaboa Alta
The poverty statistics for married-couple families in Tallaboa Alta show that 62.4% or 101 of the total 162 families live below the poverty line. Families with no children have the highest poverty rate of 68.2%, comprising of 101 families. On the other hand, families with 1 or 2 children have the lowest poverty rate of 0.0%, which includes 0 families.
| Children | Above Poverty | Below Poverty |
| No Children | 47 (31.8%) | 101 (68.2%) |
| 1 or 2 Children | 14 (100.0%) | 0 (0.0%) |
| 3 or 4 Children | 0 (0.0%) | 0 (0.0%) |
| 5 or more Children | 0 (0.0%) | 0 (0.0%) |
| Total | 61 (37.7%) | 101 (62.4%) |
Income Below Poverty Among Single-Parent Households in Tallaboa Alta
According to the poverty data in Tallaboa Alta, 41.2% or 14 single-father households and 81.9% or 118 single-mother households are living below the poverty line. Among single-father households, those with 1 or 2 children have the highest poverty rate, with 14 households (100.0%) experiencing poverty. Likewise, among single-mother households, those with 3 or 4 children have the highest poverty rate, with 19 households (100.0%) falling below the poverty line.
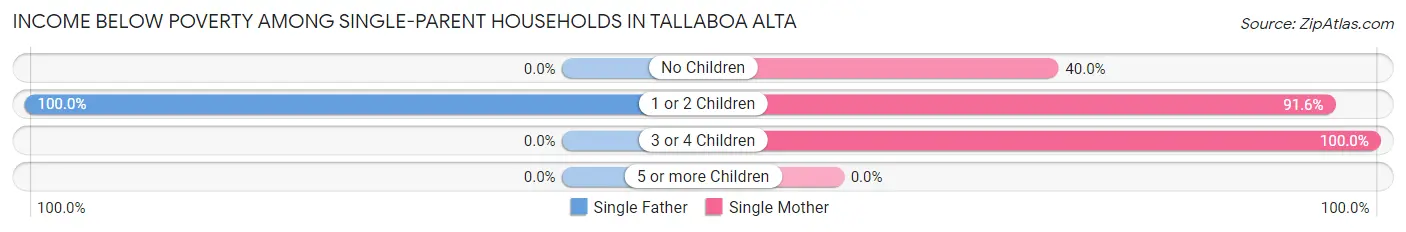
| Children | Single Father | Single Mother |
| No Children | 0 (0.0%) | 12 (40.0%) |
| 1 or 2 Children | 14 (100.0%) | 87 (91.6%) |
| 3 or 4 Children | 0 (0.0%) | 19 (100.0%) |
| 5 or more Children | 0 (0.0%) | 0 (0.0%) |
| Total | 14 (41.2%) | 118 (81.9%) |
Income Below Poverty Among Married-Couple vs Single-Parent Households in Tallaboa Alta
The poverty data for Tallaboa Alta shows that 101 of the married-couple family households (62.4%) and 132 of the single-parent households (74.2%) are living below the poverty level. Within the married-couple family households, those with no children have the highest poverty rate, with 101 households (68.2%) falling below the poverty line. Among the single-parent households, those with 3 or 4 children have the highest poverty rate, with 19 household (100.0%) living below poverty.
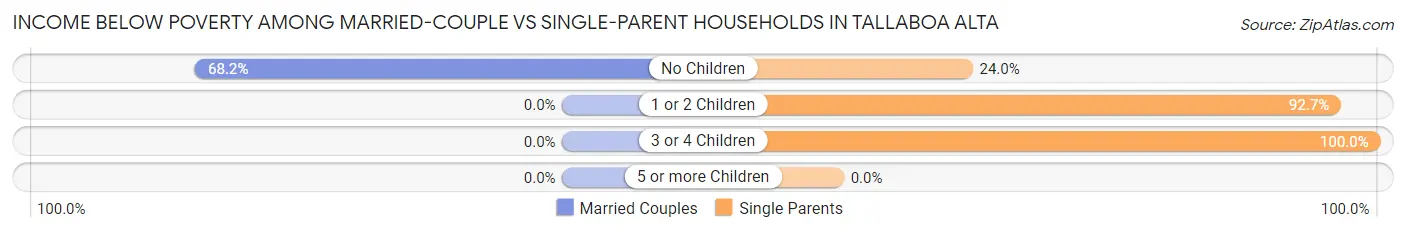
| Children | Married-Couple Families | Single-Parent Households |
| No Children | 101 (68.2%) | 12 (24.0%) |
| 1 or 2 Children | 0 (0.0%) | 101 (92.7%) |
| 3 or 4 Children | 0 (0.0%) | 19 (100.0%) |
| 5 or more Children | 0 (0.0%) | 0 (0.0%) |
| Total | 101 (62.4%) | 132 (74.2%) |
Race in Tallaboa Alta
The most populous races in Tallaboa Alta are Hispanic or Latino (1,331 | 98.3%), White / Caucasian (1,134 | 83.8%), and Some other Race (101 | 7.5%).
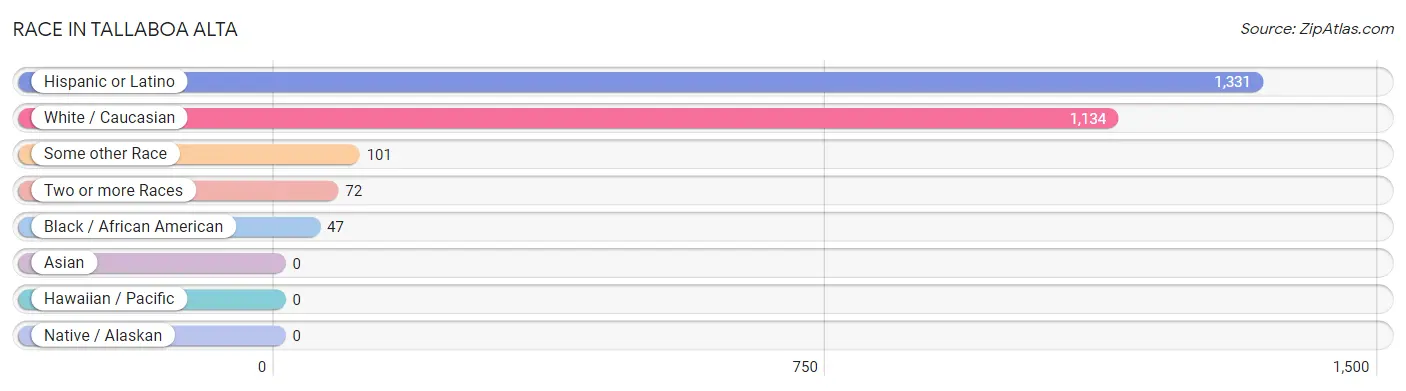
| Race | # Population | % Population |
| Asian | 0 | 0.0% |
| Black / African American | 47 | 3.5% |
| Hawaiian / Pacific | 0 | 0.0% |
| Hispanic or Latino | 1,331 | 98.3% |
| Native / Alaskan | 0 | 0.0% |
| White / Caucasian | 1,134 | 83.8% |
| Two or more Races | 72 | 5.3% |
| Some other Race | 101 | 7.5% |
| Total | 1,354 | 100.0% |
Ancestry in Tallaboa Alta
The most populous ancestries reported in Tallaboa Alta are Puerto Rican (1,285 | 94.9%), and Mexican (46 | 3.4%), together accounting for 98.3% of all Tallaboa Alta residents.
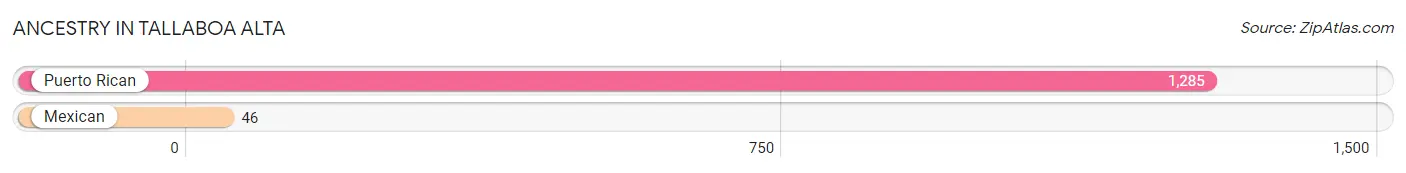
| Ancestry | # Population | % Population |
| Mexican | 46 | 3.4% |
| Puerto Rican | 1,285 | 94.9% | View All 2 Rows |
Immigrants in Tallaboa Alta

| Immigration Origin | # Population | % Population | View All 0 Rows |
Sex and Age in Tallaboa Alta
Sex and Age in Tallaboa Alta
The most populous age groups in Tallaboa Alta are 40 to 44 Years (92 | 12.5%) for men and 40 to 44 Years (117 | 18.9%) for women.
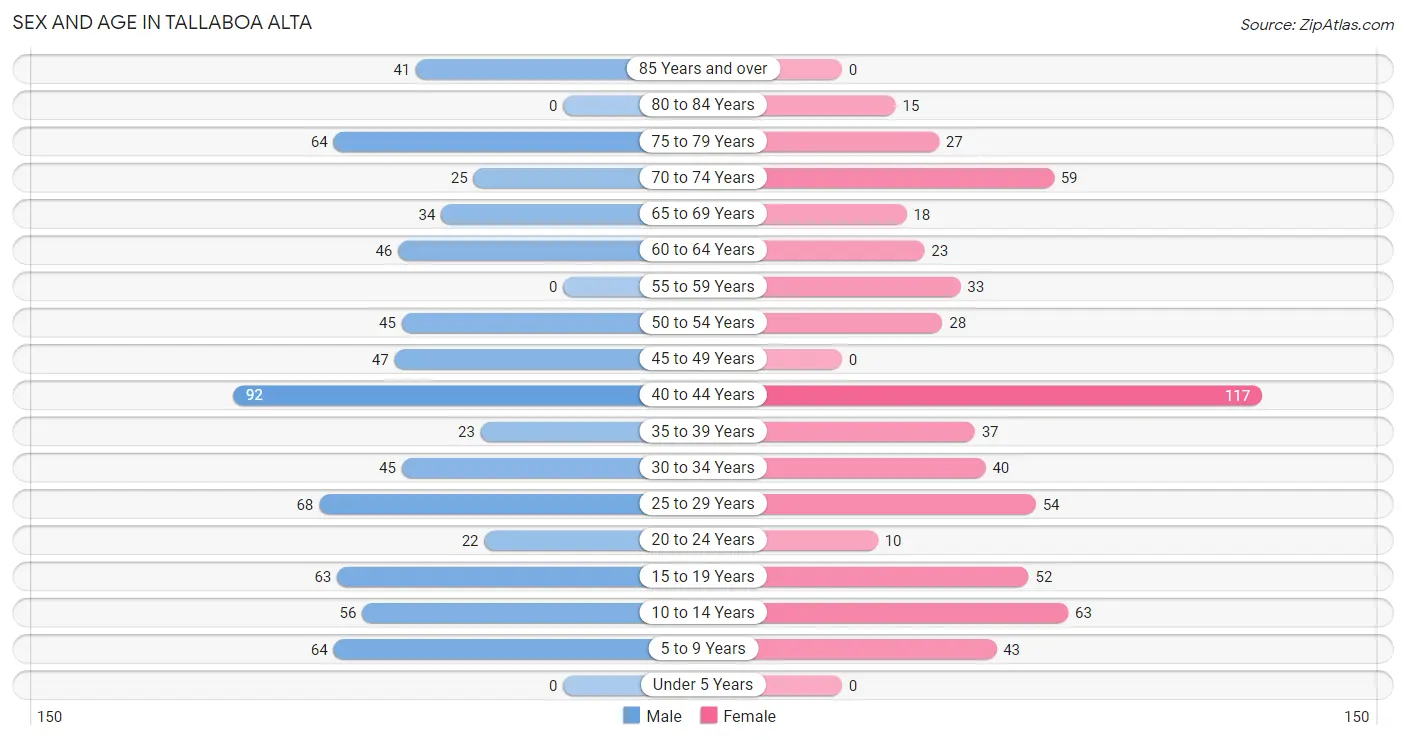
| Age Bracket | Male | Female |
| Under 5 Years | 0 (0.0%) | 0 (0.0%) |
| 5 to 9 Years | 64 (8.7%) | 43 (7.0%) |
| 10 to 14 Years | 56 (7.6%) | 63 (10.2%) |
| 15 to 19 Years | 63 (8.6%) | 52 (8.4%) |
| 20 to 24 Years | 22 (3.0%) | 10 (1.6%) |
| 25 to 29 Years | 68 (9.2%) | 54 (8.7%) |
| 30 to 34 Years | 45 (6.1%) | 40 (6.5%) |
| 35 to 39 Years | 23 (3.1%) | 37 (6.0%) |
| 40 to 44 Years | 92 (12.5%) | 117 (18.9%) |
| 45 to 49 Years | 47 (6.4%) | 0 (0.0%) |
| 50 to 54 Years | 45 (6.1%) | 28 (4.5%) |
| 55 to 59 Years | 0 (0.0%) | 33 (5.3%) |
| 60 to 64 Years | 46 (6.3%) | 23 (3.7%) |
| 65 to 69 Years | 34 (4.6%) | 18 (2.9%) |
| 70 to 74 Years | 25 (3.4%) | 59 (9.5%) |
| 75 to 79 Years | 64 (8.7%) | 27 (4.4%) |
| 80 to 84 Years | 0 (0.0%) | 15 (2.4%) |
| 85 Years and over | 41 (5.6%) | 0 (0.0%) |
| Total | 735 (100.0%) | 619 (100.0%) |
Families and Households in Tallaboa Alta
Median Family Size in Tallaboa Alta
The median family size in Tallaboa Alta is 3.56 persons per family, with single female/mother families (144 | 42.3%) accounting for the largest median family size of 3.89 persons per family. On the other hand, single male/father families (34 | 10.0%) represent the smallest median family size with 3.09 persons per family.
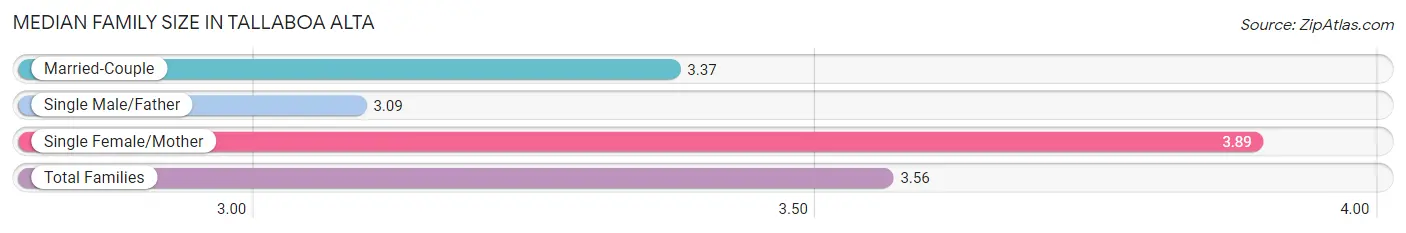
| Family Type | # Families | Family Size |
| Married-Couple | 162 (47.6%) | 3.37 |
| Single Male/Father | 34 (10.0%) | 3.09 |
| Single Female/Mother | 144 (42.3%) | 3.89 |
| Total Families | 340 (100.0%) | 3.56 |
Median Household Size in Tallaboa Alta
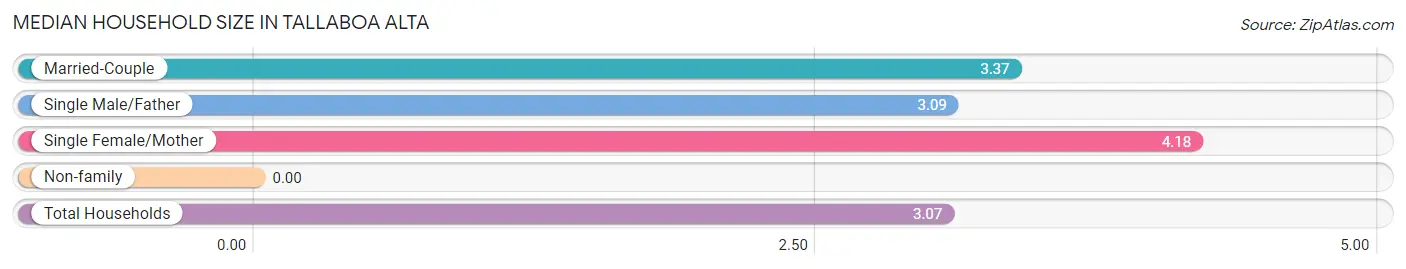
| Household Type | # Households | Household Size |
| Married-Couple | 162 (36.7%) | 3.37 |
| Single Male/Father | 34 (7.7%) | 3.09 |
| Single Female/Mother | 144 (32.7%) | 4.18 |
| Non-family | 101 (22.9%) | - |
| Total Households | 441 (100.0%) | 3.07 |
Household Size by Marriage Status in Tallaboa Alta
Out of a total of 441 households in Tallaboa Alta, 340 (77.1%) are family households, while 101 (22.9%) are nonfamily households. The most numerous type of family households are 2-person households, comprising 151, and the most common type of nonfamily households are 1-person households, comprising 101.
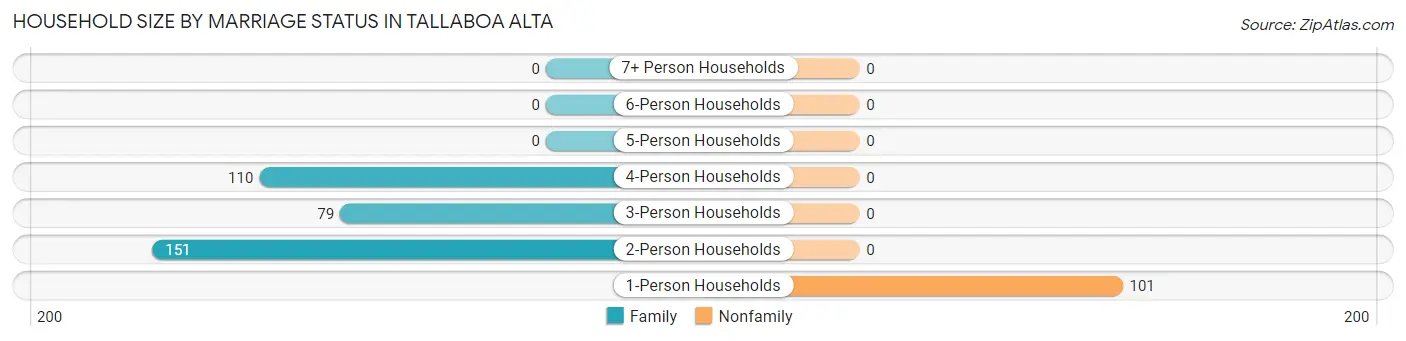
| Household Size | Family Households | Nonfamily Households |
| 1-Person Households | - | 101 (22.9%) |
| 2-Person Households | 151 (34.2%) | 0 (0.0%) |
| 3-Person Households | 79 (17.9%) | 0 (0.0%) |
| 4-Person Households | 110 (24.9%) | 0 (0.0%) |
| 5-Person Households | 0 (0.0%) | 0 (0.0%) |
| 6-Person Households | 0 (0.0%) | 0 (0.0%) |
| 7+ Person Households | 0 (0.0%) | 0 (0.0%) |
| Total | 340 (77.1%) | 101 (22.9%) |
Female Fertility in Tallaboa Alta
Fertility by Age in Tallaboa Alta
| Age Bracket | Women with Births | Births / 1,000 Women |
| 15 to 19 years | 0 (0.0%) | 0.0 |
| 20 to 34 years | 0 (0.0%) | 0.0 |
| 35 to 50 years | 0 (0.0%) | 0.0 |
| Total | 0 (0.0%) | 0.0 |
Fertility by Age by Marriage Status in Tallaboa Alta
| Age Bracket | Married | Unmarried |
| 15 to 19 years | 0 (0.0%) | 0 (0.0%) |
| 20 to 34 years | 0 (0.0%) | 0 (0.0%) |
| 35 to 50 years | 0 (0.0%) | 0 (0.0%) |
| Total | 0 (0.0%) | 0 (0.0%) |
Fertility by Education in Tallaboa Alta
| Educational Attainment | Women with Births | Births / 1,000 Women |
| Less than High School | 0 (0.0%) | 0.0 |
| High School Diploma | 0 (0.0%) | 0.0 |
| College or Associate's Degree | 0 (0.0%) | 0.0 |
| Bachelor's Degree | 0 (0.0%) | 0.0 |
| Graduate Degree | 0 (0.0%) | 0.0 |
| Total | 0 (0.0%) | 0.0 |
Fertility by Education by Marriage Status in Tallaboa Alta
| Educational Attainment | Married | Unmarried |
| Less than High School | 0 (0.0%) | 0 (0.0%) |
| High School Diploma | 0 (0.0%) | 0 (0.0%) |
| College or Associate's Degree | 0 (0.0%) | 0 (0.0%) |
| Bachelor's Degree | 0 (0.0%) | 0 (0.0%) |
| Graduate Degree | 0 (0.0%) | 0 (0.0%) |
| Total | 0 (0.0%) | 0 (0.0%) |
Employment Characteristics in Tallaboa Alta
Employment by Class of Employer in Tallaboa Alta
Among the 350 employed individuals in Tallaboa Alta, private company employees (122 | 34.9%), self-employed (not incorporated) (108 | 30.9%), and state government employees (65 | 18.6%) make up the most common classes of employment.
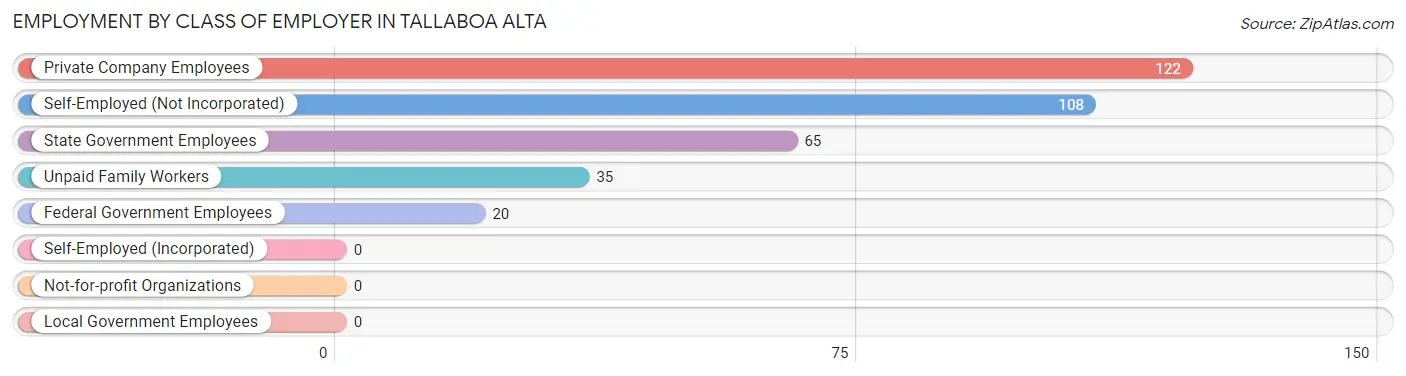
| Employer Class | # Employees | % Employees |
| Private Company Employees | 122 | 34.9% |
| Self-Employed (Incorporated) | 0 | 0.0% |
| Self-Employed (Not Incorporated) | 108 | 30.9% |
| Not-for-profit Organizations | 0 | 0.0% |
| Local Government Employees | 0 | 0.0% |
| State Government Employees | 65 | 18.6% |
| Federal Government Employees | 20 | 5.7% |
| Unpaid Family Workers | 35 | 10.0% |
| Total | 350 | 100.0% |
Employment Status by Age in Tallaboa Alta
According to the labor force statistics for Tallaboa Alta, out of the total population over 16 years of age (1,101), 37.0% or 407 individuals are in the labor force, with 14.0% or 57 of them unemployed. The age group with the highest labor force participation rate is 20 to 24 years, with 100.0% or 32 individuals in the labor force. Within the labor force, the 20 to 24 years age range has the highest percentage of unemployed individuals, with 68.8% or 22 of them being unemployed.
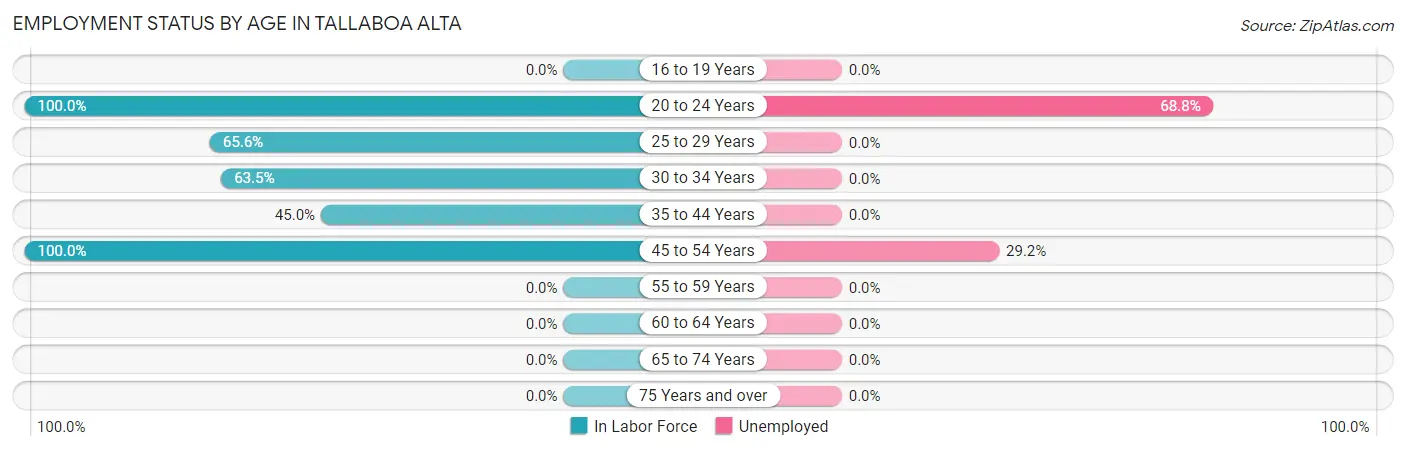
| Age Bracket | In Labor Force | Unemployed |
| 16 to 19 Years | 0 (0.0%) | 0 (0.0%) |
| 20 to 24 Years | 32 (100.0%) | 22 (68.8%) |
| 25 to 29 Years | 80 (65.6%) | 0 (0.0%) |
| 30 to 34 Years | 54 (63.5%) | 0 (0.0%) |
| 35 to 44 Years | 121 (45.0%) | 0 (0.0%) |
| 45 to 54 Years | 120 (100.0%) | 35 (29.2%) |
| 55 to 59 Years | 0 (0.0%) | 0 (0.0%) |
| 60 to 64 Years | 0 (0.0%) | 0 (0.0%) |
| 65 to 74 Years | 0 (0.0%) | 0 (0.0%) |
| 75 Years and over | 0 (0.0%) | 0 (0.0%) |
| Total | 407 (37.0%) | 57 (14.0%) |
Employment Status by Educational Attainment in Tallaboa Alta
According to labor force statistics for Tallaboa Alta, 53.7% of individuals (375) out of the total population between 25 and 64 years of age (698) are in the labor force, with 9.3% or 35 of them being unemployed. The group with the highest labor force participation rate are those with the educational attainment of bachelor's degree or higher, with 100.0% or 88 individuals in the labor force. Within the labor force, individuals with less than high school education have the highest percentage of unemployment, with 49.3% or 35 of them being unemployed.
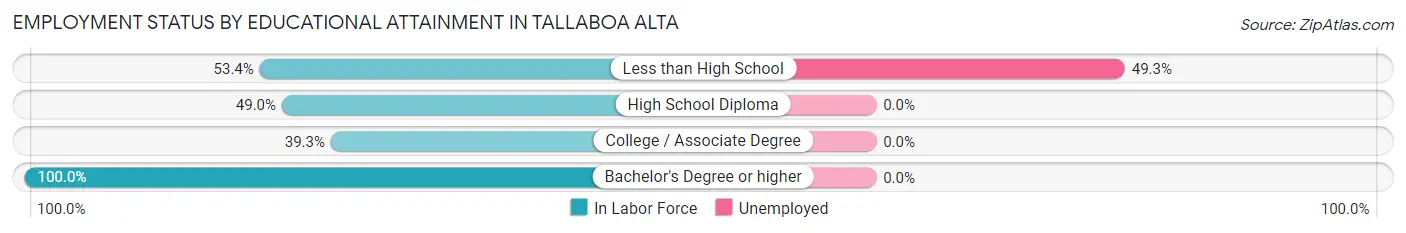
| Educational Attainment | In Labor Force | Unemployed |
| Less than High School | 71 (53.4%) | 66 (49.3%) |
| High School Diploma | 144 (49.0%) | 0 (0.0%) |
| College / Associate Degree | 72 (39.3%) | 0 (0.0%) |
| Bachelor's Degree or higher | 88 (100.0%) | 0 (0.0%) |
| Total | 375 (53.7%) | 65 (9.3%) |
Employment Occupations by Sex in Tallaboa Alta
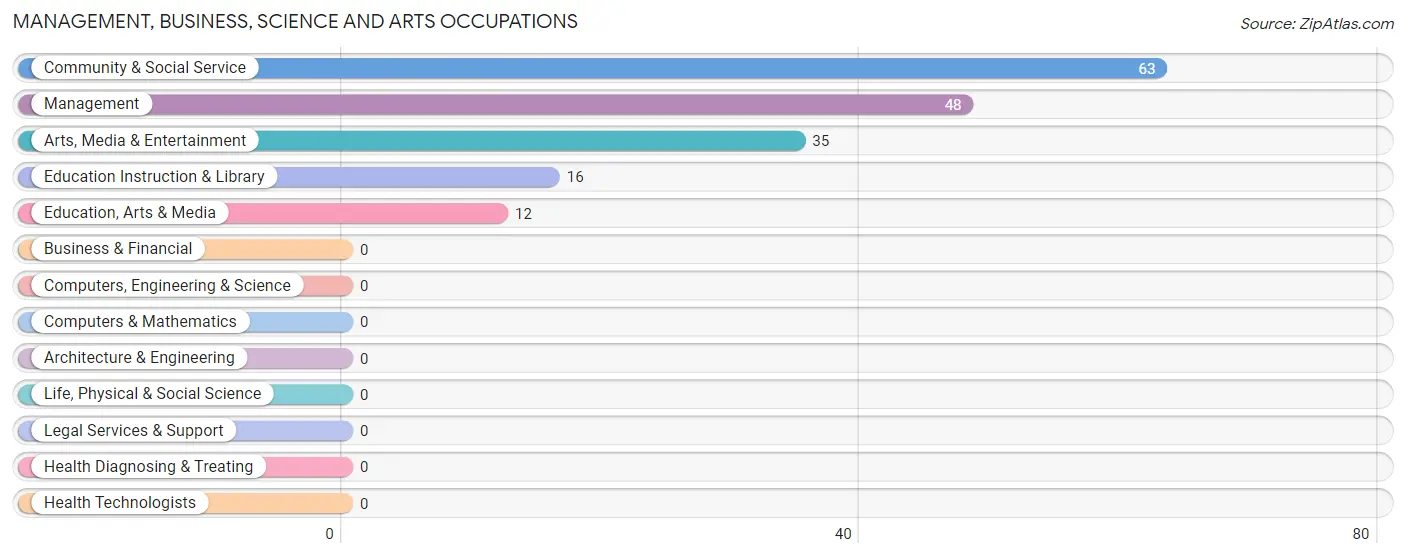
Management, Business, Science and Arts Occupations
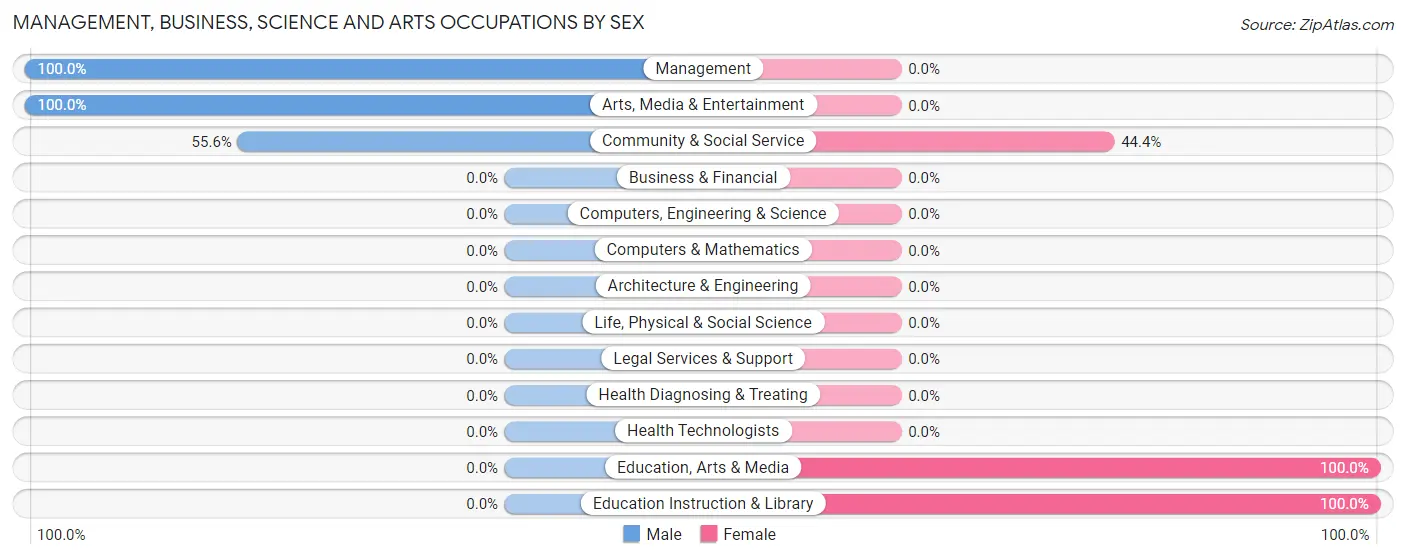
The most common Management, Business, Science and Arts occupations in Tallaboa Alta are Community & Social Service (63 | 18.0%), Management (48 | 13.7%), Arts, Media & Entertainment (35 | 10.0%), Education Instruction & Library (16 | 4.6%), and Education, Arts & Media (12 | 3.4%).
Management, Business, Science and Arts Occupations by Sex
Within the Management, Business, Science and Arts occupations in Tallaboa Alta, the most male-oriented occupations are Management (100.0%), Arts, Media & Entertainment (100.0%), and Community & Social Service (55.6%), while the most female-oriented occupations are Education, Arts & Media (100.0%), Education Instruction & Library (100.0%), and Community & Social Service (44.4%).
| Occupation | Male | Female |
| Management | 48 (100.0%) | 0 (0.0%) |
| Business & Financial | 0 (0.0%) | 0 (0.0%) |
| Computers, Engineering & Science | 0 (0.0%) | 0 (0.0%) |
| Computers & Mathematics | 0 (0.0%) | 0 (0.0%) |
| Architecture & Engineering | 0 (0.0%) | 0 (0.0%) |
| Life, Physical & Social Science | 0 (0.0%) | 0 (0.0%) |
| Community & Social Service | 35 (55.6%) | 28 (44.4%) |
| Education, Arts & Media | 0 (0.0%) | 12 (100.0%) |
| Legal Services & Support | 0 (0.0%) | 0 (0.0%) |
| Education Instruction & Library | 0 (0.0%) | 16 (100.0%) |
| Arts, Media & Entertainment | 35 (100.0%) | 0 (0.0%) |
| Health Diagnosing & Treating | 0 (0.0%) | 0 (0.0%) |
| Health Technologists | 0 (0.0%) | 0 (0.0%) |
| Total (Category) | 83 (74.8%) | 28 (25.2%) |
| Total (Overall) | 224 (64.0%) | 126 (36.0%) |
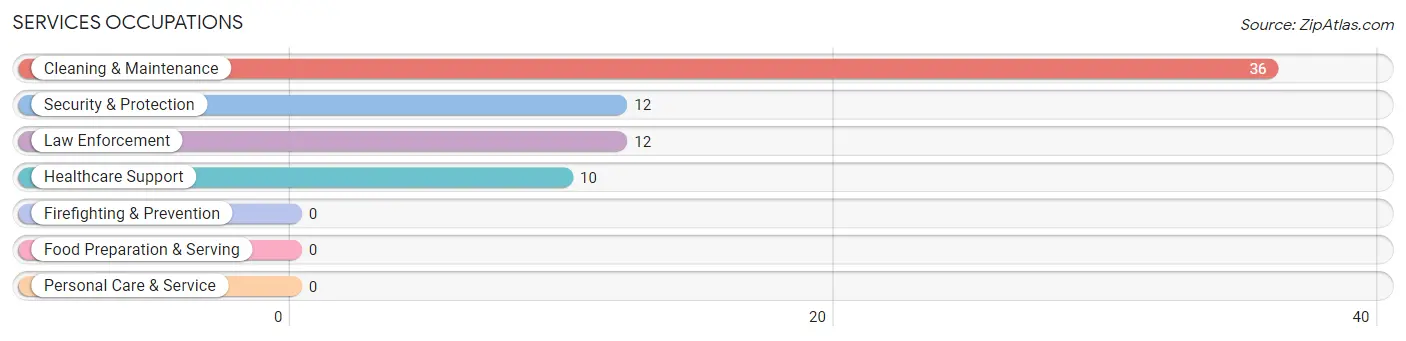
Services Occupations
The most common Services occupations in Tallaboa Alta are Cleaning & Maintenance (36 | 10.3%), Security & Protection (12 | 3.4%), Law Enforcement (12 | 3.4%), and Healthcare Support (10 | 2.9%).
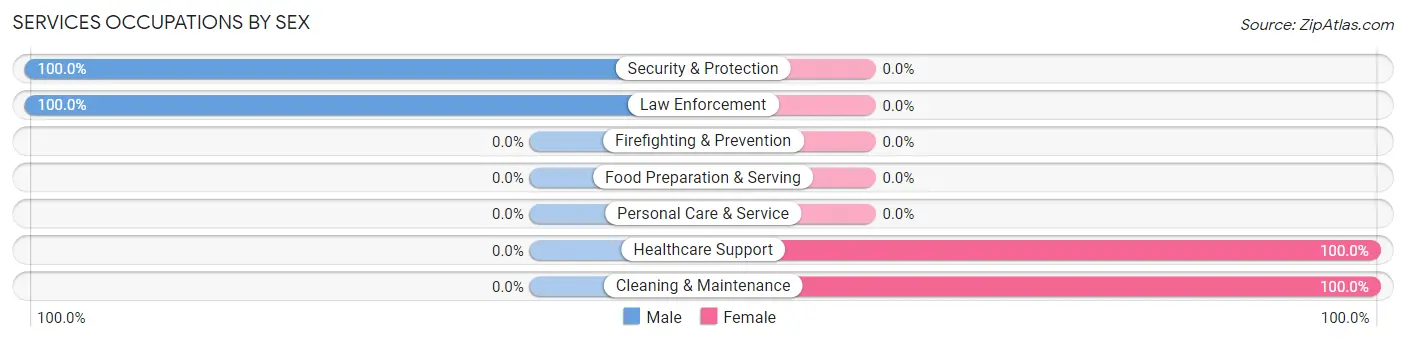
Services Occupations by Sex
Within the Services occupations in Tallaboa Alta, the most male-oriented occupations are Security & Protection (100.0%), and Law Enforcement (100.0%), while the most female-oriented occupations are Healthcare Support (100.0%), and Cleaning & Maintenance (100.0%).
| Occupation | Male | Female |
| Healthcare Support | 0 (0.0%) | 10 (100.0%) |
| Security & Protection | 12 (100.0%) | 0 (0.0%) |
| Firefighting & Prevention | 0 (0.0%) | 0 (0.0%) |
| Law Enforcement | 12 (100.0%) | 0 (0.0%) |
| Food Preparation & Serving | 0 (0.0%) | 0 (0.0%) |
| Cleaning & Maintenance | 0 (0.0%) | 36 (100.0%) |
| Personal Care & Service | 0 (0.0%) | 0 (0.0%) |
| Total (Category) | 12 (20.7%) | 46 (79.3%) |
| Total (Overall) | 224 (64.0%) | 126 (36.0%) |
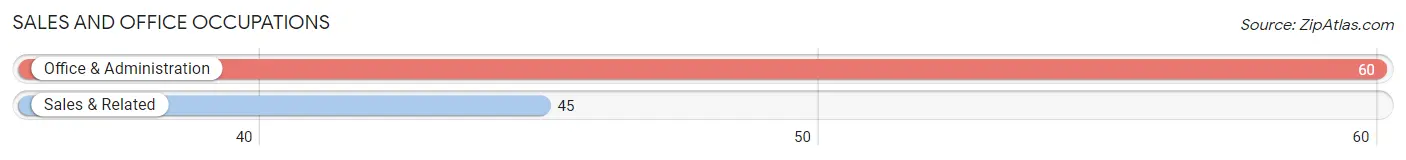
Sales and Office Occupations
The most common Sales and Office occupations in Tallaboa Alta are Office & Administration (60 | 17.1%), and Sales & Related (45 | 12.9%).
Sales and Office Occupations by Sex
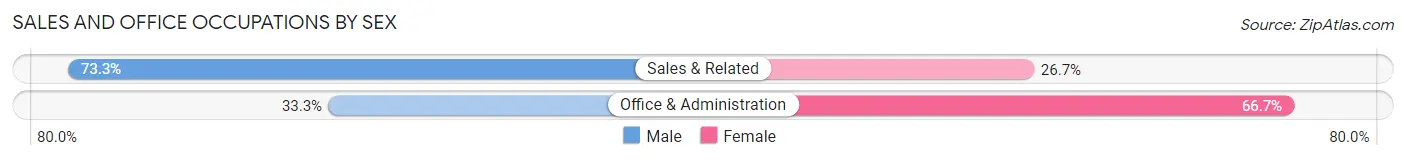
| Occupation | Male | Female |
| Sales & Related | 33 (73.3%) | 12 (26.7%) |
| Office & Administration | 20 (33.3%) | 40 (66.7%) |
| Total (Category) | 53 (50.5%) | 52 (49.5%) |
| Total (Overall) | 224 (64.0%) | 126 (36.0%) |
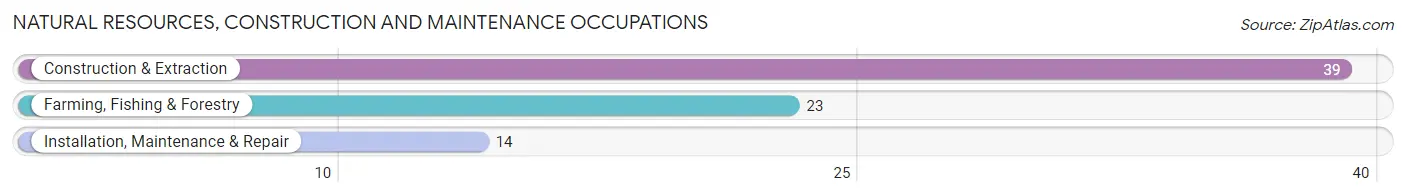
Natural Resources, Construction and Maintenance Occupations
The most common Natural Resources, Construction and Maintenance occupations in Tallaboa Alta are Construction & Extraction (39 | 11.1%), Farming, Fishing & Forestry (23 | 6.6%), and Installation, Maintenance & Repair (14 | 4.0%).
Natural Resources, Construction and Maintenance Occupations by Sex
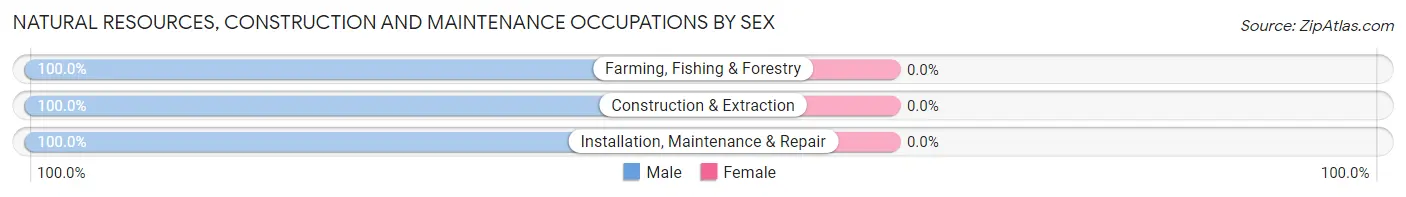
| Occupation | Male | Female |
| Farming, Fishing & Forestry | 23 (100.0%) | 0 (0.0%) |
| Construction & Extraction | 39 (100.0%) | 0 (0.0%) |
| Installation, Maintenance & Repair | 14 (100.0%) | 0 (0.0%) |
| Total (Category) | 76 (100.0%) | 0 (0.0%) |
| Total (Overall) | 224 (64.0%) | 126 (36.0%) |
Production, Transportation and Moving Occupations
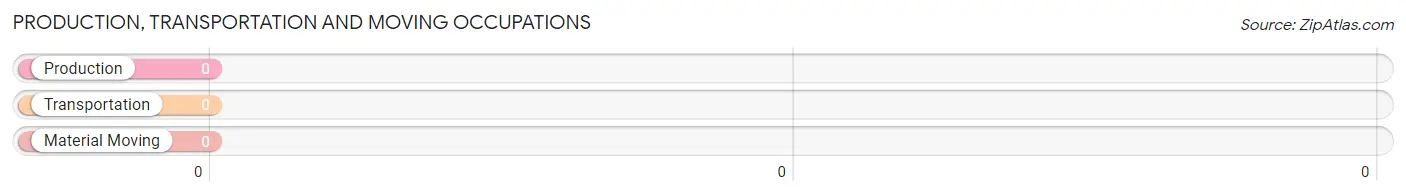
Production, Transportation and Moving Occupations by Sex
| Occupation | Male | Female |
| Production | 0 (0.0%) | 0 (0.0%) |
| Transportation | 0 (0.0%) | 0 (0.0%) |
| Material Moving | 0 (0.0%) | 0 (0.0%) |
| Total (Category) | 0 (0.0%) | 0 (0.0%) |
| Total (Overall) | 224 (64.0%) | 126 (36.0%) |
Employment Industries by Sex in Tallaboa Alta
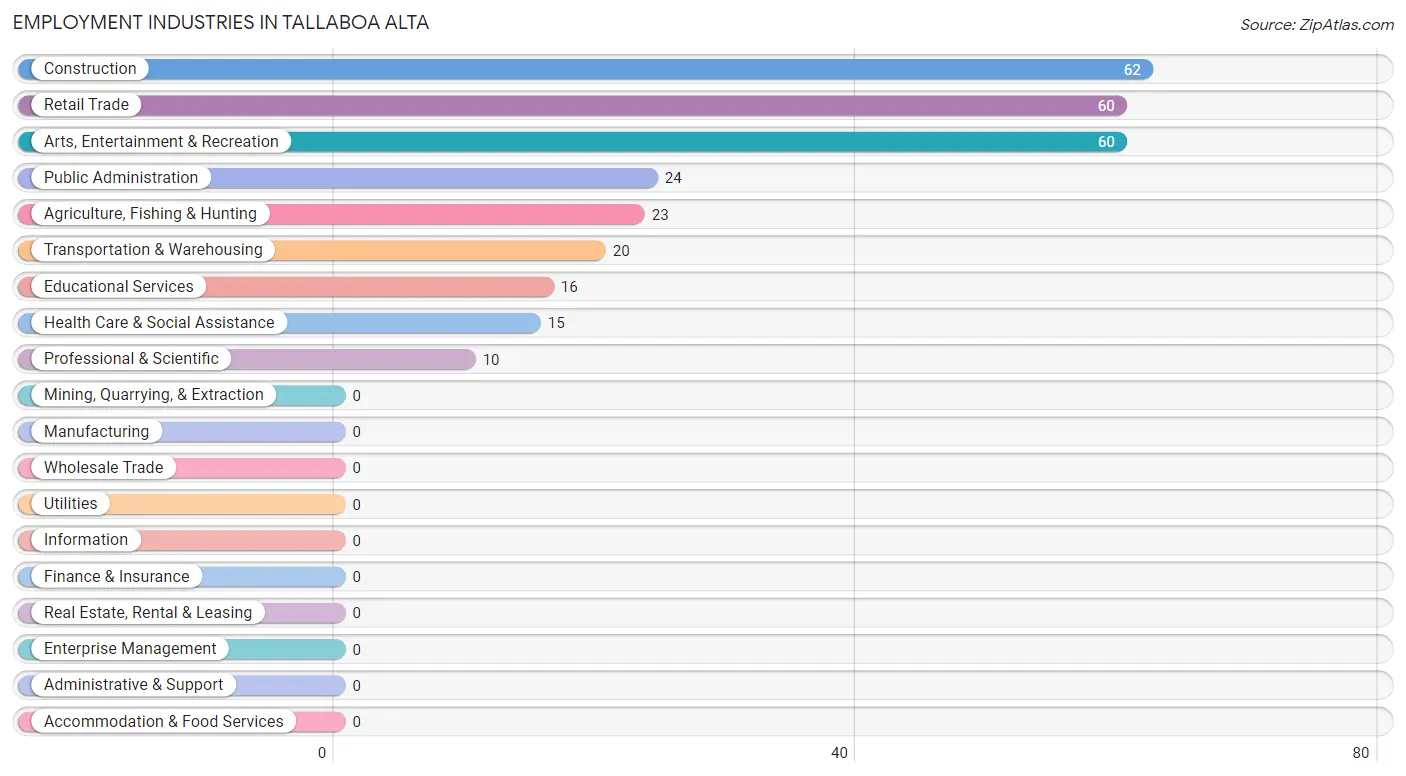
Employment Industries in Tallaboa Alta
The major employment industries in Tallaboa Alta include Construction (62 | 17.7%), Retail Trade (60 | 17.1%), Arts, Entertainment & Recreation (60 | 17.1%), Public Administration (24 | 6.9%), and Agriculture, Fishing & Hunting (23 | 6.6%).
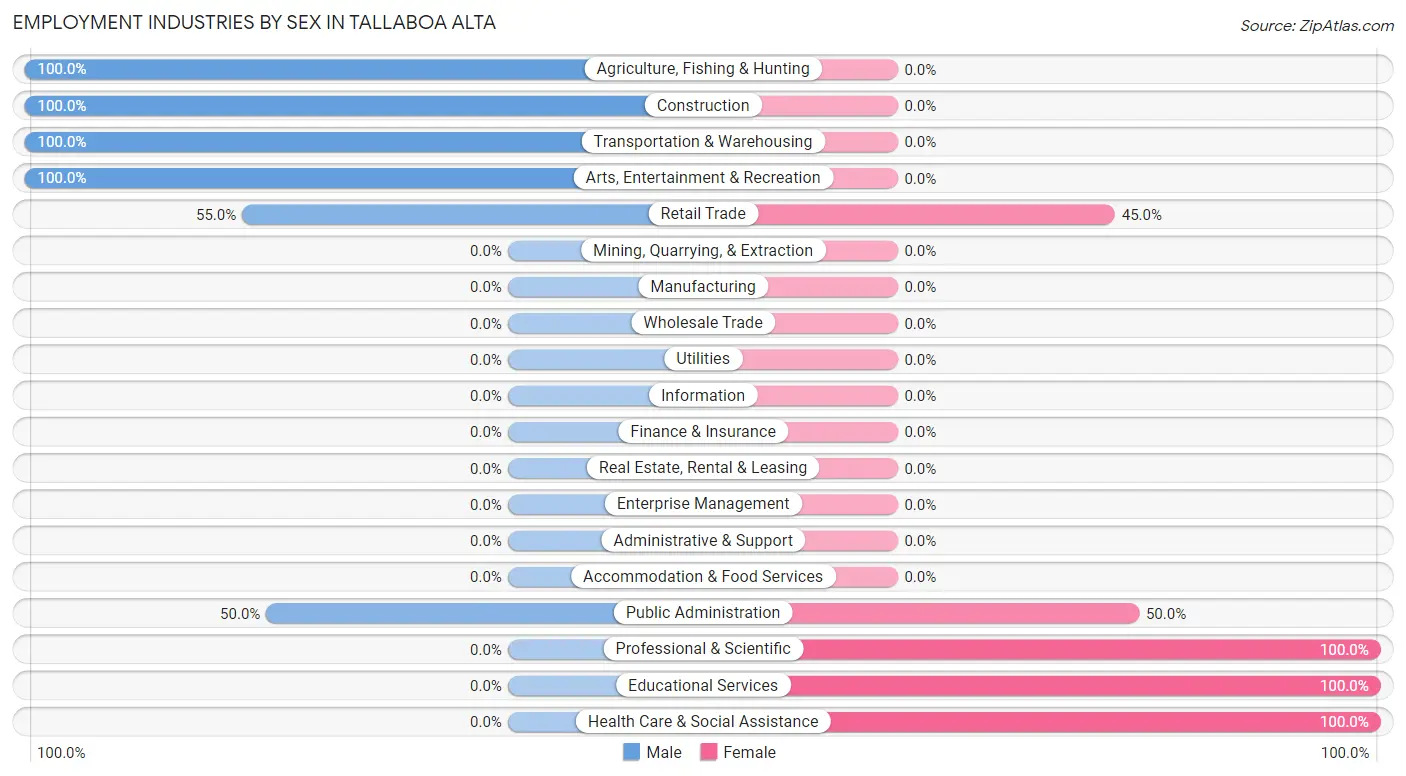
Employment Industries by Sex in Tallaboa Alta
The Tallaboa Alta industries that see more men than women are Agriculture, Fishing & Hunting (100.0%), Construction (100.0%), and Transportation & Warehousing (100.0%), whereas the industries that tend to have a higher number of women are Professional & Scientific (100.0%), Educational Services (100.0%), and Health Care & Social Assistance (100.0%).
| Industry | Male | Female |
| Agriculture, Fishing & Hunting | 23 (100.0%) | 0 (0.0%) |
| Mining, Quarrying, & Extraction | 0 (0.0%) | 0 (0.0%) |
| Construction | 62 (100.0%) | 0 (0.0%) |
| Manufacturing | 0 (0.0%) | 0 (0.0%) |
| Wholesale Trade | 0 (0.0%) | 0 (0.0%) |
| Retail Trade | 33 (55.0%) | 27 (45.0%) |
| Transportation & Warehousing | 20 (100.0%) | 0 (0.0%) |
| Utilities | 0 (0.0%) | 0 (0.0%) |
| Information | 0 (0.0%) | 0 (0.0%) |
| Finance & Insurance | 0 (0.0%) | 0 (0.0%) |
| Real Estate, Rental & Leasing | 0 (0.0%) | 0 (0.0%) |
| Professional & Scientific | 0 (0.0%) | 10 (100.0%) |
| Enterprise Management | 0 (0.0%) | 0 (0.0%) |
| Administrative & Support | 0 (0.0%) | 0 (0.0%) |
| Educational Services | 0 (0.0%) | 16 (100.0%) |
| Health Care & Social Assistance | 0 (0.0%) | 15 (100.0%) |
| Arts, Entertainment & Recreation | 60 (100.0%) | 0 (0.0%) |
| Accommodation & Food Services | 0 (0.0%) | 0 (0.0%) |
| Public Administration | 12 (50.0%) | 12 (50.0%) |
| Total | 224 (64.0%) | 126 (36.0%) |
Education in Tallaboa Alta
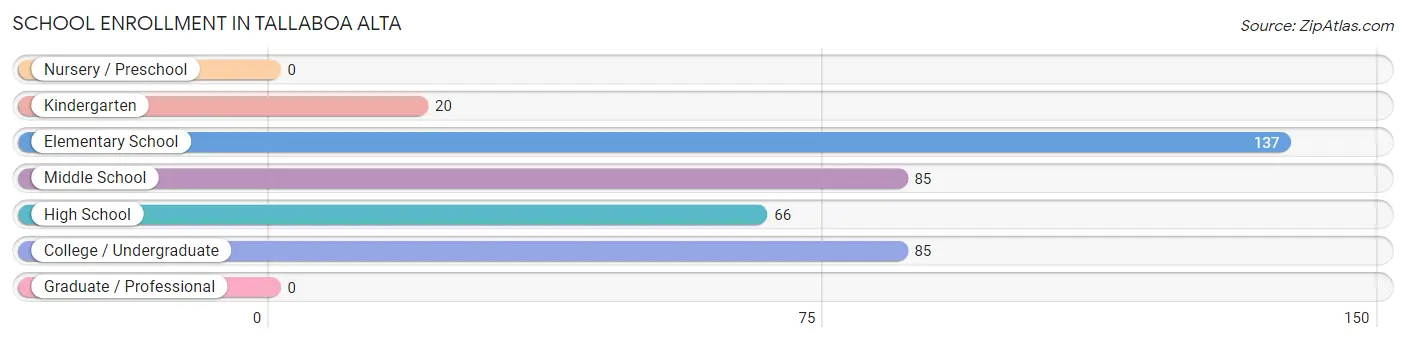
School Enrollment in Tallaboa Alta
The most common levels of schooling among the 393 students in Tallaboa Alta are elementary school (137 | 34.9%), middle school (85 | 21.6%), and college / undergraduate (85 | 21.6%).
| School Level | # Students | % Students |
| Nursery / Preschool | 0 | 0.0% |
| Kindergarten | 20 | 5.1% |
| Elementary School | 137 | 34.9% |
| Middle School | 85 | 21.6% |
| High School | 66 | 16.8% |
| College / Undergraduate | 85 | 21.6% |
| Graduate / Professional | 0 | 0.0% |
| Total | 393 | 100.0% |
School Enrollment by Age by Funding Source in Tallaboa Alta
Out of a total of 393 students who are enrolled in schools in Tallaboa Alta, 80 (20.4%) attend a private institution, while the remaining 313 (79.6%) are enrolled in public schools. The age group of 20 to 24 year olds has the highest likelihood of being enrolled in private schools, with 10 (100.0% in the age bracket) enrolled. Conversely, the age group of 5 to 9 year old has the lowest likelihood of being enrolled in a private school, with 107 (100.0% in the age bracket) attending a public institution.
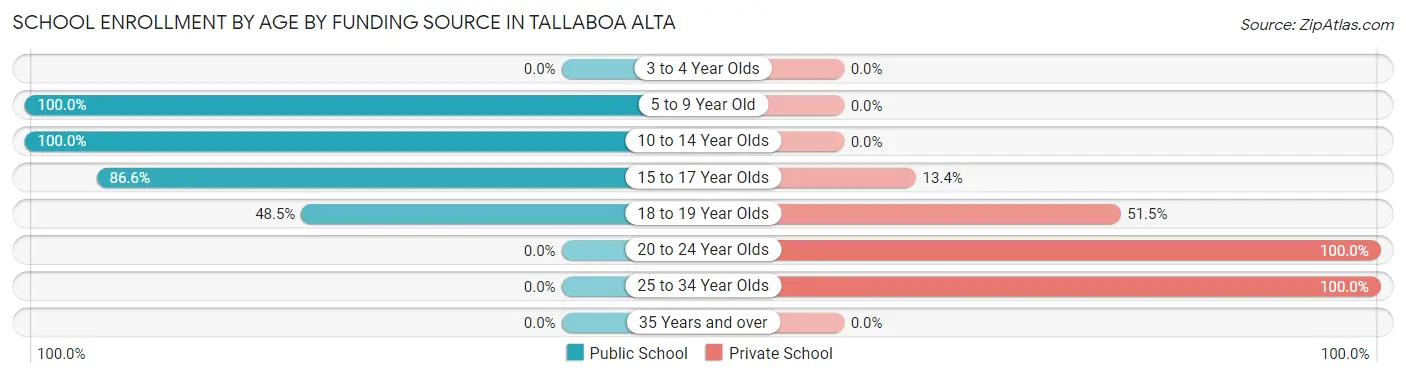
| Age Bracket | Public School | Private School |
| 3 to 4 Year Olds | 0 (0.0%) | 0 (0.0%) |
| 5 to 9 Year Old | 107 (100.0%) | 0 (0.0%) |
| 10 to 14 Year Olds | 119 (100.0%) | 0 (0.0%) |
| 15 to 17 Year Olds | 71 (86.6%) | 11 (13.4%) |
| 18 to 19 Year Olds | 16 (48.5%) | 17 (51.5%) |
| 20 to 24 Year Olds | 0 (0.0%) | 10 (100.0%) |
| 25 to 34 Year Olds | 0 (0.0%) | 42 (100.0%) |
| 35 Years and over | 0 (0.0%) | 0 (0.0%) |
| Total | 313 (79.6%) | 80 (20.4%) |
Educational Attainment by Field of Study in Tallaboa Alta
Education (75 | 48.4%), arts & humanities (47 | 30.3%), liberal arts & history (25 | 16.1%), and business (8 | 5.2%) are the most common fields of study among 155 individuals in Tallaboa Alta who have obtained a bachelor's degree or higher.
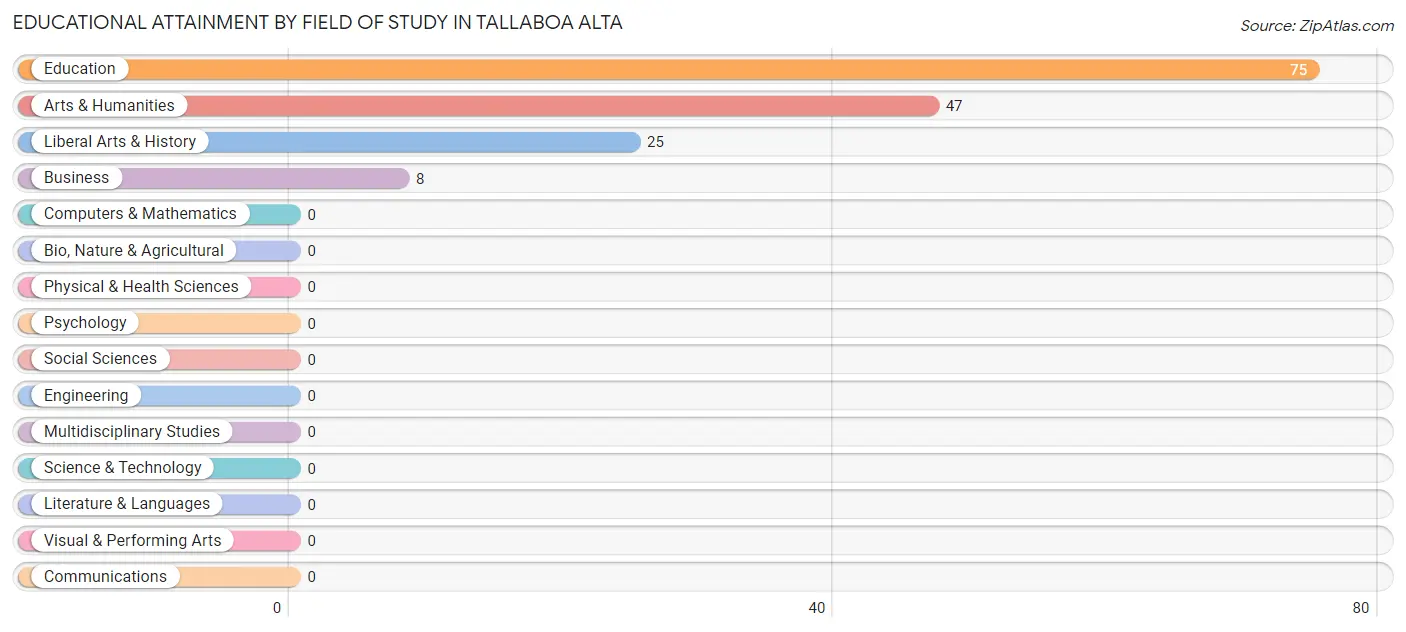
| Field of Study | # Graduates | % Graduates |
| Computers & Mathematics | 0 | 0.0% |
| Bio, Nature & Agricultural | 0 | 0.0% |
| Physical & Health Sciences | 0 | 0.0% |
| Psychology | 0 | 0.0% |
| Social Sciences | 0 | 0.0% |
| Engineering | 0 | 0.0% |
| Multidisciplinary Studies | 0 | 0.0% |
| Science & Technology | 0 | 0.0% |
| Business | 8 | 5.2% |
| Education | 75 | 48.4% |
| Literature & Languages | 0 | 0.0% |
| Liberal Arts & History | 25 | 16.1% |
| Visual & Performing Arts | 0 | 0.0% |
| Communications | 0 | 0.0% |
| Arts & Humanities | 47 | 30.3% |
| Total | 155 | 100.0% |
Transportation & Commute in Tallaboa Alta
Vehicle Availability by Sex in Tallaboa Alta
The most prevalent vehicle ownership categories in Tallaboa Alta are males with 2 vehicles (175, accounting for 78.1%) and females with 2 vehicles (89, making up 138.9%).
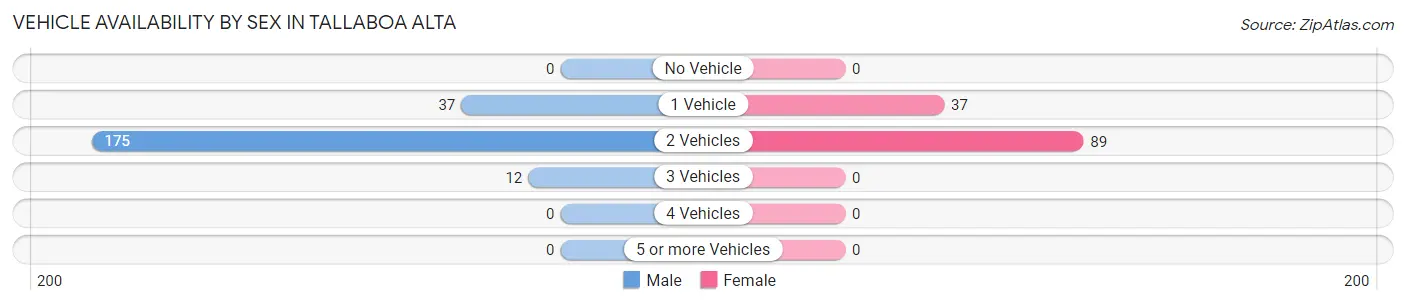
| Vehicles Available | Male | Female |
| No Vehicle | 0 (0.0%) | 0 (0.0%) |
| 1 Vehicle | 37 (16.5%) | 37 (29.4%) |
| 2 Vehicles | 175 (78.1%) | 89 (70.6%) |
| 3 Vehicles | 12 (5.4%) | 0 (0.0%) |
| 4 Vehicles | 0 (0.0%) | 0 (0.0%) |
| 5 or more Vehicles | 0 (0.0%) | 0 (0.0%) |
| Total | 224 (100.0%) | 126 (100.0%) |
Commute Time in Tallaboa Alta
The most frequently occuring commute durations in Tallaboa Alta are 15 to 19 minutes (173 commuters, 54.9%), 20 to 24 minutes (41 commuters, 13.0%), and 10 to 14 minutes (39 commuters, 12.4%).
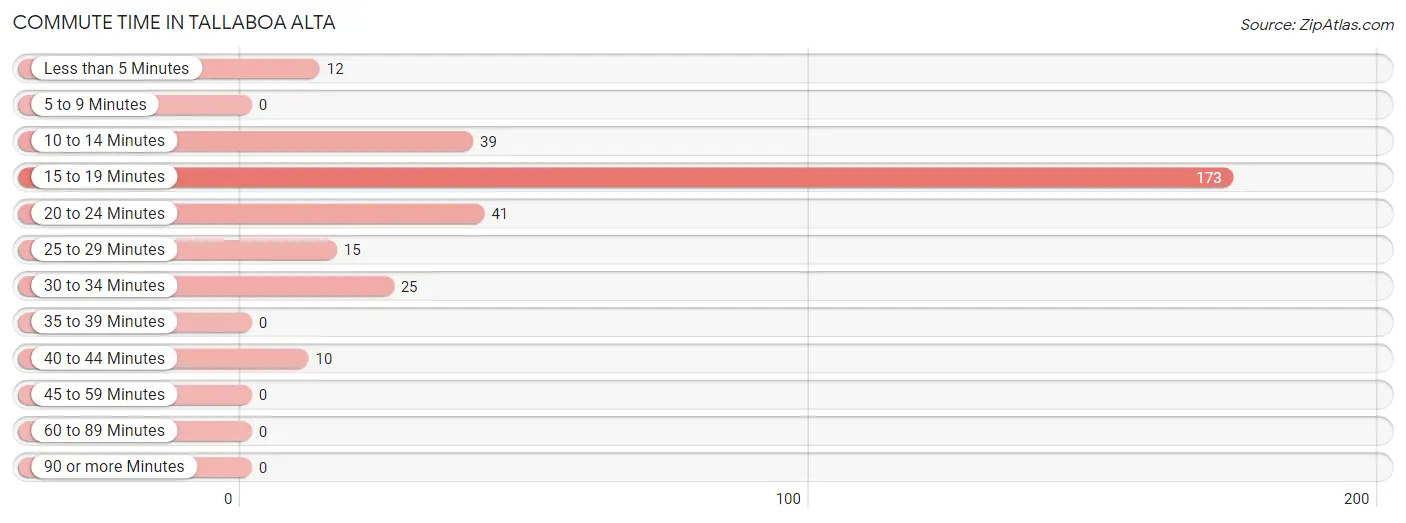
| Commute Time | # Commuters | % Commuters |
| Less than 5 Minutes | 12 | 3.8% |
| 5 to 9 Minutes | 0 | 0.0% |
| 10 to 14 Minutes | 39 | 12.4% |
| 15 to 19 Minutes | 173 | 54.9% |
| 20 to 24 Minutes | 41 | 13.0% |
| 25 to 29 Minutes | 15 | 4.8% |
| 30 to 34 Minutes | 25 | 7.9% |
| 35 to 39 Minutes | 0 | 0.0% |
| 40 to 44 Minutes | 10 | 3.2% |
| 45 to 59 Minutes | 0 | 0.0% |
| 60 to 89 Minutes | 0 | 0.0% |
| 90 or more Minutes | 0 | 0.0% |
Commute Time by Sex in Tallaboa Alta
The most common commute times in Tallaboa Alta are 15 to 19 minutes (111 commuters, 55.2%) for males and 15 to 19 minutes (62 commuters, 54.4%) for females.
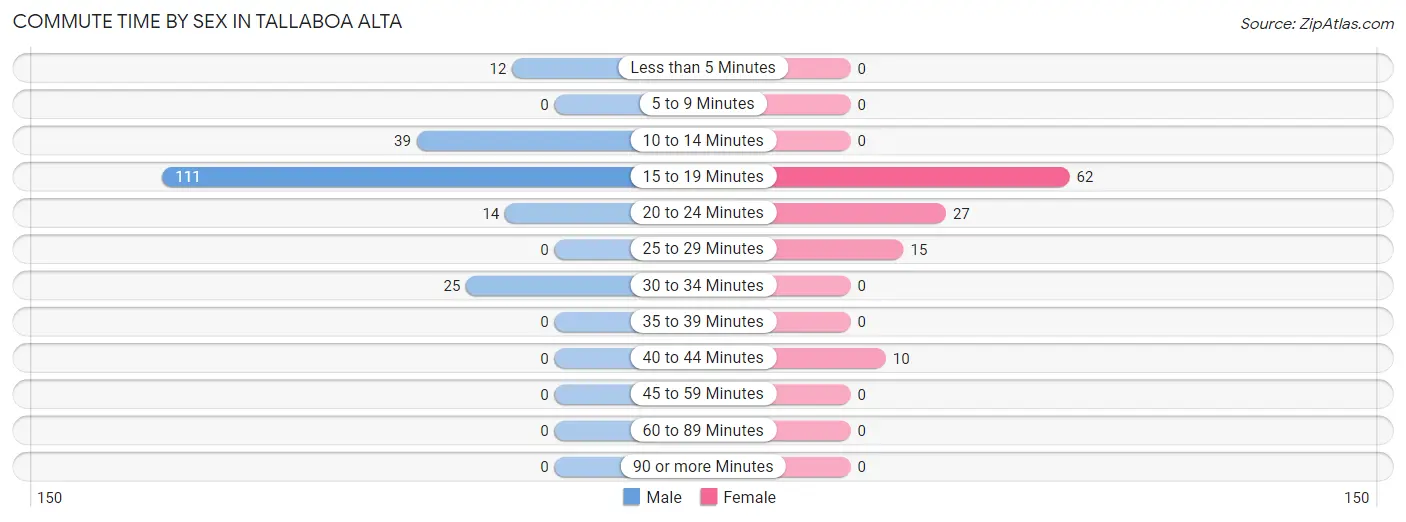
| Commute Time | Male | Female |
| Less than 5 Minutes | 12 (6.0%) | 0 (0.0%) |
| 5 to 9 Minutes | 0 (0.0%) | 0 (0.0%) |
| 10 to 14 Minutes | 39 (19.4%) | 0 (0.0%) |
| 15 to 19 Minutes | 111 (55.2%) | 62 (54.4%) |
| 20 to 24 Minutes | 14 (7.0%) | 27 (23.7%) |
| 25 to 29 Minutes | 0 (0.0%) | 15 (13.2%) |
| 30 to 34 Minutes | 25 (12.4%) | 0 (0.0%) |
| 35 to 39 Minutes | 0 (0.0%) | 0 (0.0%) |
| 40 to 44 Minutes | 0 (0.0%) | 10 (8.8%) |
| 45 to 59 Minutes | 0 (0.0%) | 0 (0.0%) |
| 60 to 89 Minutes | 0 (0.0%) | 0 (0.0%) |
| 90 or more Minutes | 0 (0.0%) | 0 (0.0%) |
Time of Departure to Work by Sex in Tallaboa Alta
The most frequent times of departure to work in Tallaboa Alta are 7:00 AM to 7:29 AM (59, 29.3%) for males and 7:30 AM to 7:59 AM (43, 37.7%) for females.
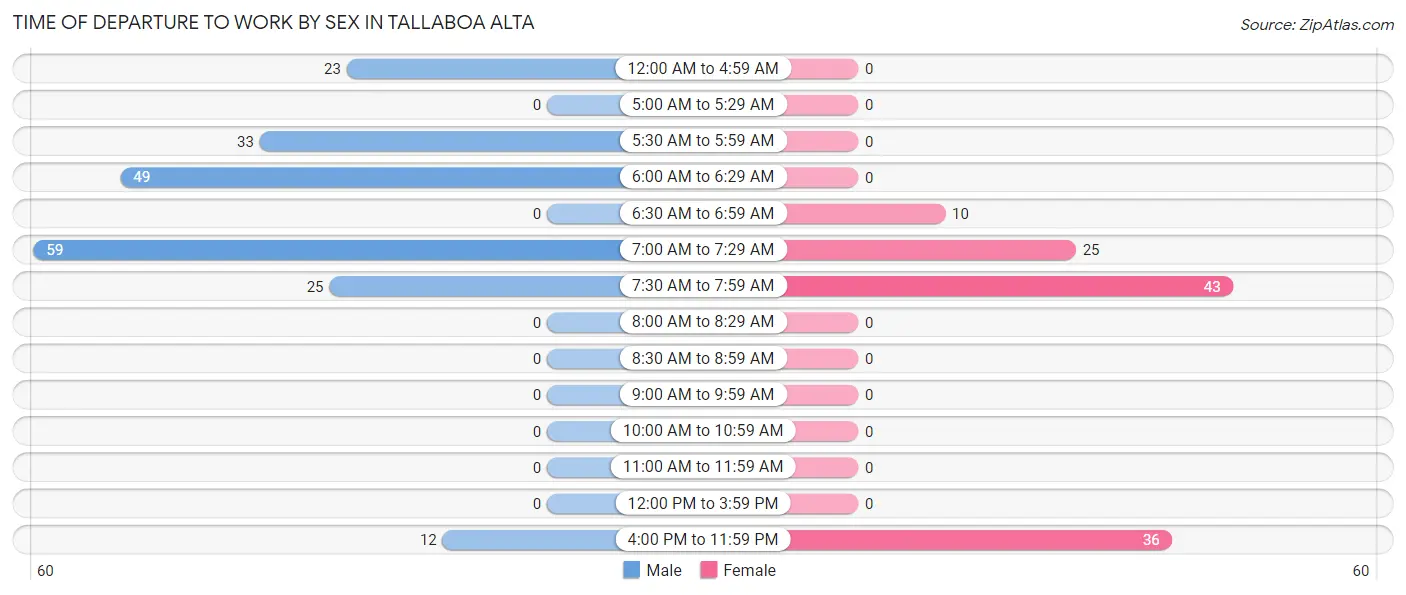
| Time of Departure | Male | Female |
| 12:00 AM to 4:59 AM | 23 (11.4%) | 0 (0.0%) |
| 5:00 AM to 5:29 AM | 0 (0.0%) | 0 (0.0%) |
| 5:30 AM to 5:59 AM | 33 (16.4%) | 0 (0.0%) |
| 6:00 AM to 6:29 AM | 49 (24.4%) | 0 (0.0%) |
| 6:30 AM to 6:59 AM | 0 (0.0%) | 10 (8.8%) |
| 7:00 AM to 7:29 AM | 59 (29.3%) | 25 (21.9%) |
| 7:30 AM to 7:59 AM | 25 (12.4%) | 43 (37.7%) |
| 8:00 AM to 8:29 AM | 0 (0.0%) | 0 (0.0%) |
| 8:30 AM to 8:59 AM | 0 (0.0%) | 0 (0.0%) |
| 9:00 AM to 9:59 AM | 0 (0.0%) | 0 (0.0%) |
| 10:00 AM to 10:59 AM | 0 (0.0%) | 0 (0.0%) |
| 11:00 AM to 11:59 AM | 0 (0.0%) | 0 (0.0%) |
| 12:00 PM to 3:59 PM | 0 (0.0%) | 0 (0.0%) |
| 4:00 PM to 11:59 PM | 12 (6.0%) | 36 (31.6%) |
| Total | 201 (100.0%) | 114 (100.0%) |
Housing Occupancy in Tallaboa Alta
Occupancy by Ownership in Tallaboa Alta
Of the total 441 dwellings in Tallaboa Alta, owner-occupied units account for 345 (78.2%), while renter-occupied units make up 96 (21.8%).
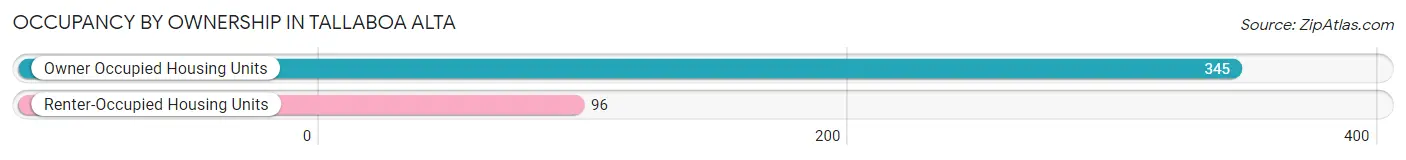
| Occupancy | # Housing Units | % Housing Units |
| Owner Occupied Housing Units | 345 | 78.2% |
| Renter-Occupied Housing Units | 96 | 21.8% |
| Total Occupied Housing Units | 441 | 100.0% |
Occupancy by Household Size in Tallaboa Alta
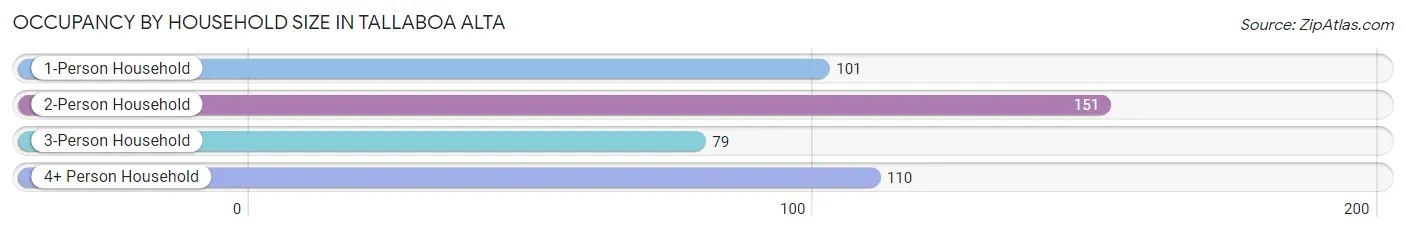
| Household Size | # Housing Units | % Housing Units |
| 1-Person Household | 101 | 22.9% |
| 2-Person Household | 151 | 34.2% |
| 3-Person Household | 79 | 17.9% |
| 4+ Person Household | 110 | 24.9% |
| Total Housing Units | 441 | 100.0% |
Occupancy by Ownership by Household Size in Tallaboa Alta
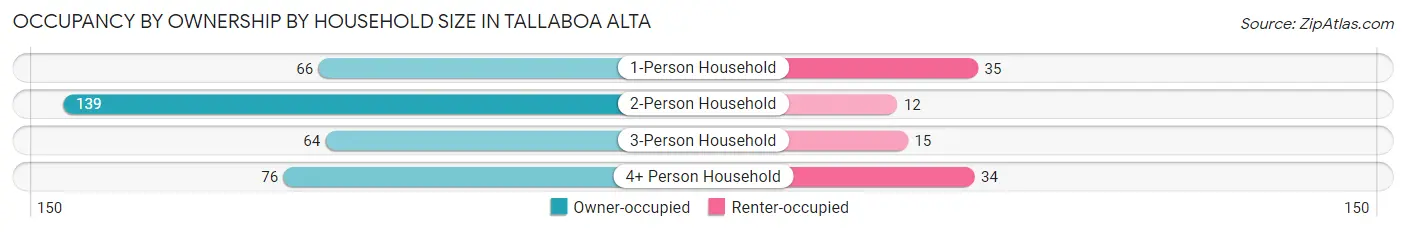
| Household Size | Owner-occupied | Renter-occupied |
| 1-Person Household | 66 (65.3%) | 35 (34.6%) |
| 2-Person Household | 139 (92.0%) | 12 (8.0%) |
| 3-Person Household | 64 (81.0%) | 15 (19.0%) |
| 4+ Person Household | 76 (69.1%) | 34 (30.9%) |
| Total Housing Units | 345 (78.2%) | 96 (21.8%) |
Occupancy by Educational Attainment in Tallaboa Alta
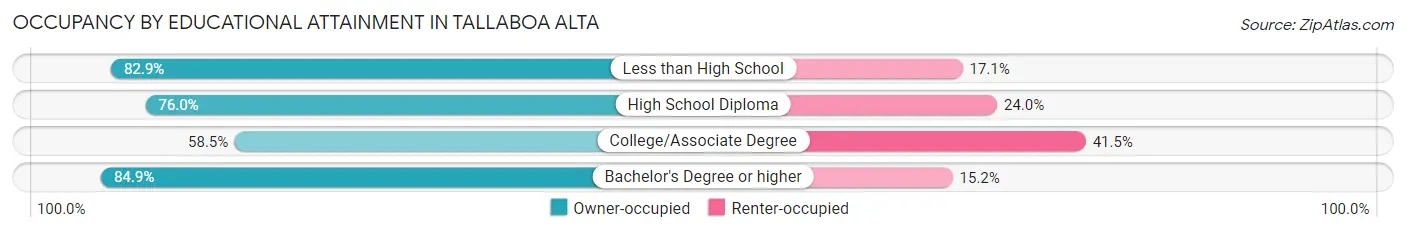
| Household Size | Owner-occupied | Renter-occupied |
| Less than High School | 150 (82.9%) | 31 (17.1%) |
| High School Diploma | 73 (76.0%) | 23 (24.0%) |
| College/Associate Degree | 38 (58.5%) | 27 (41.5%) |
| Bachelor's Degree or higher | 84 (84.9%) | 15 (15.1%) |
Occupancy by Age of Householder in Tallaboa Alta
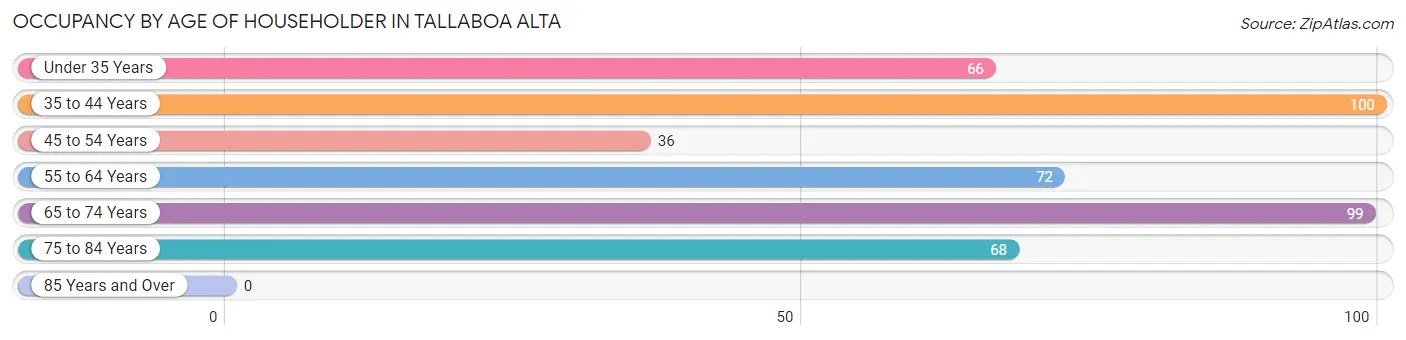
| Age Bracket | # Households | % Households |
| Under 35 Years | 66 | 15.0% |
| 35 to 44 Years | 100 | 22.7% |
| 45 to 54 Years | 36 | 8.2% |
| 55 to 64 Years | 72 | 16.3% |
| 65 to 74 Years | 99 | 22.5% |
| 75 to 84 Years | 68 | 15.4% |
| 85 Years and Over | 0 | 0.0% |
| Total | 441 | 100.0% |
Housing Finances in Tallaboa Alta
Median Income by Occupancy in Tallaboa Alta
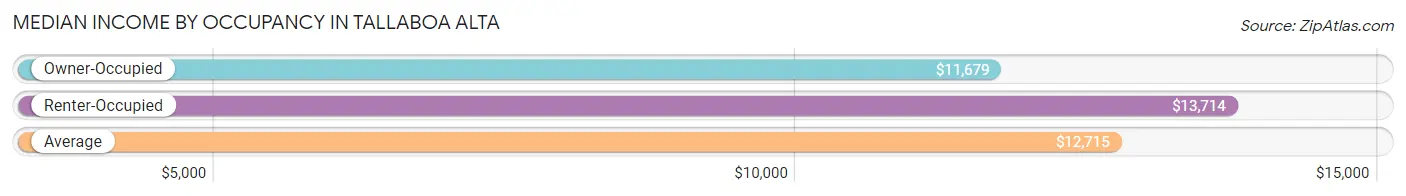
| Occupancy Type | # Households | Median Income |
| Owner-Occupied | 345 (78.2%) | $11,679 |
| Renter-Occupied | 96 (21.8%) | $13,714 |
| Average | 441 (100.0%) | $12,715 |
Occupancy by Householder Income Bracket in Tallaboa Alta
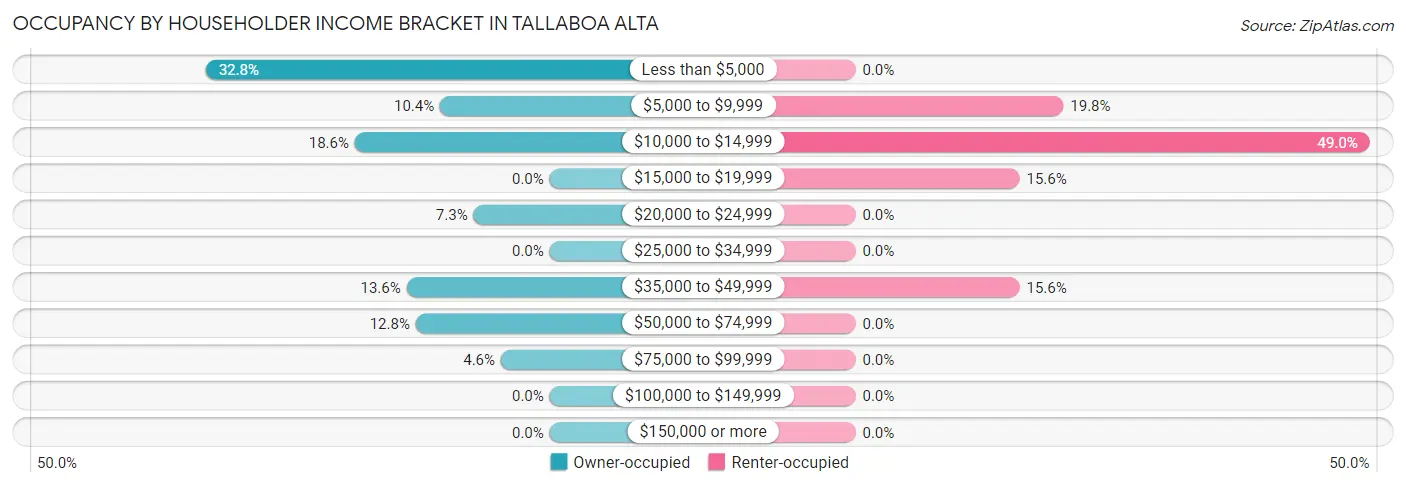
| Income Bracket | Owner-occupied | Renter-occupied |
| Less than $5,000 | 113 (32.8%) | 0 (0.0%) |
| $5,000 to $9,999 | 36 (10.4%) | 19 (19.8%) |
| $10,000 to $14,999 | 64 (18.5%) | 47 (49.0%) |
| $15,000 to $19,999 | 0 (0.0%) | 15 (15.6%) |
| $20,000 to $24,999 | 25 (7.2%) | 0 (0.0%) |
| $25,000 to $34,999 | 0 (0.0%) | 0 (0.0%) |
| $35,000 to $49,999 | 47 (13.6%) | 15 (15.6%) |
| $50,000 to $74,999 | 44 (12.8%) | 0 (0.0%) |
| $75,000 to $99,999 | 16 (4.6%) | 0 (0.0%) |
| $100,000 to $149,999 | 0 (0.0%) | 0 (0.0%) |
| $150,000 or more | 0 (0.0%) | 0 (0.0%) |
| Total | 345 (100.0%) | 96 (100.0%) |
Monthly Housing Cost Tiers in Tallaboa Alta
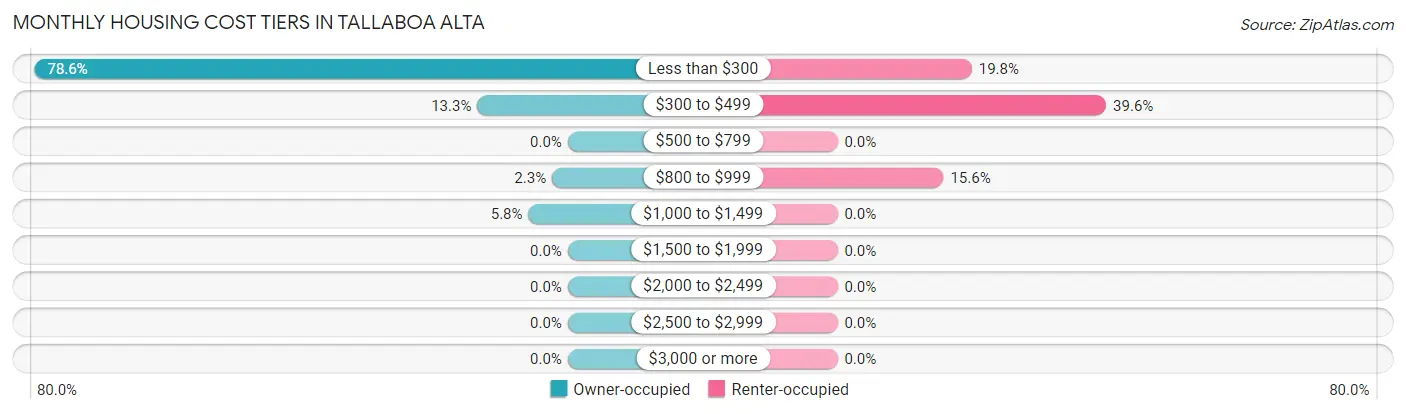
| Monthly Cost | Owner-occupied | Renter-occupied |
| Less than $300 | 271 (78.5%) | 19 (19.8%) |
| $300 to $499 | 46 (13.3%) | 38 (39.6%) |
| $500 to $799 | 0 (0.0%) | 0 (0.0%) |
| $800 to $999 | 8 (2.3%) | 15 (15.6%) |
| $1,000 to $1,499 | 20 (5.8%) | 0 (0.0%) |
| $1,500 to $1,999 | 0 (0.0%) | 0 (0.0%) |
| $2,000 to $2,499 | 0 (0.0%) | 0 (0.0%) |
| $2,500 to $2,999 | 0 (0.0%) | 0 (0.0%) |
| $3,000 or more | 0 (0.0%) | 0 (0.0%) |
| Total | 345 (100.0%) | 96 (100.0%) |
Physical Housing Characteristics in Tallaboa Alta
Housing Structures in Tallaboa Alta
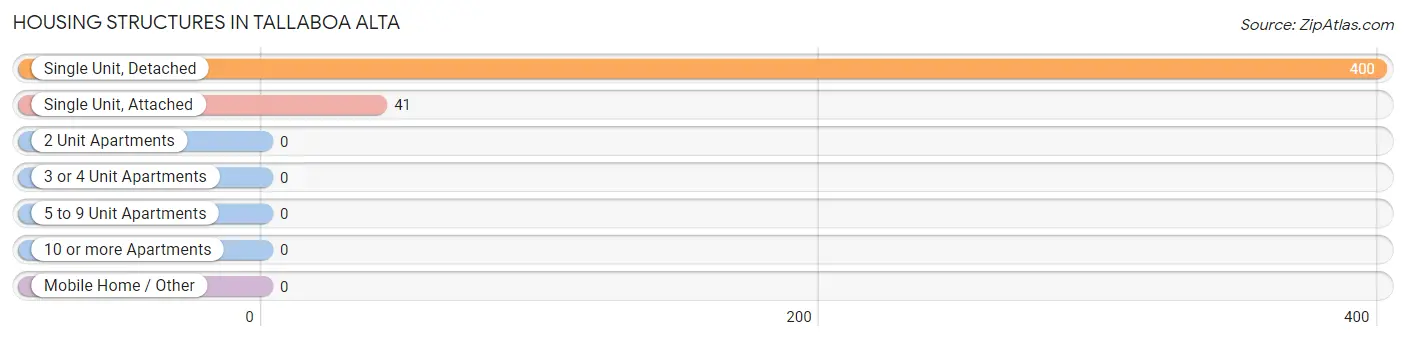
| Structure Type | # Housing Units | % Housing Units |
| Single Unit, Detached | 400 | 90.7% |
| Single Unit, Attached | 41 | 9.3% |
| 2 Unit Apartments | 0 | 0.0% |
| 3 or 4 Unit Apartments | 0 | 0.0% |
| 5 to 9 Unit Apartments | 0 | 0.0% |
| 10 or more Apartments | 0 | 0.0% |
| Mobile Home / Other | 0 | 0.0% |
| Total | 441 | 100.0% |
Housing Structures by Occupancy in Tallaboa Alta
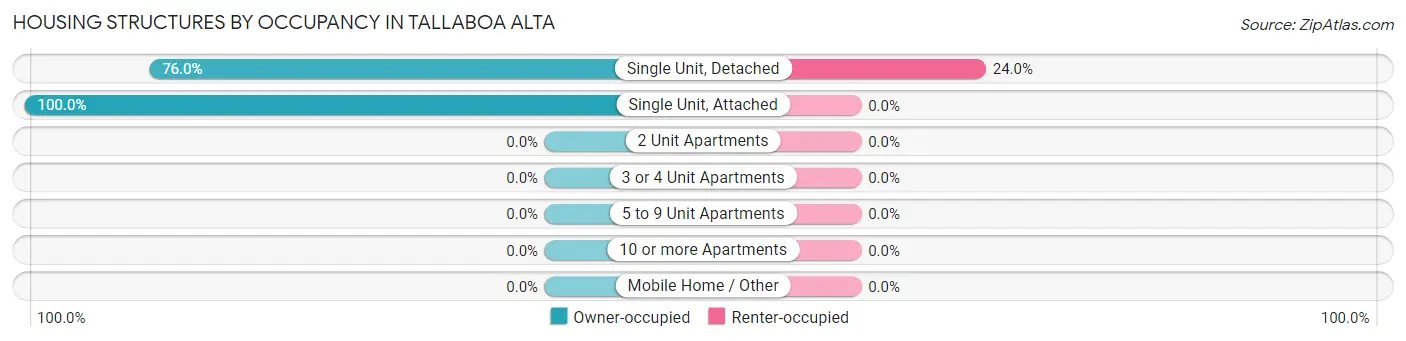
| Structure Type | Owner-occupied | Renter-occupied |
| Single Unit, Detached | 304 (76.0%) | 96 (24.0%) |
| Single Unit, Attached | 41 (100.0%) | 0 (0.0%) |
| 2 Unit Apartments | 0 (0.0%) | 0 (0.0%) |
| 3 or 4 Unit Apartments | 0 (0.0%) | 0 (0.0%) |
| 5 to 9 Unit Apartments | 0 (0.0%) | 0 (0.0%) |
| 10 or more Apartments | 0 (0.0%) | 0 (0.0%) |
| Mobile Home / Other | 0 (0.0%) | 0 (0.0%) |
| Total | 345 (78.2%) | 96 (21.8%) |
Housing Structures by Number of Rooms in Tallaboa Alta
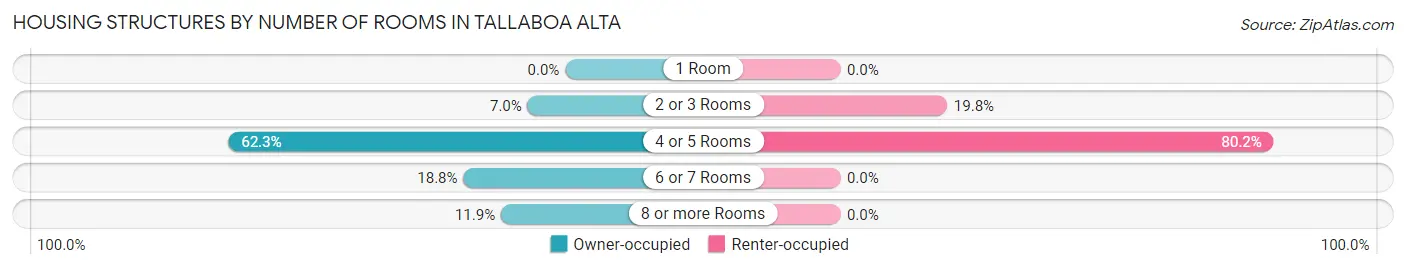
| Number of Rooms | Owner-occupied | Renter-occupied |
| 1 Room | 0 (0.0%) | 0 (0.0%) |
| 2 or 3 Rooms | 24 (7.0%) | 19 (19.8%) |
| 4 or 5 Rooms | 215 (62.3%) | 77 (80.2%) |
| 6 or 7 Rooms | 65 (18.8%) | 0 (0.0%) |
| 8 or more Rooms | 41 (11.9%) | 0 (0.0%) |
| Total | 345 (100.0%) | 96 (100.0%) |
Housing Structure by Heating Type in Tallaboa Alta
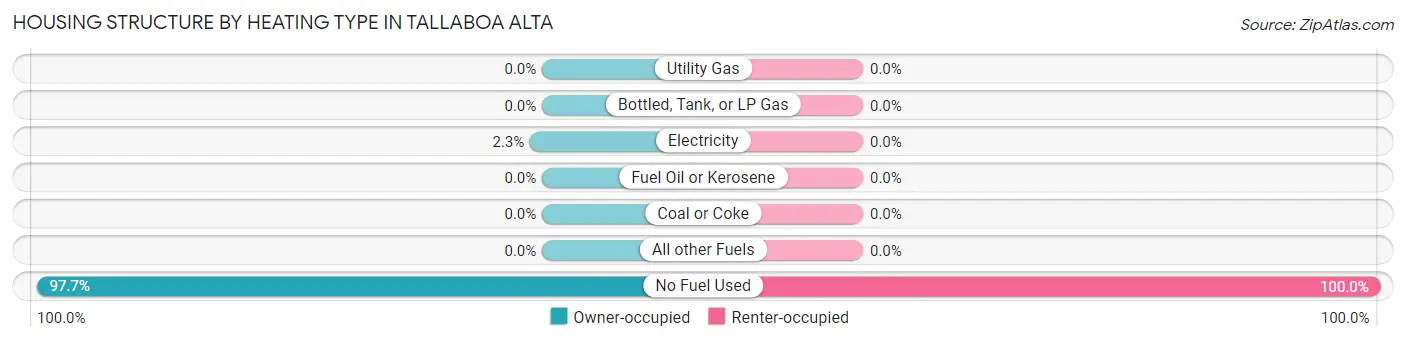
| Heating Type | Owner-occupied | Renter-occupied |
| Utility Gas | 0 (0.0%) | 0 (0.0%) |
| Bottled, Tank, or LP Gas | 0 (0.0%) | 0 (0.0%) |
| Electricity | 8 (2.3%) | 0 (0.0%) |
| Fuel Oil or Kerosene | 0 (0.0%) | 0 (0.0%) |
| Coal or Coke | 0 (0.0%) | 0 (0.0%) |
| All other Fuels | 0 (0.0%) | 0 (0.0%) |
| No Fuel Used | 337 (97.7%) | 96 (100.0%) |
| Total | 345 (100.0%) | 96 (100.0%) |
Household Vehicle Usage in Tallaboa Alta
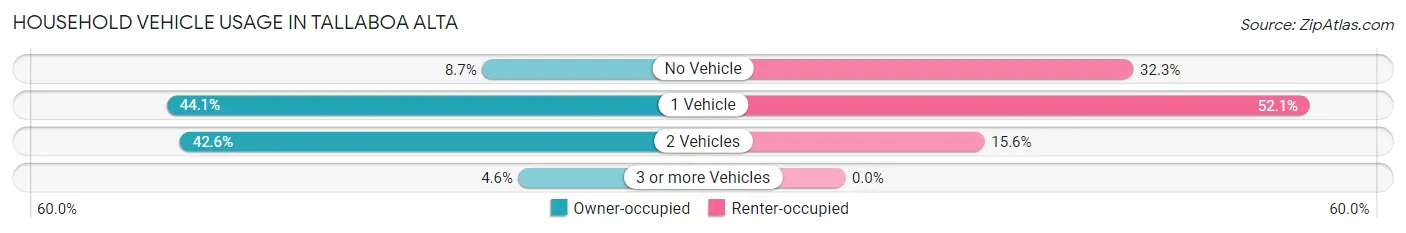
| Vehicles per Household | Owner-occupied | Renter-occupied |
| No Vehicle | 30 (8.7%) | 31 (32.3%) |
| 1 Vehicle | 152 (44.1%) | 50 (52.1%) |
| 2 Vehicles | 147 (42.6%) | 15 (15.6%) |
| 3 or more Vehicles | 16 (4.6%) | 0 (0.0%) |
| Total | 345 (100.0%) | 96 (100.0%) |
Real Estate & Mortgages in Tallaboa Alta
Real Estate and Mortgage Overview in Tallaboa Alta
| Characteristic | Without Mortgage | With Mortgage |
| Housing Units | 290 | 55 |
| Median Property Value | $60,600 | $0 |
| Median Household Income | $11,643 | $0 |
| Monthly Housing Costs | $160 | $0 |
| Real Estate Taxes | - | - |
Property Value by Mortgage Status in Tallaboa Alta
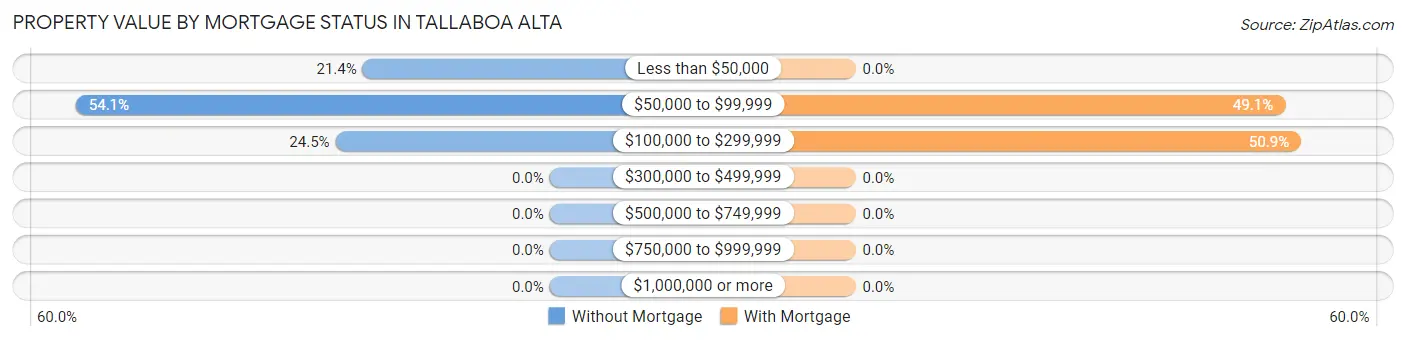
| Property Value | Without Mortgage | With Mortgage |
| Less than $50,000 | 62 (21.4%) | 0 (0.0%) |
| $50,000 to $99,999 | 157 (54.1%) | 27 (49.1%) |
| $100,000 to $299,999 | 71 (24.5%) | 28 (50.9%) |
| $300,000 to $499,999 | 0 (0.0%) | 0 (0.0%) |
| $500,000 to $749,999 | 0 (0.0%) | 0 (0.0%) |
| $750,000 to $999,999 | 0 (0.0%) | 0 (0.0%) |
| $1,000,000 or more | 0 (0.0%) | 0 (0.0%) |
| Total | 290 (100.0%) | 55 (100.0%) |
Household Income by Mortgage Status in Tallaboa Alta
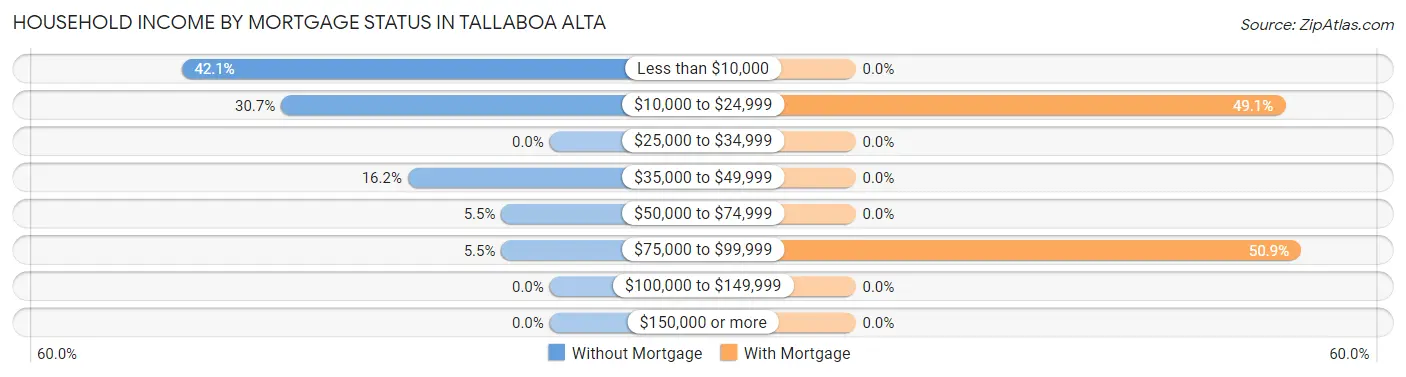
| Household Income | Without Mortgage | With Mortgage |
| Less than $10,000 | 122 (42.1%) | 0 (0.0%) |
| $10,000 to $24,999 | 89 (30.7%) | 27 (49.1%) |
| $25,000 to $34,999 | 0 (0.0%) | 0 (0.0%) |
| $35,000 to $49,999 | 47 (16.2%) | 0 (0.0%) |
| $50,000 to $74,999 | 16 (5.5%) | 0 (0.0%) |
| $75,000 to $99,999 | 16 (5.5%) | 28 (50.9%) |
| $100,000 to $149,999 | 0 (0.0%) | 0 (0.0%) |
| $150,000 or more | 0 (0.0%) | 0 (0.0%) |
| Total | 290 (100.0%) | 55 (100.0%) |
Property Value to Household Income Ratio in Tallaboa Alta
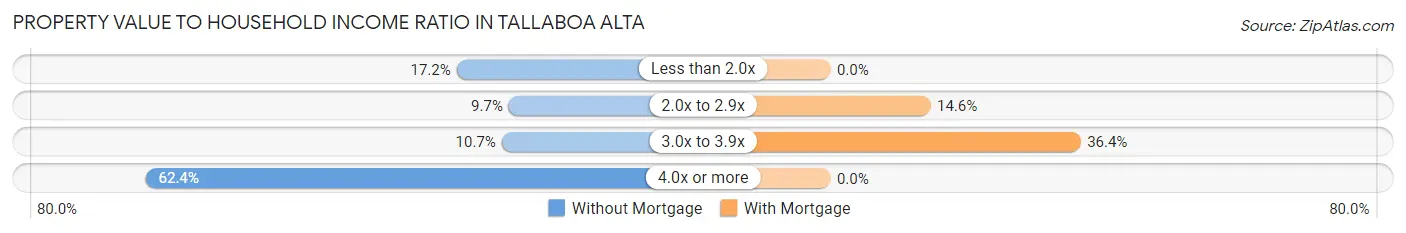
| Value-to-Income Ratio | Without Mortgage | With Mortgage |
| Less than 2.0x | 50 (17.2%) | 0 (0.0%) |
| 2.0x to 2.9x | 28 (9.7%) | 8 (14.5%) |
| 3.0x to 3.9x | 31 (10.7%) | 20 (36.4%) |
| 4.0x or more | 181 (62.4%) | 0 (0.0%) |
| Total | 290 (100.0%) | 55 (100.0%) |
Real Estate Taxes by Mortgage Status in Tallaboa Alta
| Property Taxes | Without Mortgage | With Mortgage |
| Less than $800 | 0 (0.0%) | 0 (0.0%) |
| $800 to $1,499 | 0 (0.0%) | 0 (0.0%) |
| $800 to $1,499 | 0 (0.0%) | 0 (0.0%) |
| Total | 290 (100.0%) | 55 (100.0%) |
Health & Disability in Tallaboa Alta
Health Insurance Coverage by Age in Tallaboa Alta
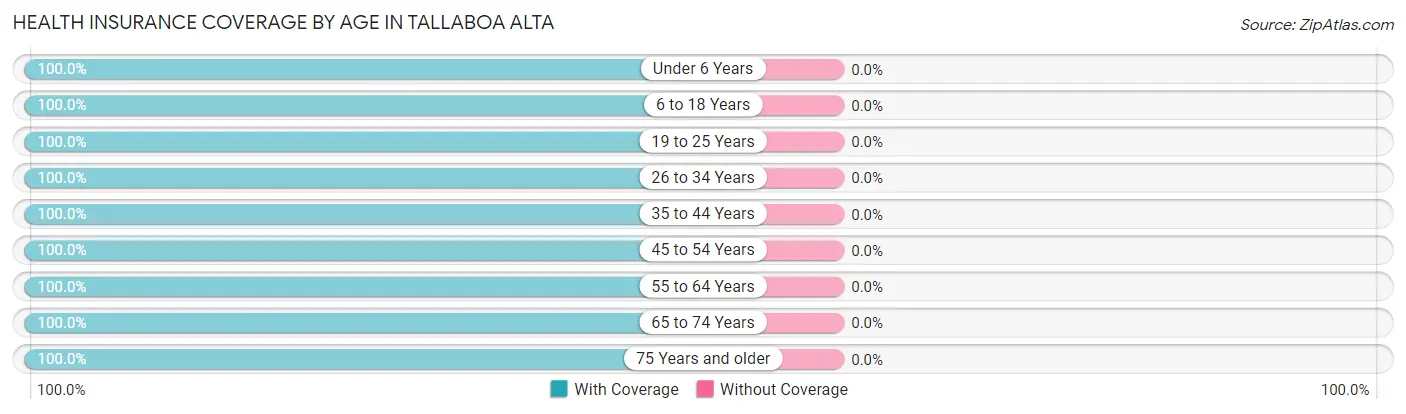
| Age Bracket | With Coverage | Without Coverage |
| Under 6 Years | 20 (100.0%) | 0 (0.0%) |
| 6 to 18 Years | 305 (100.0%) | 0 (0.0%) |
| 19 to 25 Years | 90 (100.0%) | 0 (0.0%) |
| 26 to 34 Years | 165 (100.0%) | 0 (0.0%) |
| 35 to 44 Years | 269 (100.0%) | 0 (0.0%) |
| 45 to 54 Years | 120 (100.0%) | 0 (0.0%) |
| 55 to 64 Years | 102 (100.0%) | 0 (0.0%) |
| 65 to 74 Years | 136 (100.0%) | 0 (0.0%) |
| 75 Years and older | 147 (100.0%) | 0 (0.0%) |
| Total | 1,354 (100.0%) | 0 (0.0%) |
Health Insurance Coverage by Citizenship Status in Tallaboa Alta
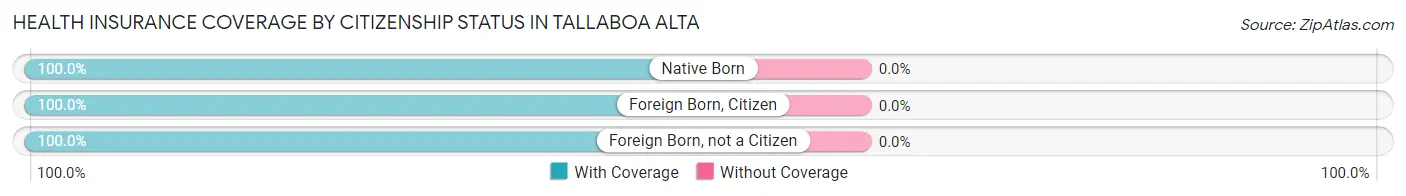
| Citizenship Status | With Coverage | Without Coverage |
| Native Born | 20 (100.0%) | 0 (0.0%) |
| Foreign Born, Citizen | 305 (100.0%) | 0 (0.0%) |
| Foreign Born, not a Citizen | 90 (100.0%) | 0 (0.0%) |
Health Insurance Coverage by Household Income in Tallaboa Alta
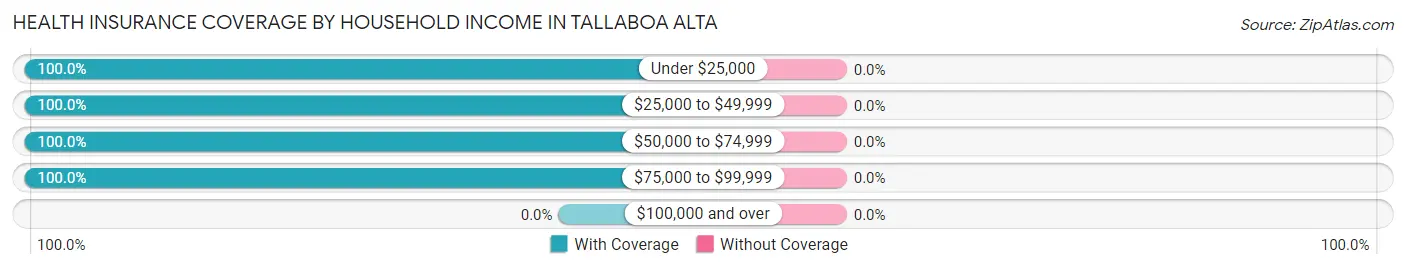
| Household Income | With Coverage | Without Coverage |
| Under $25,000 | 874 (100.0%) | 0 (0.0%) |
| $25,000 to $49,999 | 254 (100.0%) | 0 (0.0%) |
| $50,000 to $74,999 | 143 (100.0%) | 0 (0.0%) |
| $75,000 to $99,999 | 83 (100.0%) | 0 (0.0%) |
| $100,000 and over | 0 (0.0%) | 0 (0.0%) |
Public vs Private Health Insurance Coverage by Age in Tallaboa Alta
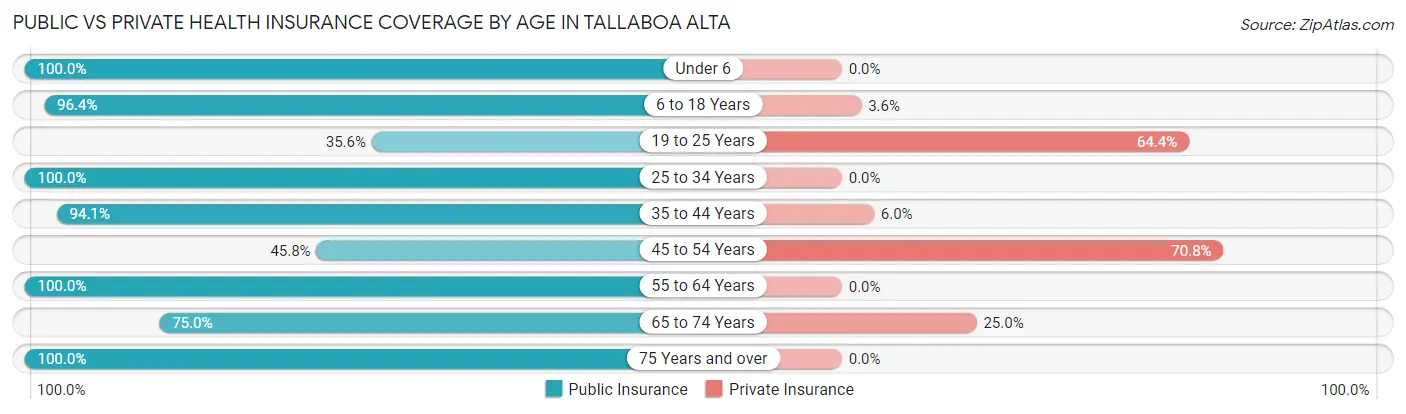
| Age Bracket | Public Insurance | Private Insurance |
| Under 6 | 20 (100.0%) | 0 (0.0%) |
| 6 to 18 Years | 294 (96.4%) | 11 (3.6%) |
| 19 to 25 Years | 32 (35.6%) | 58 (64.4%) |
| 25 to 34 Years | 165 (100.0%) | 0 (0.0%) |
| 35 to 44 Years | 253 (94.1%) | 16 (5.9%) |
| 45 to 54 Years | 55 (45.8%) | 85 (70.8%) |
| 55 to 64 Years | 102 (100.0%) | 0 (0.0%) |
| 65 to 74 Years | 102 (75.0%) | 34 (25.0%) |
| 75 Years and over | 147 (100.0%) | 0 (0.0%) |
| Total | 1,170 (86.4%) | 204 (15.1%) |
Disability Status by Sex by Age in Tallaboa Alta
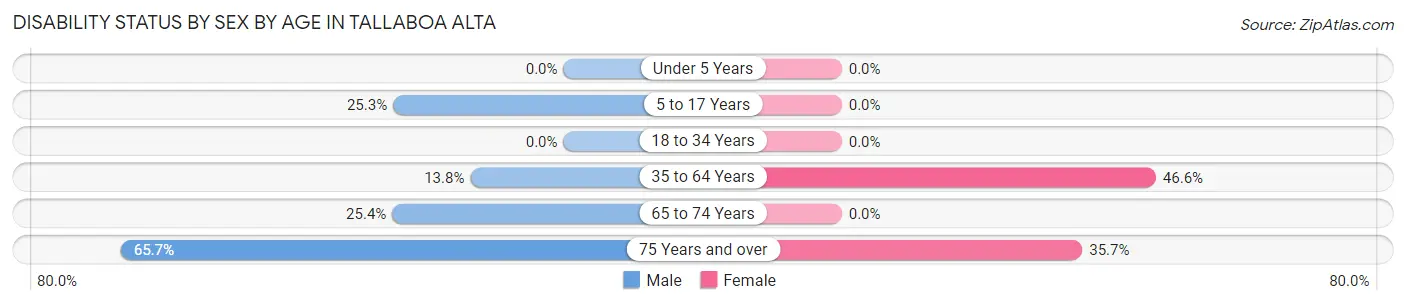
| Age Bracket | Male | Female |
| Under 5 Years | 0 (0.0%) | 0 (0.0%) |
| 5 to 17 Years | 42 (25.3%) | 0 (0.0%) |
| 18 to 34 Years | 0 (0.0%) | 0 (0.0%) |
| 35 to 64 Years | 35 (13.8%) | 111 (46.6%) |
| 65 to 74 Years | 15 (25.4%) | 0 (0.0%) |
| 75 Years and over | 69 (65.7%) | 15 (35.7%) |
Disability Class by Sex by Age in Tallaboa Alta
Disability Class: Hearing Difficulty
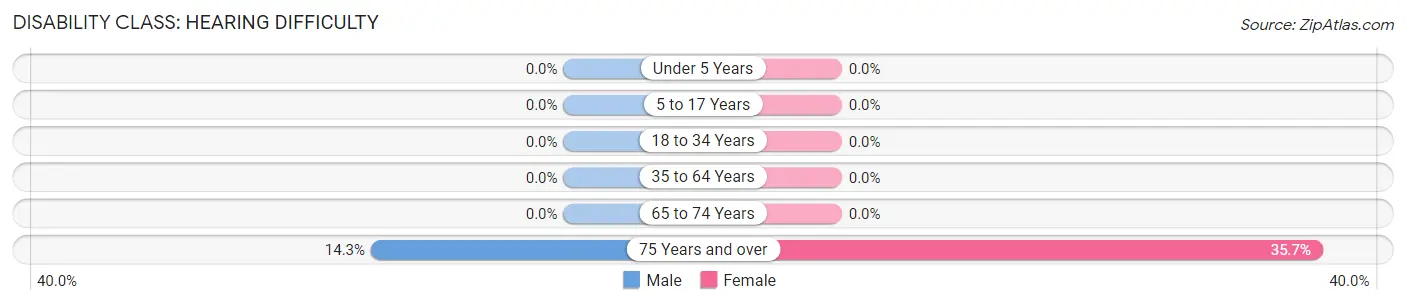
| Age Bracket | Male | Female |
| Under 5 Years | 0 (0.0%) | 0 (0.0%) |
| 5 to 17 Years | 0 (0.0%) | 0 (0.0%) |
| 18 to 34 Years | 0 (0.0%) | 0 (0.0%) |
| 35 to 64 Years | 0 (0.0%) | 0 (0.0%) |
| 65 to 74 Years | 0 (0.0%) | 0 (0.0%) |
| 75 Years and over | 15 (14.3%) | 15 (35.7%) |
Disability Class: Vision Difficulty
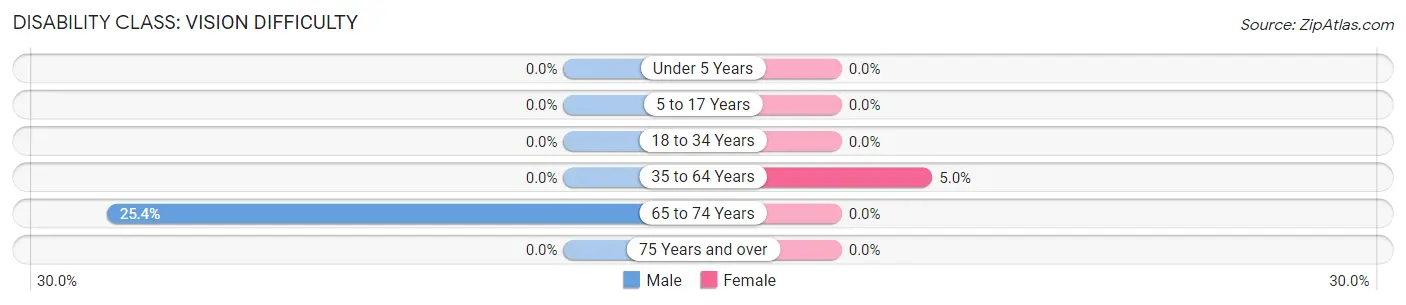
| Age Bracket | Male | Female |
| Under 5 Years | 0 (0.0%) | 0 (0.0%) |
| 5 to 17 Years | 0 (0.0%) | 0 (0.0%) |
| 18 to 34 Years | 0 (0.0%) | 0 (0.0%) |
| 35 to 64 Years | 0 (0.0%) | 12 (5.0%) |
| 65 to 74 Years | 15 (25.4%) | 0 (0.0%) |
| 75 Years and over | 0 (0.0%) | 0 (0.0%) |
Disability Class: Cognitive Difficulty
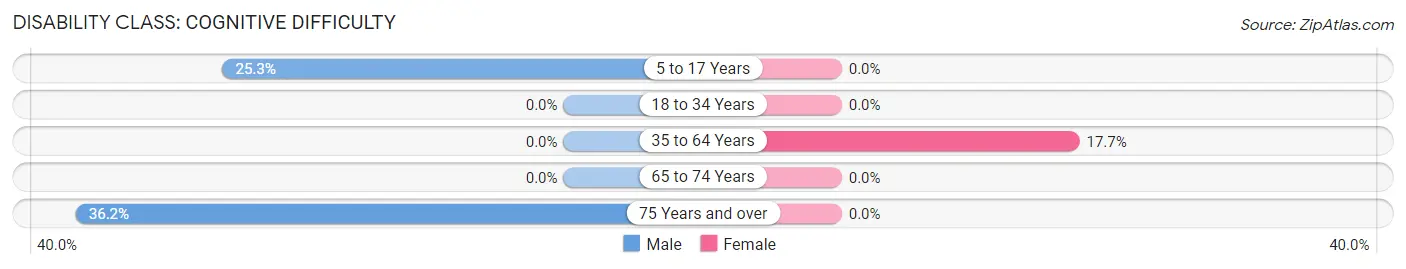
| Age Bracket | Male | Female |
| 5 to 17 Years | 42 (25.3%) | 0 (0.0%) |
| 18 to 34 Years | 0 (0.0%) | 0 (0.0%) |
| 35 to 64 Years | 0 (0.0%) | 42 (17.6%) |
| 65 to 74 Years | 0 (0.0%) | 0 (0.0%) |
| 75 Years and over | 38 (36.2%) | 0 (0.0%) |
Disability Class: Ambulatory Difficulty
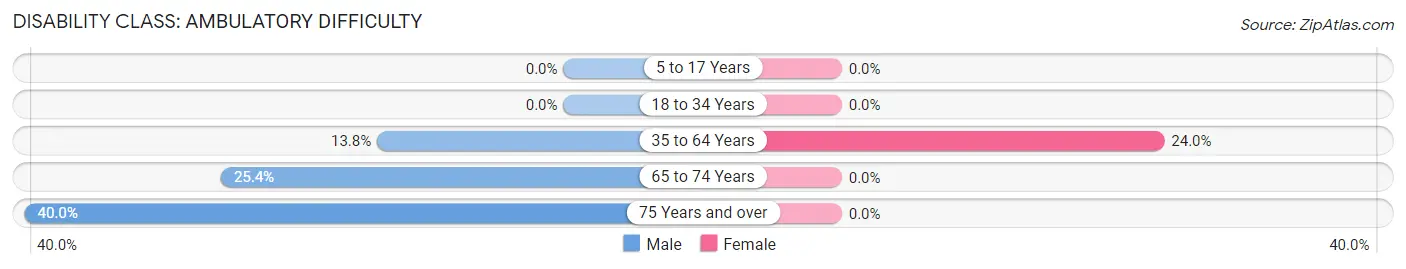
| Age Bracket | Male | Female |
| 5 to 17 Years | 0 (0.0%) | 0 (0.0%) |
| 18 to 34 Years | 0 (0.0%) | 0 (0.0%) |
| 35 to 64 Years | 35 (13.8%) | 57 (23.9%) |
| 65 to 74 Years | 15 (25.4%) | 0 (0.0%) |
| 75 Years and over | 42 (40.0%) | 0 (0.0%) |
Disability Class: Self-Care Difficulty
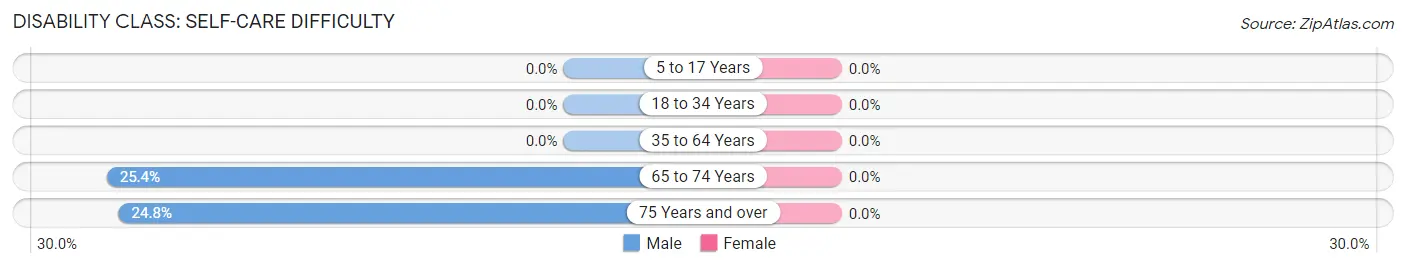
| Age Bracket | Male | Female |
| 5 to 17 Years | 0 (0.0%) | 0 (0.0%) |
| 18 to 34 Years | 0 (0.0%) | 0 (0.0%) |
| 35 to 64 Years | 0 (0.0%) | 0 (0.0%) |
| 65 to 74 Years | 15 (25.4%) | 0 (0.0%) |
| 75 Years and over | 26 (24.8%) | 0 (0.0%) |
Technology Access in Tallaboa Alta
Computing Device Access in Tallaboa Alta
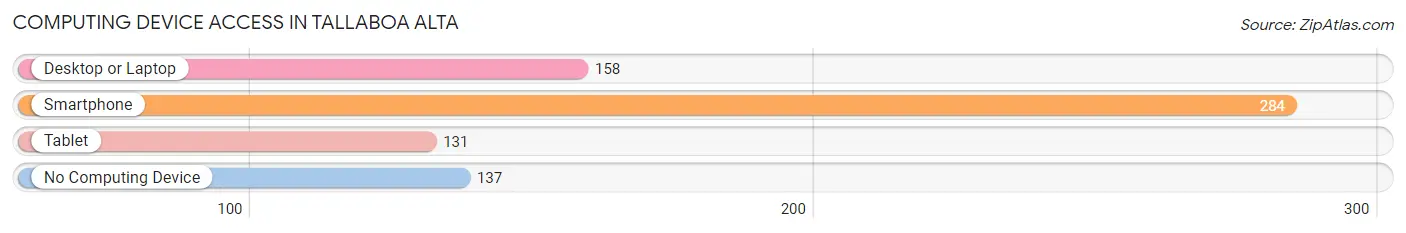
| Device Type | # Households | % Households |
| Desktop or Laptop | 158 | 35.8% |
| Smartphone | 284 | 64.4% |
| Tablet | 131 | 29.7% |
| No Computing Device | 137 | 31.1% |
| Total | 441 | 100.0% |
Internet Access in Tallaboa Alta
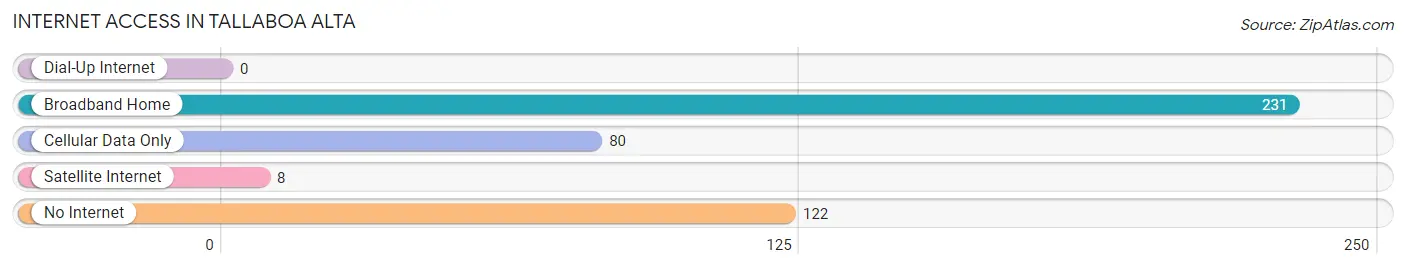
| Internet Type | # Households | % Households |
| Dial-Up Internet | 0 | 0.0% |
| Broadband Home | 231 | 52.4% |
| Cellular Data Only | 80 | 18.1% |
| Satellite Internet | 8 | 1.8% |
| No Internet | 122 | 27.7% |
| Total | 441 | 100.0% |
Tallaboa Alta Summary
Tallaboa Alta is a small municipality located in the central region of Puerto Rico. It is part of the Ponce Metropolitan Statistical Area and is located in the southern part of the island. The municipality has a population of approximately 5,000 people and covers an area of 8.3 square miles.
Geography
Tallaboa Alta is located in the central region of Puerto Rico, in the southern part of the island. It is bordered by the municipalities of Villalba, Coamo, and Juana Diaz. The municipality is located in the Ponce Metropolitan Statistical Area and is part of the Ponce-Yauco-Coamo Combined Statistical Area. The terrain of Tallaboa Alta is mostly flat, with some hills in the northern part of the municipality. The highest point in the municipality is Cerro de la Cruz, which is located in the northern part of the municipality and has an elevation of 1,000 feet.
The climate of Tallaboa Alta is tropical, with temperatures ranging from an average low of 70°F in the winter to an average high of 90°F in the summer. The average annual precipitation is around 50 inches.
Economy
The economy of Tallaboa Alta is largely based on agriculture. The main crops grown in the municipality are coffee, plantains, and bananas. Livestock production is also important, with cattle, pigs, and goats being the main animals raised.
The municipality also has some light industry, including food processing, furniture manufacturing, and metalworking. There are also some small businesses in the municipality, including restaurants, shops, and services.
Demographics
As of the 2010 census, the population of Tallaboa Alta was 5,039. The population is mostly of Puerto Rican descent, with a small minority of African and European descent. The median age of the population is 38.5 years, and the median household income is $17,000.
The majority of the population is Roman Catholic, with a small minority of other religious denominations. Spanish is the primary language spoken in the municipality, although English is also spoken by some of the population.
Conclusion
Tallaboa Alta is a small municipality located in the central region of Puerto Rico. It has a population of approximately 5,000 people and covers an area of 8.3 square miles. The economy of the municipality is largely based on agriculture, with some light industry and small businesses. The population is mostly of Puerto Rican descent, with a small minority of African and European descent. Spanish is the primary language spoken in the municipality, although English is also spoken by some of the population.
Common Questions
What is Per Capita Income in Tallaboa Alta?
Per Capita income in Tallaboa Alta is $8,238.
What is the Median Family Income in Tallaboa Alta?
Median Family Income in Tallaboa Alta is $13,598.
What is the Median Household income in Tallaboa Alta?
Median Household Income in Tallaboa Alta is $12,715.
What is Inequality or Gini Index in Tallaboa Alta?
Inequality or Gini Index in Tallaboa Alta is 0.54.
What is the Total Population of Tallaboa Alta?
Total Population of Tallaboa Alta is 1,354.
What is the Total Male Population of Tallaboa Alta?
Total Male Population of Tallaboa Alta is 735.
What is the Total Female Population of Tallaboa Alta?
Total Female Population of Tallaboa Alta is 619.
What is the Ratio of Males per 100 Females in Tallaboa Alta?
There are 118.74 Males per 100 Females in Tallaboa Alta.
What is the Ratio of Females per 100 Males in Tallaboa Alta?
There are 84.22 Females per 100 Males in Tallaboa Alta.
What is the Median Population Age in Tallaboa Alta?
Median Population Age in Tallaboa Alta is 40.6 Years.
What is the Average Family Size in Tallaboa Alta
Average Family Size in Tallaboa Alta is 3.6 People.
What is the Average Household Size in Tallaboa Alta
Average Household Size in Tallaboa Alta is 3.1 People.
How Large is the Labor Force in Tallaboa Alta?
There are 407 People in the Labor Forcein in Tallaboa Alta.
What is the Percentage of People in the Labor Force in Tallaboa Alta?
37.0% of People are in the Labor Force in Tallaboa Alta.
What is the Unemployment Rate in Tallaboa Alta?
Unemployment Rate in Tallaboa Alta is 14.0%.