Hatillo, PR Map & Demographics
Hatillo Map
Hatillo Overview
$11,171
PER CAPITA INCOME
$24,044
AVG FAMILY INCOME
$20,000
AVG HOUSEHOLD INCOME
3.6%
WAGE / INCOME GAP [ % ]
96.4¢/ $1
WAGE / INCOME GAP [ $ ]
$9,634
FAMILY INCOME DEFICIT
0.45
INEQUALITY / GINI INDEX
4,049
TOTAL POPULATION
1,630
MALE POPULATION
2,419
FEMALE POPULATION
67.38
MALES / 100 FEMALES
148.40
FEMALES / 100 MALES
46.8
MEDIAN AGE
3.5
AVG FAMILY SIZE
2.6
AVG HOUSEHOLD SIZE
1,548
LABOR FORCE [ PEOPLE ]
43.0%
PERCENT IN LABOR FORCE
17.0%
UNEMPLOYMENT RATE
Hatillo Zip Codes
Income in Hatillo
Income Overview in Hatillo
Per Capita Income in Hatillo is $11,171, while median incomes of families and households are $24,044 and $20,000 respectively.
| Characteristic | Number | Measure |
| Per Capita Income | 4,049 | $11,171 |
| Median Family Income | 963 | $24,044 |
| Mean Family Income | 963 | $29,813 |
| Median Household Income | 1,560 | $20,000 |
| Mean Household Income | 1,560 | $24,548 |
| Income Deficit | 963 | $9,634 |
| Wage / Income Gap (%) | 4,049 | 3.60% |
| Wage / Income Gap ($) | 4,049 | 96.40¢ per $1 |
| Gini / Inequality Index | 4,049 | 0.45 |
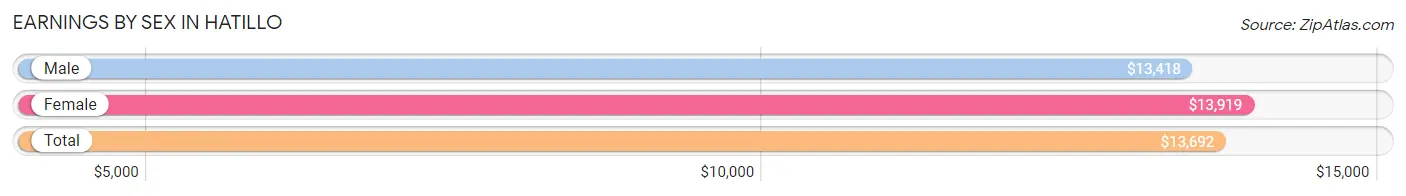
Earnings by Sex in Hatillo
Average Earnings in Hatillo are $13,692, $13,418 for men and $13,919 for women, a difference of 3.6%.
| Sex | Number | Average Earnings |
| Male | 658 (48.6%) | $13,418 |
| Female | 695 (51.4%) | $13,919 |
| Total | 1,353 (100.0%) | $13,692 |
Earnings by Sex by Income Bracket in Hatillo
The most common earnings brackets in Hatillo are $15,000 to $17,499 for men (110 | 16.7%) and $2,500 to $4,999 for women (157 | 22.6%).

| Income | Male | Female |
| $2,499 or less | 70 (10.6%) | 52 (7.5%) |
| $2,500 to $4,999 | 58 (8.8%) | 157 (22.6%) |
| $5,000 to $7,499 | 74 (11.3%) | 53 (7.6%) |
| $7,500 to $9,999 | 61 (9.3%) | 38 (5.5%) |
| $10,000 to $12,499 | 48 (7.3%) | 14 (2.0%) |
| $12,500 to $14,999 | 49 (7.4%) | 59 (8.5%) |
| $15,000 to $17,499 | 110 (16.7%) | 51 (7.3%) |
| $17,500 to $19,999 | 25 (3.8%) | 29 (4.2%) |
| $20,000 to $22,499 | 32 (4.9%) | 42 (6.0%) |
| $22,500 to $24,999 | 15 (2.3%) | 44 (6.3%) |
| $25,000 to $29,999 | 31 (4.7%) | 90 (13.0%) |
| $30,000 to $34,999 | 69 (10.5%) | 0 (0.0%) |
| $35,000 to $39,999 | 0 (0.0%) | 33 (4.8%) |
| $40,000 to $44,999 | 0 (0.0%) | 0 (0.0%) |
| $45,000 to $49,999 | 0 (0.0%) | 21 (3.0%) |
| $50,000 to $54,999 | 8 (1.2%) | 0 (0.0%) |
| $55,000 to $64,999 | 8 (1.2%) | 12 (1.7%) |
| $65,000 to $74,999 | 0 (0.0%) | 0 (0.0%) |
| $75,000 to $99,999 | 0 (0.0%) | 0 (0.0%) |
| $100,000+ | 0 (0.0%) | 0 (0.0%) |
| Total | 658 (100.0%) | 695 (100.0%) |
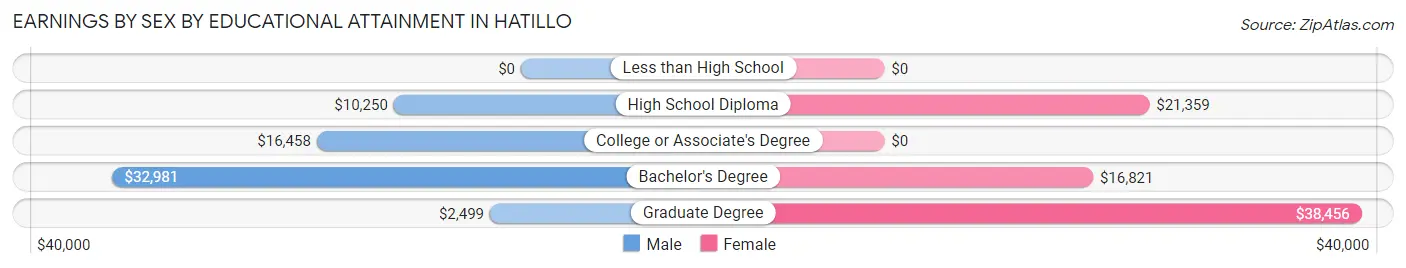
Earnings by Sex by Educational Attainment in Hatillo
Average earnings in Hatillo are $14,592 for men and $15,956 for women, a difference of 8.6%. Men with an educational attainment of bachelor's degree enjoy the highest average annual earnings of $32,981, while those with graduate degree education earn the least with $2,499. Women with an educational attainment of graduate degree earn the most with the average annual earnings of $38,456, while those with bachelor's degree education have the smallest earnings of $16,821.
| Educational Attainment | Male Income | Female Income |
| Less than High School | - | - |
| High School Diploma | $10,250 | $21,359 |
| College or Associate's Degree | $16,458 | $0 |
| Bachelor's Degree | $32,981 | $16,821 |
| Graduate Degree | $2,499 | $38,456 |
| Total | $14,592 | $15,956 |
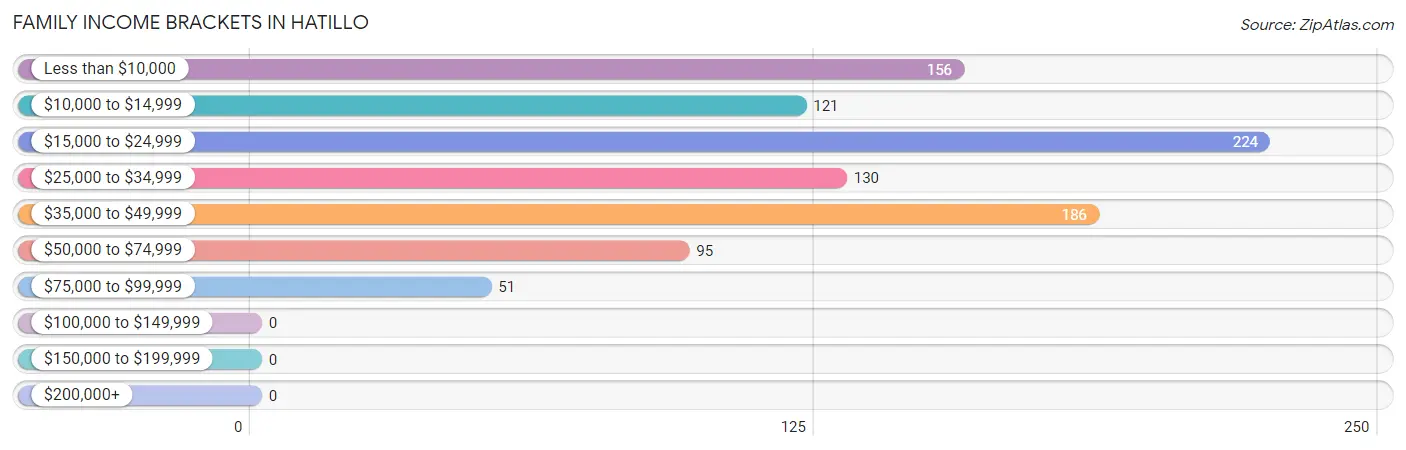
Family Income in Hatillo
Family Income Brackets in Hatillo
According to the Hatillo family income data, there are 224 families falling into the $15,000 to $24,999 income range, which is the most common income bracket and makes up 23.3% of all families.
| Income Bracket | # Families | % Families |
| Less than $10,000 | 156 | 16.2% |
| $10,000 to $14,999 | 121 | 12.6% |
| $15,000 to $24,999 | 224 | 23.3% |
| $25,000 to $34,999 | 130 | 13.5% |
| $35,000 to $49,999 | 186 | 19.3% |
| $50,000 to $74,999 | 95 | 9.9% |
| $75,000 to $99,999 | 51 | 5.3% |
| $100,000 to $149,999 | 0 | 0.0% |
| $150,000 to $199,999 | 0 | 0.0% |
| $200,000+ | 0 | 0.0% |
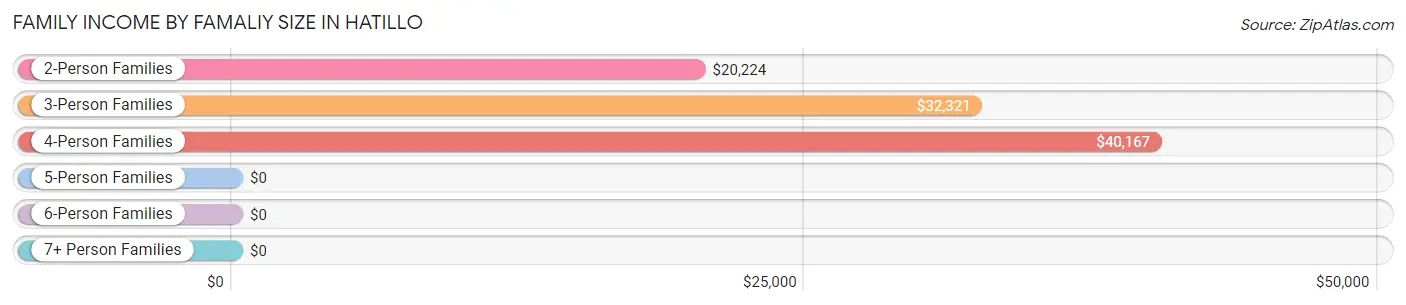
Family Income by Famaliy Size in Hatillo
4-person families (98 | 10.2%) account for the highest median family income in Hatillo with $40,167 per family, while 3-person families (247 | 25.7%) have the highest median income of $10,774 per family member.
| Income Bracket | # Families | Median Income |
| 2-Person Families | 526 (54.6%) | $20,224 |
| 3-Person Families | 247 (25.7%) | $32,321 |
| 4-Person Families | 98 (10.2%) | $40,167 |
| 5-Person Families | 61 (6.3%) | $0 |
| 6-Person Families | 31 (3.2%) | $0 |
| 7+ Person Families | 0 (0.0%) | $0 |
| Total | 963 (100.0%) | $24,044 |
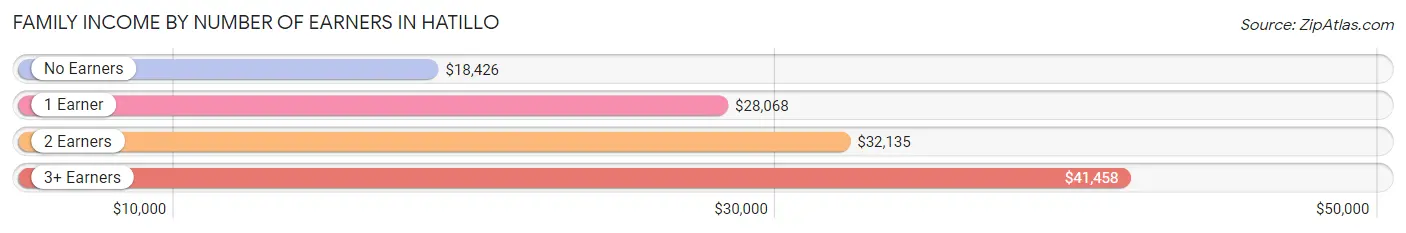
Family Income by Number of Earners in Hatillo
The median family income in Hatillo is $24,044, with families comprising 3+ earners (47) having the highest median family income of $41,458, while families with no earners (322) have the lowest median family income of $18,426, accounting for 4.9% and 33.4% of families, respectively.
| Number of Earners | # Families | Median Income |
| No Earners | 322 (33.4%) | $18,426 |
| 1 Earner | 377 (39.2%) | $28,068 |
| 2 Earners | 217 (22.5%) | $32,135 |
| 3+ Earners | 47 (4.9%) | $41,458 |
| Total | 963 (100.0%) | $24,044 |
Household Income in Hatillo
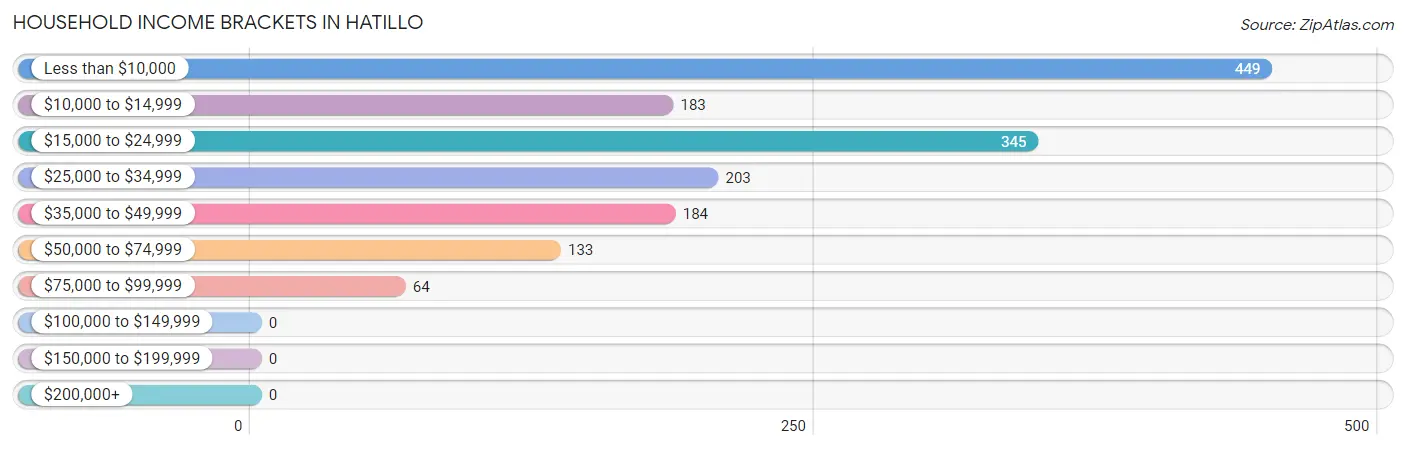
Household Income Brackets in Hatillo
With 449 households falling in the category, the less than $10,000 income range is the most frequent in Hatillo, accounting for 28.8% of all households.
| Income Bracket | # Households | % Households |
| Less than $10,000 | 449 | 28.8% |
| $10,000 to $14,999 | 183 | 11.7% |
| $15,000 to $24,999 | 345 | 22.1% |
| $25,000 to $34,999 | 203 | 13.0% |
| $35,000 to $49,999 | 184 | 11.8% |
| $50,000 to $74,999 | 133 | 8.5% |
| $75,000 to $99,999 | 64 | 4.1% |
| $100,000 to $149,999 | 0 | 0.0% |
| $150,000 to $199,999 | 0 | 0.0% |
| $200,000+ | 0 | 0.0% |
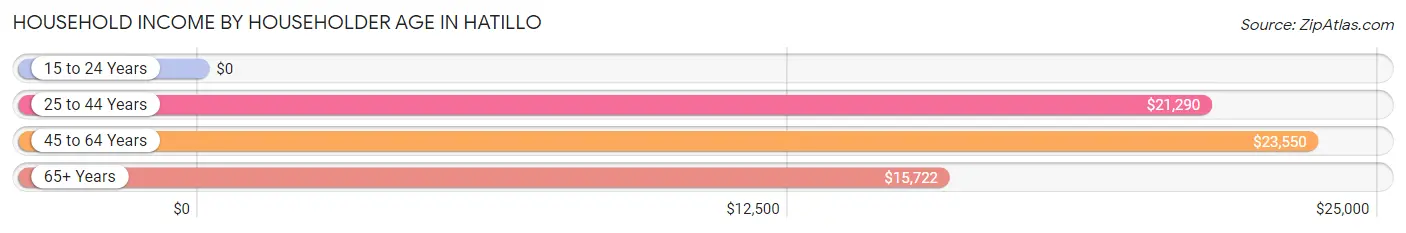
Household Income by Householder Age in Hatillo
The median household income in Hatillo is $20,000, with the highest median household income of $23,550 found in the 45 to 64 years age bracket for the primary householder. A total of 573 households (36.7%) fall into this category. Meanwhile, the 15 to 24 years age bracket for the primary householder has the lowest median household income of $0, with 23 households (1.5%) in this group.
| Income Bracket | # Households | Median Income |
| 15 to 24 Years | 23 (1.5%) | $0 |
| 25 to 44 Years | 248 (15.9%) | $21,290 |
| 45 to 64 Years | 573 (36.7%) | $23,550 |
| 65+ Years | 716 (45.9%) | $15,722 |
| Total | 1,560 (100.0%) | $20,000 |
Poverty in Hatillo
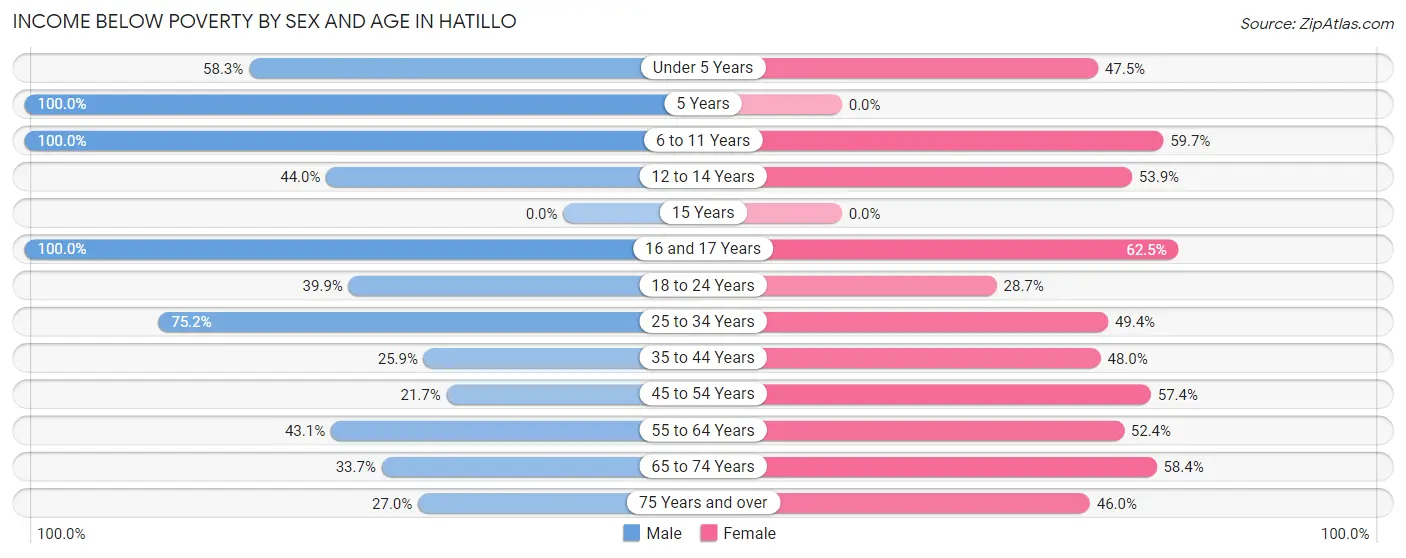
Income Below Poverty by Sex and Age in Hatillo
With 48.2% poverty level for males and 50.6% for females among the residents of Hatillo, 5 year old males and 16 and 17 year old females are the most vulnerable to poverty, with 52 males (100.0%) and 15 females (62.5%) in their respective age groups living below the poverty level.
| Age Bracket | Male | Female |
| Under 5 Years | 28 (58.3%) | 29 (47.5%) |
| 5 Years | 52 (100.0%) | 0 (0.0%) |
| 6 to 11 Years | 79 (100.0%) | 71 (59.7%) |
| 12 to 14 Years | 22 (44.0%) | 21 (53.8%) |
| 15 Years | 0 (0.0%) | 0 (0.0%) |
| 16 and 17 Years | 21 (100.0%) | 15 (62.5%) |
| 18 to 24 Years | 53 (39.9%) | 50 (28.7%) |
| 25 to 34 Years | 206 (75.2%) | 206 (49.4%) |
| 35 to 44 Years | 43 (25.9%) | 122 (48.0%) |
| 45 to 54 Years | 31 (21.7%) | 152 (57.4%) |
| 55 to 64 Years | 160 (43.1%) | 222 (52.4%) |
| 65 to 74 Years | 60 (33.7%) | 191 (58.4%) |
| 75 Years and over | 31 (27.0%) | 145 (46.0%) |
| Total | 786 (48.2%) | 1,224 (50.6%) |
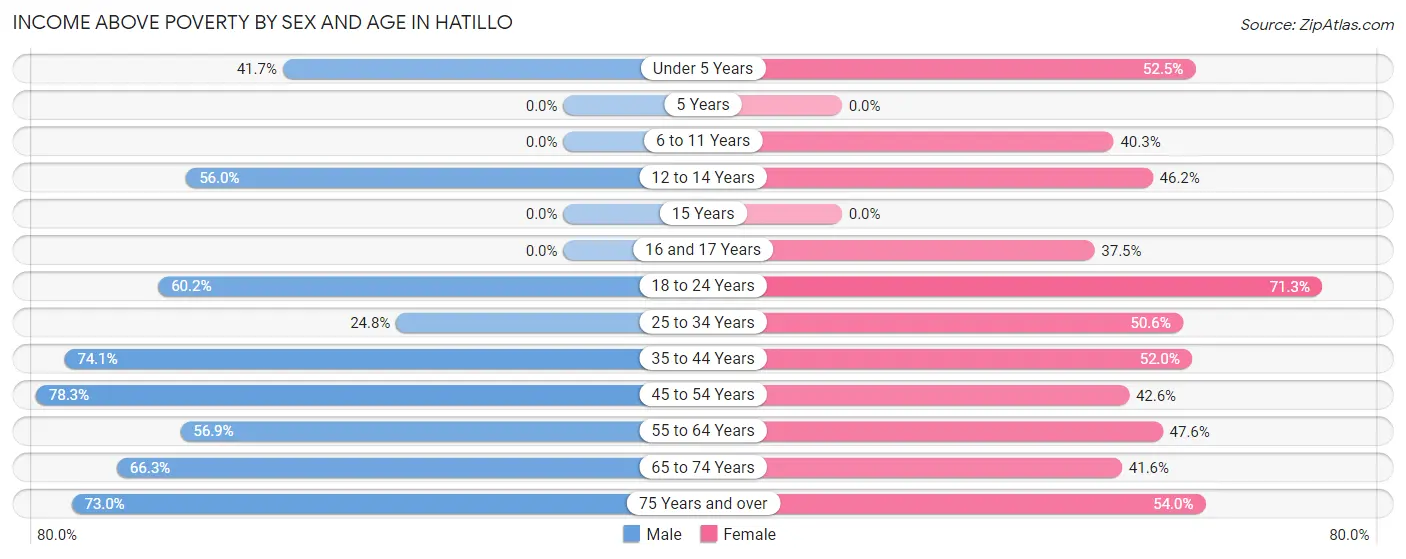
Income Above Poverty by Sex and Age in Hatillo
According to the poverty statistics in Hatillo, males aged 45 to 54 years and females aged 18 to 24 years are the age groups that are most secure financially, with 78.3% of males and 71.3% of females in these age groups living above the poverty line.
| Age Bracket | Male | Female |
| Under 5 Years | 20 (41.7%) | 32 (52.5%) |
| 5 Years | 0 (0.0%) | 0 (0.0%) |
| 6 to 11 Years | 0 (0.0%) | 48 (40.3%) |
| 12 to 14 Years | 28 (56.0%) | 18 (46.2%) |
| 15 Years | 0 (0.0%) | 0 (0.0%) |
| 16 and 17 Years | 0 (0.0%) | 9 (37.5%) |
| 18 to 24 Years | 80 (60.2%) | 124 (71.3%) |
| 25 to 34 Years | 68 (24.8%) | 211 (50.6%) |
| 35 to 44 Years | 123 (74.1%) | 132 (52.0%) |
| 45 to 54 Years | 112 (78.3%) | 113 (42.6%) |
| 55 to 64 Years | 211 (56.9%) | 202 (47.6%) |
| 65 to 74 Years | 118 (66.3%) | 136 (41.6%) |
| 75 Years and over | 84 (73.0%) | 170 (54.0%) |
| Total | 844 (51.8%) | 1,195 (49.4%) |
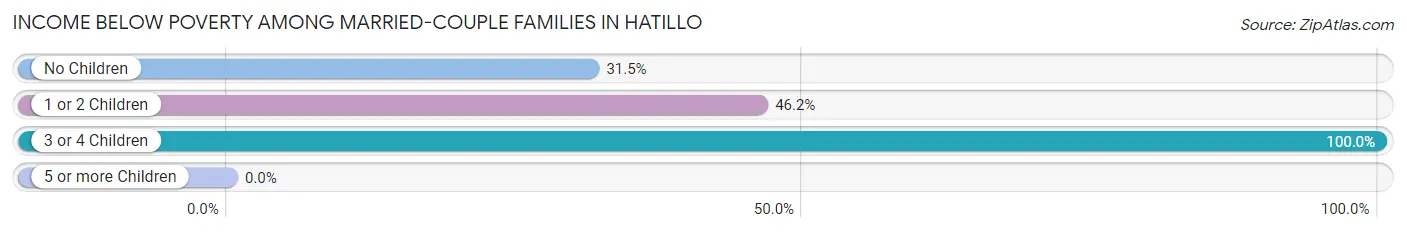
Income Below Poverty Among Married-Couple Families in Hatillo
The poverty statistics for married-couple families in Hatillo show that 37.8% or 176 of the total 466 families live below the poverty line. Families with 3 or 4 children have the highest poverty rate of 100.0%, comprising of 15 families. On the other hand, families with no children have the lowest poverty rate of 31.5%, which includes 101 families.
| Children | Above Poverty | Below Poverty |
| No Children | 220 (68.5%) | 101 (31.5%) |
| 1 or 2 Children | 70 (53.8%) | 60 (46.2%) |
| 3 or 4 Children | 0 (0.0%) | 15 (100.0%) |
| 5 or more Children | 0 (0.0%) | 0 (0.0%) |
| Total | 290 (62.2%) | 176 (37.8%) |
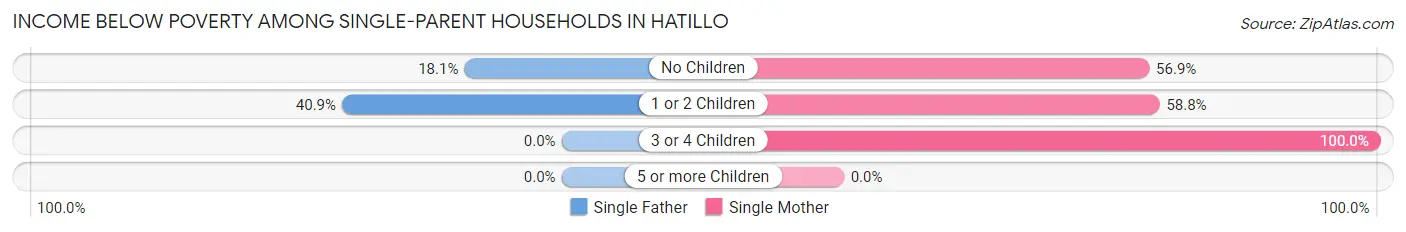
Income Below Poverty Among Single-Parent Households in Hatillo
According to the poverty data in Hatillo, 21.5% or 32 single-father households and 59.2% or 206 single-mother households are living below the poverty line. Among single-father households, those with 1 or 2 children have the highest poverty rate, with 9 households (40.9%) experiencing poverty. Likewise, among single-mother households, those with 3 or 4 children have the highest poverty rate, with 14 households (100.0%) falling below the poverty line.
| Children | Single Father | Single Mother |
| No Children | 23 (18.1%) | 132 (56.9%) |
| 1 or 2 Children | 9 (40.9%) | 60 (58.8%) |
| 3 or 4 Children | 0 (0.0%) | 14 (100.0%) |
| 5 or more Children | 0 (0.0%) | 0 (0.0%) |
| Total | 32 (21.5%) | 206 (59.2%) |
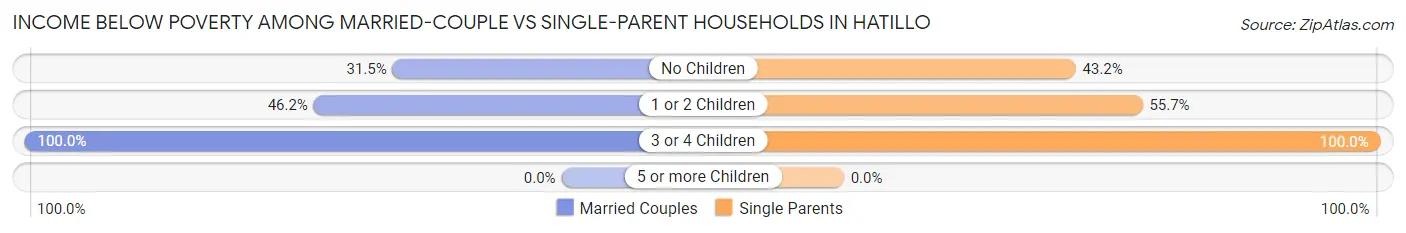
Income Below Poverty Among Married-Couple vs Single-Parent Households in Hatillo
The poverty data for Hatillo shows that 176 of the married-couple family households (37.8%) and 238 of the single-parent households (47.9%) are living below the poverty level. Within the married-couple family households, those with 3 or 4 children have the highest poverty rate, with 15 households (100.0%) falling below the poverty line. Among the single-parent households, those with 3 or 4 children have the highest poverty rate, with 14 household (100.0%) living below poverty.
| Children | Married-Couple Families | Single-Parent Households |
| No Children | 101 (31.5%) | 155 (43.2%) |
| 1 or 2 Children | 60 (46.2%) | 69 (55.6%) |
| 3 or 4 Children | 15 (100.0%) | 14 (100.0%) |
| 5 or more Children | 0 (0.0%) | 0 (0.0%) |
| Total | 176 (37.8%) | 238 (47.9%) |
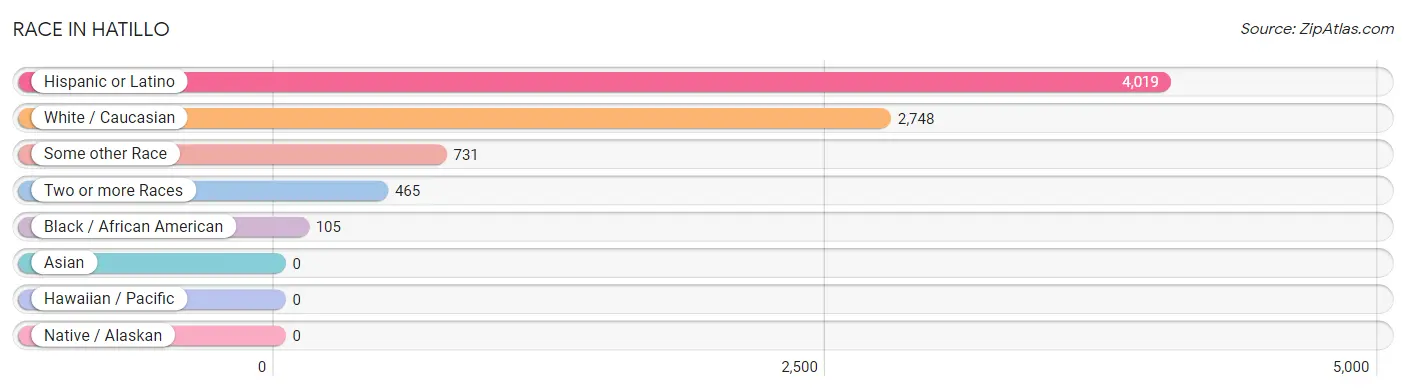
Race in Hatillo
The most populous races in Hatillo are Hispanic or Latino (4,019 | 99.3%), White / Caucasian (2,748 | 67.9%), and Some other Race (731 | 18.0%).
| Race | # Population | % Population |
| Asian | 0 | 0.0% |
| Black / African American | 105 | 2.6% |
| Hawaiian / Pacific | 0 | 0.0% |
| Hispanic or Latino | 4,019 | 99.3% |
| Native / Alaskan | 0 | 0.0% |
| White / Caucasian | 2,748 | 67.9% |
| Two or more Races | 465 | 11.5% |
| Some other Race | 731 | 18.0% |
| Total | 4,049 | 100.0% |
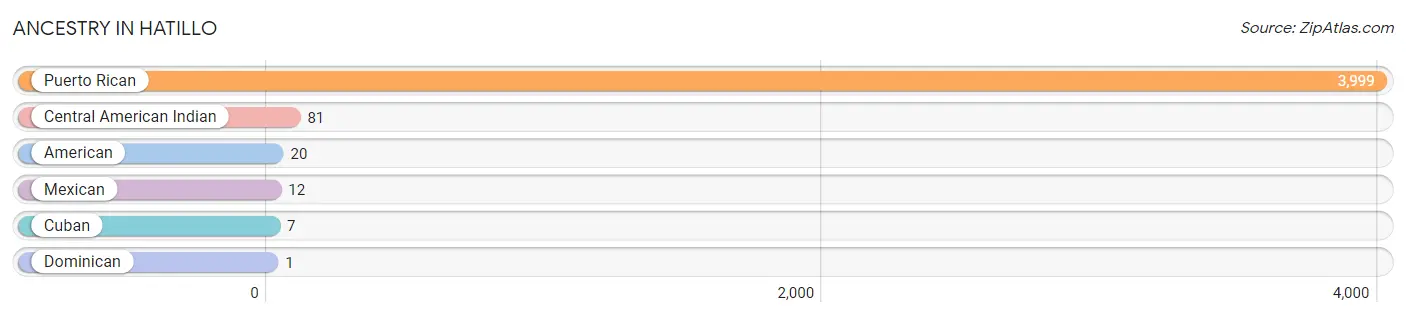
Ancestry in Hatillo
The most populous ancestries reported in Hatillo are Puerto Rican (3,999 | 98.8%), Central American Indian (81 | 2.0%), American (20 | 0.5%), Mexican (12 | 0.3%), and Cuban (7 | 0.2%), together accounting for 101.7% of all Hatillo residents.
| Ancestry | # Population | % Population |
| American | 20 | 0.5% |
| Central American Indian | 81 | 2.0% |
| Cuban | 7 | 0.2% |
| Dominican | 1 | 0.0% |
| Mexican | 12 | 0.3% |
| Puerto Rican | 3,999 | 98.8% | View All 6 Rows |
Immigrants in Hatillo

| Immigration Origin | # Population | % Population | View All 0 Rows |
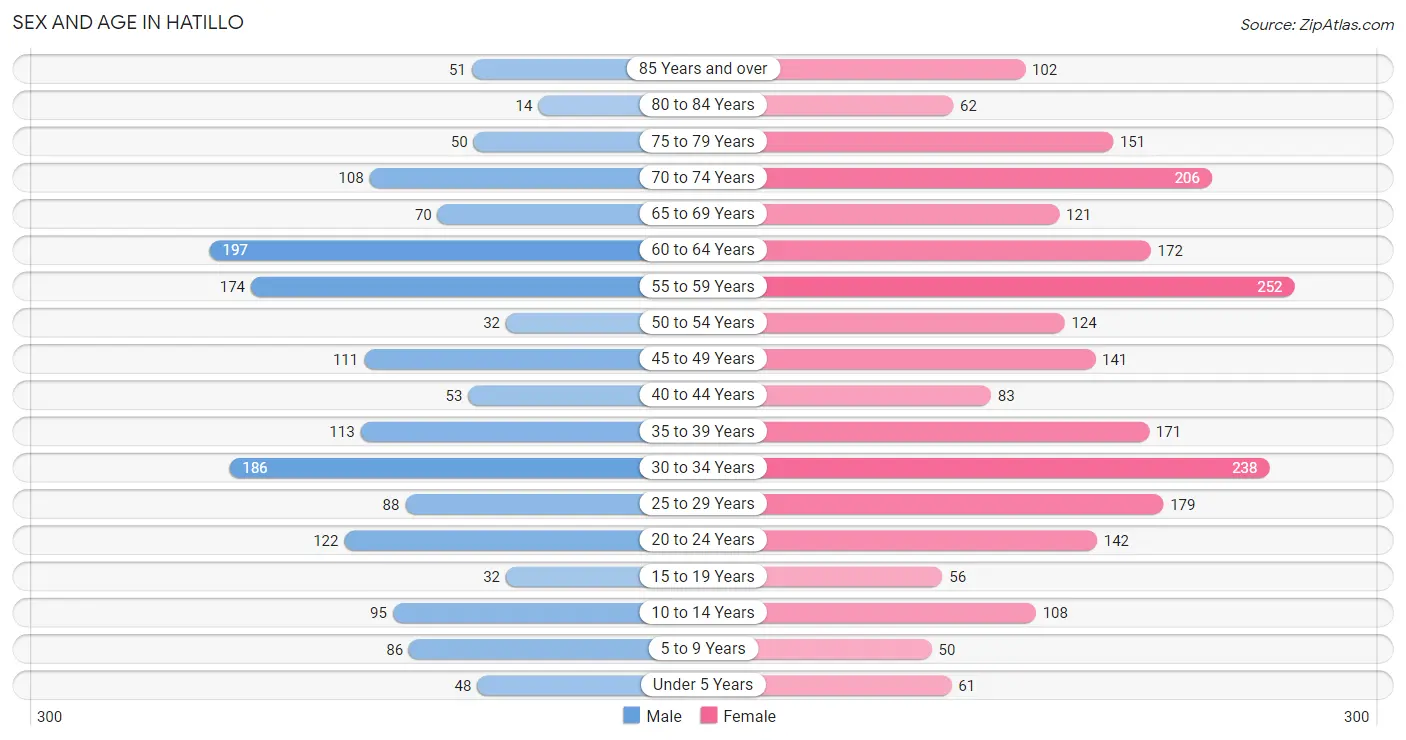
Sex and Age in Hatillo
Sex and Age in Hatillo
The most populous age groups in Hatillo are 60 to 64 Years (197 | 12.1%) for men and 55 to 59 Years (252 | 10.4%) for women.
| Age Bracket | Male | Female |
| Under 5 Years | 48 (2.9%) | 61 (2.5%) |
| 5 to 9 Years | 86 (5.3%) | 50 (2.1%) |
| 10 to 14 Years | 95 (5.8%) | 108 (4.5%) |
| 15 to 19 Years | 32 (2.0%) | 56 (2.3%) |
| 20 to 24 Years | 122 (7.5%) | 142 (5.9%) |
| 25 to 29 Years | 88 (5.4%) | 179 (7.4%) |
| 30 to 34 Years | 186 (11.4%) | 238 (9.8%) |
| 35 to 39 Years | 113 (6.9%) | 171 (7.1%) |
| 40 to 44 Years | 53 (3.3%) | 83 (3.4%) |
| 45 to 49 Years | 111 (6.8%) | 141 (5.8%) |
| 50 to 54 Years | 32 (2.0%) | 124 (5.1%) |
| 55 to 59 Years | 174 (10.7%) | 252 (10.4%) |
| 60 to 64 Years | 197 (12.1%) | 172 (7.1%) |
| 65 to 69 Years | 70 (4.3%) | 121 (5.0%) |
| 70 to 74 Years | 108 (6.6%) | 206 (8.5%) |
| 75 to 79 Years | 50 (3.1%) | 151 (6.2%) |
| 80 to 84 Years | 14 (0.9%) | 62 (2.6%) |
| 85 Years and over | 51 (3.1%) | 102 (4.2%) |
| Total | 1,630 (100.0%) | 2,419 (100.0%) |
Families and Households in Hatillo
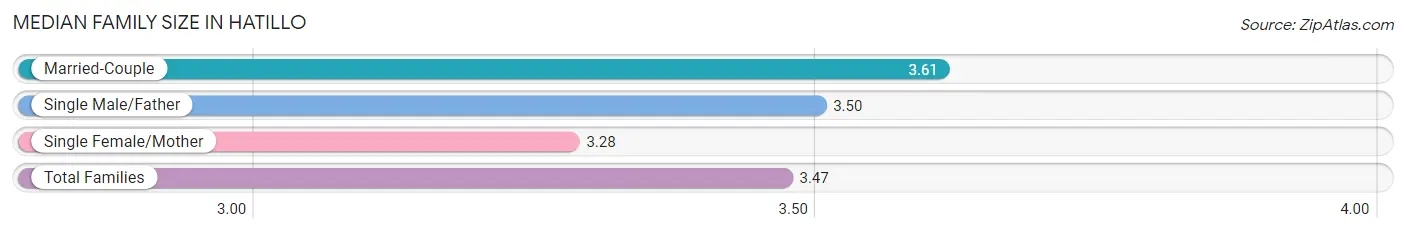
Median Family Size in Hatillo
The median family size in Hatillo is 3.47 persons per family, with married-couple families (466 | 48.4%) accounting for the largest median family size of 3.61 persons per family. On the other hand, single female/mother families (348 | 36.1%) represent the smallest median family size with 3.28 persons per family.
| Family Type | # Families | Family Size |
| Married-Couple | 466 (48.4%) | 3.61 |
| Single Male/Father | 149 (15.5%) | 3.50 |
| Single Female/Mother | 348 (36.1%) | 3.28 |
| Total Families | 963 (100.0%) | 3.47 |
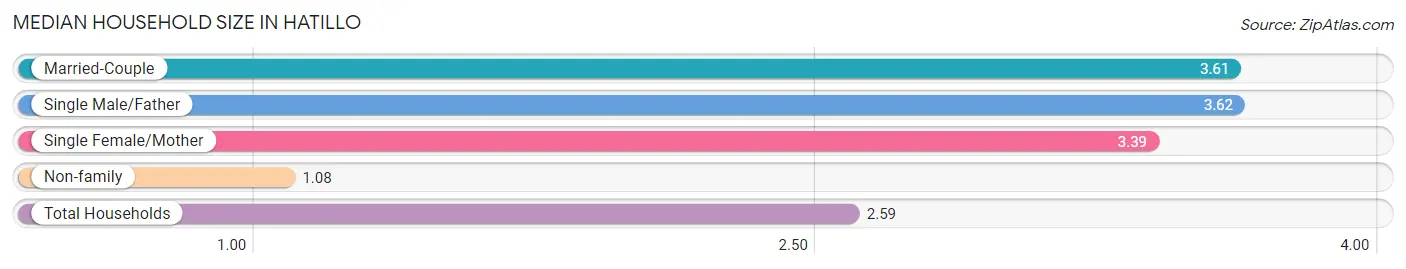
Median Household Size in Hatillo
The median household size in Hatillo is 2.59 persons per household, with single male/father households (149 | 9.6%) accounting for the largest median household size of 3.62 persons per household. non-family households (597 | 38.3%) represent the smallest median household size with 1.08 persons per household.
| Household Type | # Households | Household Size |
| Married-Couple | 466 (29.9%) | 3.61 |
| Single Male/Father | 149 (9.6%) | 3.62 |
| Single Female/Mother | 348 (22.3%) | 3.39 |
| Non-family | 597 (38.3%) | 1.08 |
| Total Households | 1,560 (100.0%) | 2.59 |
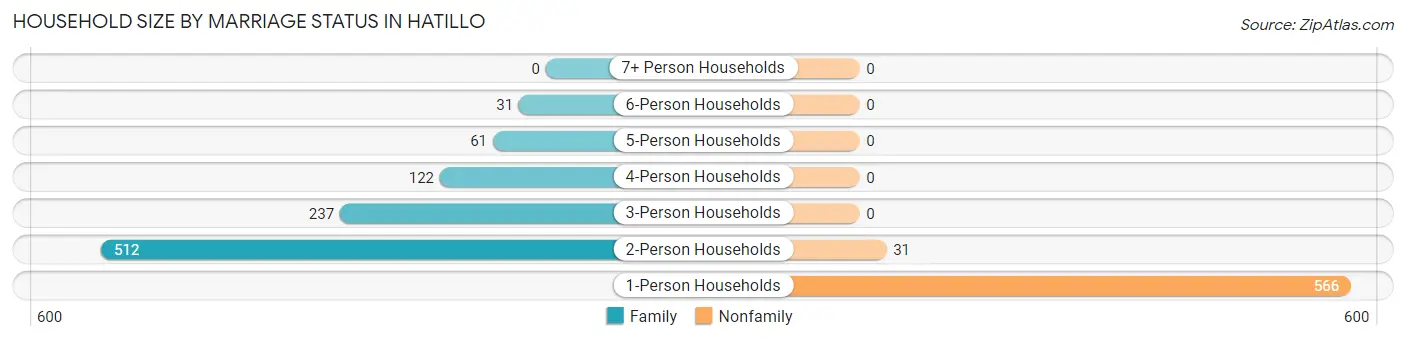
Household Size by Marriage Status in Hatillo
Out of a total of 1,560 households in Hatillo, 963 (61.7%) are family households, while 597 (38.3%) are nonfamily households. The most numerous type of family households are 2-person households, comprising 512, and the most common type of nonfamily households are 1-person households, comprising 566.
| Household Size | Family Households | Nonfamily Households |
| 1-Person Households | - | 566 (36.3%) |
| 2-Person Households | 512 (32.8%) | 31 (2.0%) |
| 3-Person Households | 237 (15.2%) | 0 (0.0%) |
| 4-Person Households | 122 (7.8%) | 0 (0.0%) |
| 5-Person Households | 61 (3.9%) | 0 (0.0%) |
| 6-Person Households | 31 (2.0%) | 0 (0.0%) |
| 7+ Person Households | 0 (0.0%) | 0 (0.0%) |
| Total | 963 (61.7%) | 597 (38.3%) |
Female Fertility in Hatillo
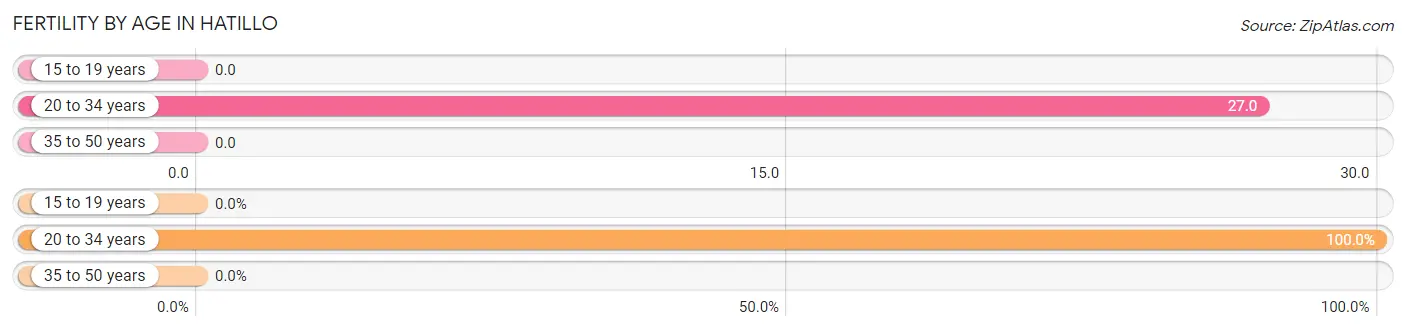
Fertility by Age in Hatillo
Average fertility rate in Hatillo is 15.0 births per 1,000 women. Women in the age bracket of 20 to 34 years have the highest fertility rate with 27.0 births per 1,000 women. Women in the age bracket of 20 to 34 years acount for 100.0% of all women with births.
| Age Bracket | Women with Births | Births / 1,000 Women |
| 15 to 19 years | 0 (0.0%) | 0.0 |
| 20 to 34 years | 15 (100.0%) | 27.0 |
| 35 to 50 years | 0 (0.0%) | 0.0 |
| Total | 15 (100.0%) | 15.0 |
Fertility by Age by Marriage Status in Hatillo
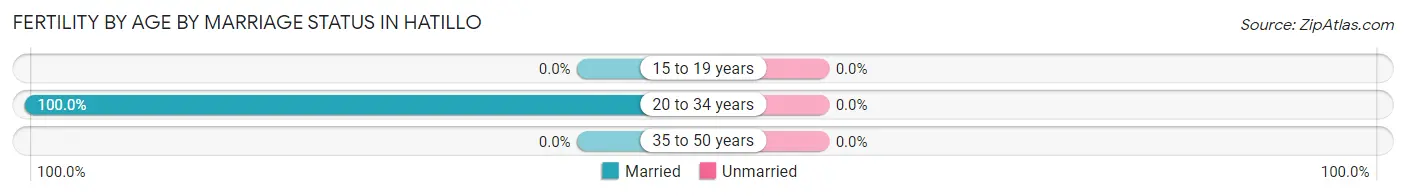
| Age Bracket | Married | Unmarried |
| 15 to 19 years | 0 (0.0%) | 0 (0.0%) |
| 20 to 34 years | 15 (100.0%) | 0 (0.0%) |
| 35 to 50 years | 0 (0.0%) | 0 (0.0%) |
| Total | 15 (100.0%) | 0 (0.0%) |
Fertility by Education in Hatillo
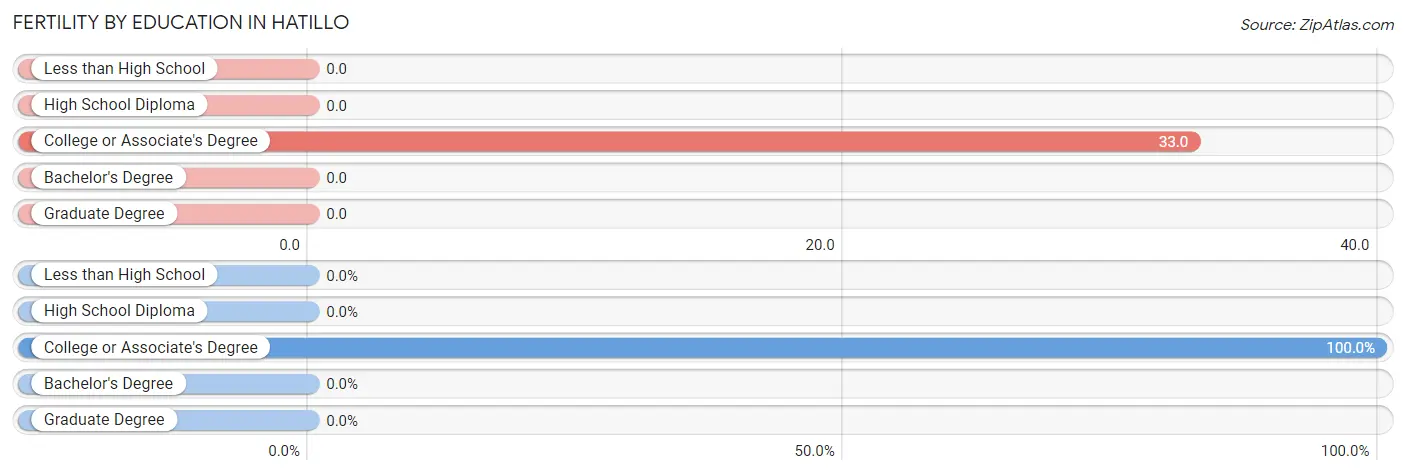
| Educational Attainment | Women with Births | Births / 1,000 Women |
| Less than High School | 0 (0.0%) | 0.0 |
| High School Diploma | 0 (0.0%) | 0.0 |
| College or Associate's Degree | 15 (100.0%) | 33.0 |
| Bachelor's Degree | 0 (0.0%) | 0.0 |
| Graduate Degree | 0 (0.0%) | 0.0 |
| Total | 15 (100.0%) | 15.0 |
Fertility by Education by Marriage Status in Hatillo
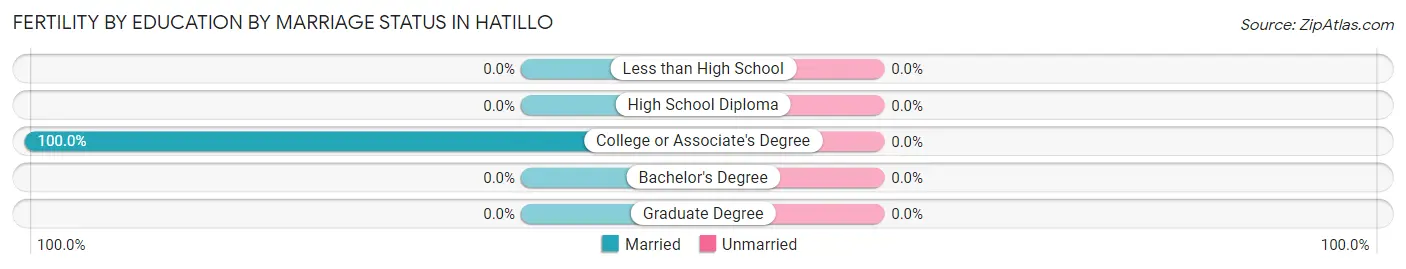
| Educational Attainment | Married | Unmarried |
| Less than High School | 0 (0.0%) | 0 (0.0%) |
| High School Diploma | 0 (0.0%) | 0 (0.0%) |
| College or Associate's Degree | 15 (100.0%) | 0 (0.0%) |
| Bachelor's Degree | 0 (0.0%) | 0 (0.0%) |
| Graduate Degree | 0 (0.0%) | 0 (0.0%) |
| Total | 15 (100.0%) | 0 (0.0%) |
Employment Characteristics in Hatillo
Employment by Class of Employer in Hatillo
Among the 1,284 employed individuals in Hatillo, private company employees (790 | 61.5%), local government employees (180 | 14.0%), and state government employees (139 | 10.8%) make up the most common classes of employment.
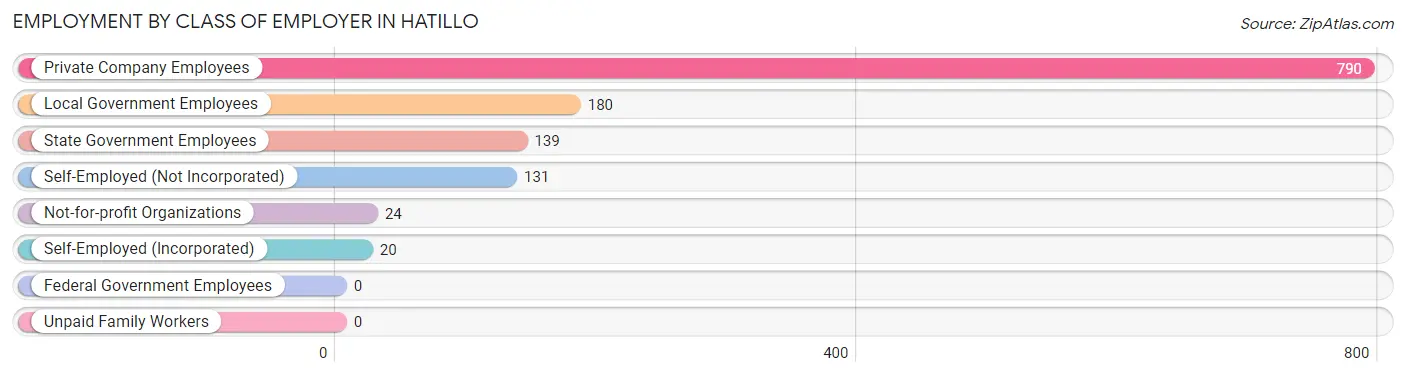
| Employer Class | # Employees | % Employees |
| Private Company Employees | 790 | 61.5% |
| Self-Employed (Incorporated) | 20 | 1.6% |
| Self-Employed (Not Incorporated) | 131 | 10.2% |
| Not-for-profit Organizations | 24 | 1.9% |
| Local Government Employees | 180 | 14.0% |
| State Government Employees | 139 | 10.8% |
| Federal Government Employees | 0 | 0.0% |
| Unpaid Family Workers | 0 | 0.0% |
| Total | 1,284 | 100.0% |
Employment Status by Age in Hatillo
According to the labor force statistics for Hatillo, out of the total population over 16 years of age (3,601), 43.0% or 1,548 individuals are in the labor force, with 17.0% or 263 of them unemployed. The age group with the highest labor force participation rate is 45 to 54 years, with 72.3% or 295 individuals in the labor force. Within the labor force, the 45 to 54 years age range has the highest percentage of unemployed individuals, with 31.9% or 94 of them being unemployed.
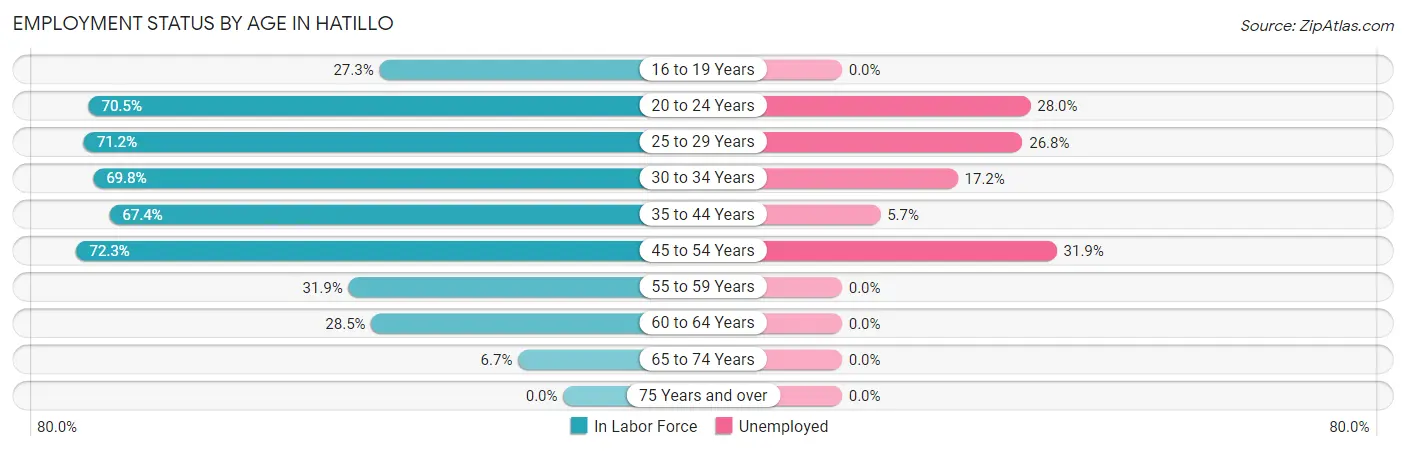
| Age Bracket | In Labor Force | Unemployed |
| 16 to 19 Years | 24 (27.3%) | 0 (0.0%) |
| 20 to 24 Years | 186 (70.5%) | 52 (28.0%) |
| 25 to 29 Years | 190 (71.2%) | 51 (26.8%) |
| 30 to 34 Years | 296 (69.8%) | 51 (17.2%) |
| 35 to 44 Years | 283 (67.4%) | 16 (5.7%) |
| 45 to 54 Years | 295 (72.3%) | 94 (31.9%) |
| 55 to 59 Years | 136 (31.9%) | 0 (0.0%) |
| 60 to 64 Years | 105 (28.5%) | 0 (0.0%) |
| 65 to 74 Years | 34 (6.7%) | 0 (0.0%) |
| 75 Years and over | 0 (0.0%) | 0 (0.0%) |
| Total | 1,548 (43.0%) | 263 (17.0%) |
Employment Status by Educational Attainment in Hatillo
According to labor force statistics for Hatillo, 56.4% of individuals (1,305) out of the total population between 25 and 64 years of age (2,314) are in the labor force, with 16.2% or 211 of them being unemployed. The group with the highest labor force participation rate are those with the educational attainment of bachelor's degree or higher, with 71.6% or 433 individuals in the labor force. Within the labor force, individuals with college / associate degree education have the highest percentage of unemployment, with 23.2% or 93 of them being unemployed.
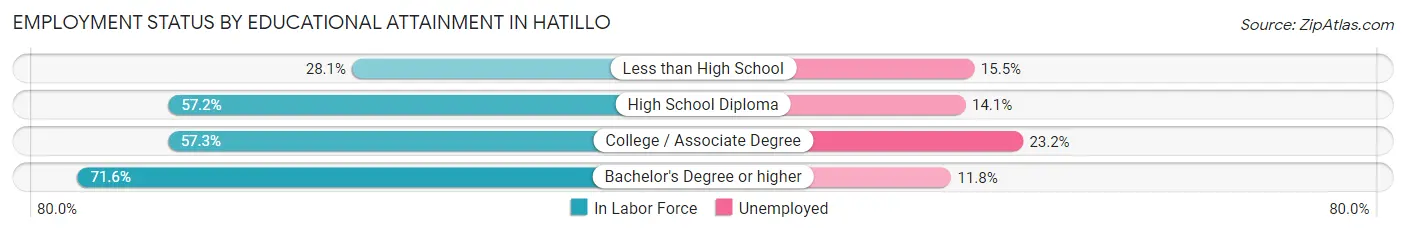
| Educational Attainment | In Labor Force | Unemployed |
| Less than High School | 103 (28.1%) | 57 (15.5%) |
| High School Diploma | 368 (57.2%) | 91 (14.1%) |
| College / Associate Degree | 401 (57.3%) | 162 (23.2%) |
| Bachelor's Degree or higher | 433 (71.6%) | 71 (11.8%) |
| Total | 1,305 (56.4%) | 375 (16.2%) |
Employment Occupations by Sex in Hatillo
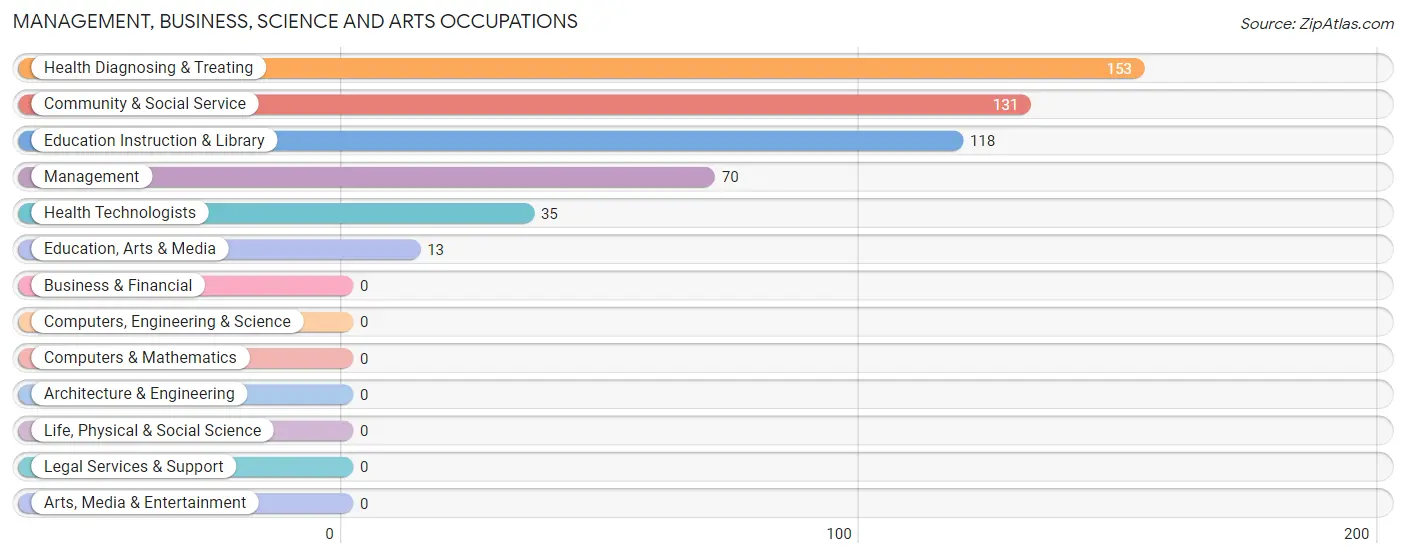
Management, Business, Science and Arts Occupations
The most common Management, Business, Science and Arts occupations in Hatillo are Health Diagnosing & Treating (153 | 11.9%), Community & Social Service (131 | 10.2%), Education Instruction & Library (118 | 9.2%), Management (70 | 5.4%), and Health Technologists (35 | 2.7%).
Management, Business, Science and Arts Occupations by Sex
Within the Management, Business, Science and Arts occupations in Hatillo, the most male-oriented occupations are Education Instruction & Library (59.3%), Community & Social Service (55.0%), and Health Technologists (48.6%), while the most female-oriented occupations are Management (87.1%), Education, Arts & Media (84.6%), and Health Diagnosing & Treating (58.2%).
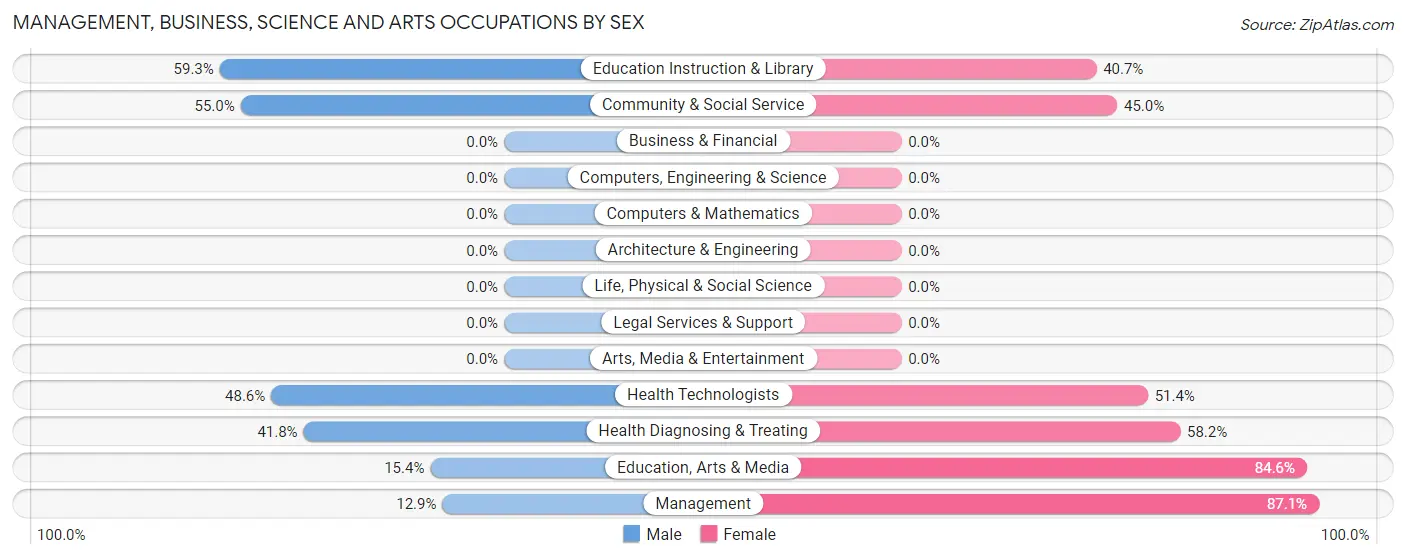
| Occupation | Male | Female |
| Management | 9 (12.9%) | 61 (87.1%) |
| Business & Financial | 0 (0.0%) | 0 (0.0%) |
| Computers, Engineering & Science | 0 (0.0%) | 0 (0.0%) |
| Computers & Mathematics | 0 (0.0%) | 0 (0.0%) |
| Architecture & Engineering | 0 (0.0%) | 0 (0.0%) |
| Life, Physical & Social Science | 0 (0.0%) | 0 (0.0%) |
| Community & Social Service | 72 (55.0%) | 59 (45.0%) |
| Education, Arts & Media | 2 (15.4%) | 11 (84.6%) |
| Legal Services & Support | 0 (0.0%) | 0 (0.0%) |
| Education Instruction & Library | 70 (59.3%) | 48 (40.7%) |
| Arts, Media & Entertainment | 0 (0.0%) | 0 (0.0%) |
| Health Diagnosing & Treating | 64 (41.8%) | 89 (58.2%) |
| Health Technologists | 17 (48.6%) | 18 (51.4%) |
| Total (Category) | 145 (41.0%) | 209 (59.0%) |
| Total (Overall) | 622 (48.4%) | 663 (51.6%) |
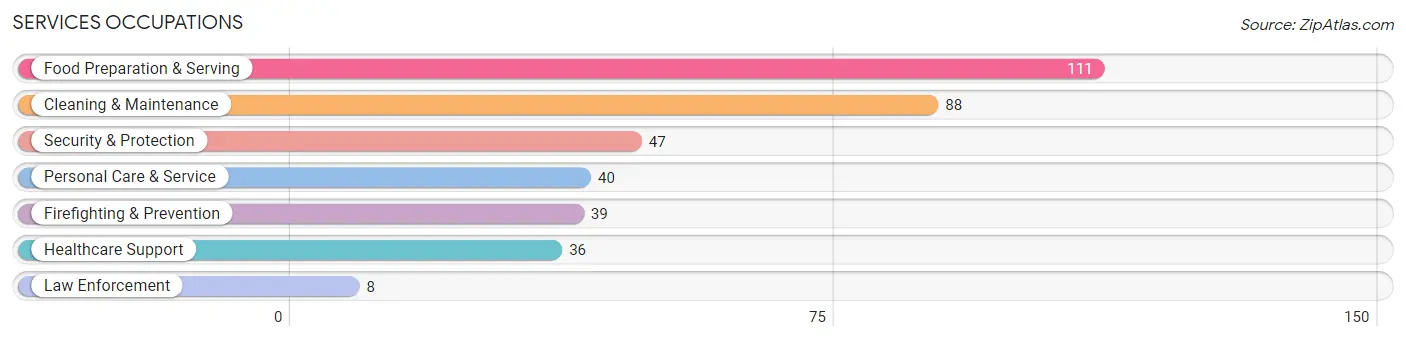
Services Occupations
The most common Services occupations in Hatillo are Food Preparation & Serving (111 | 8.6%), Cleaning & Maintenance (88 | 6.9%), Security & Protection (47 | 3.7%), Personal Care & Service (40 | 3.1%), and Firefighting & Prevention (39 | 3.0%).
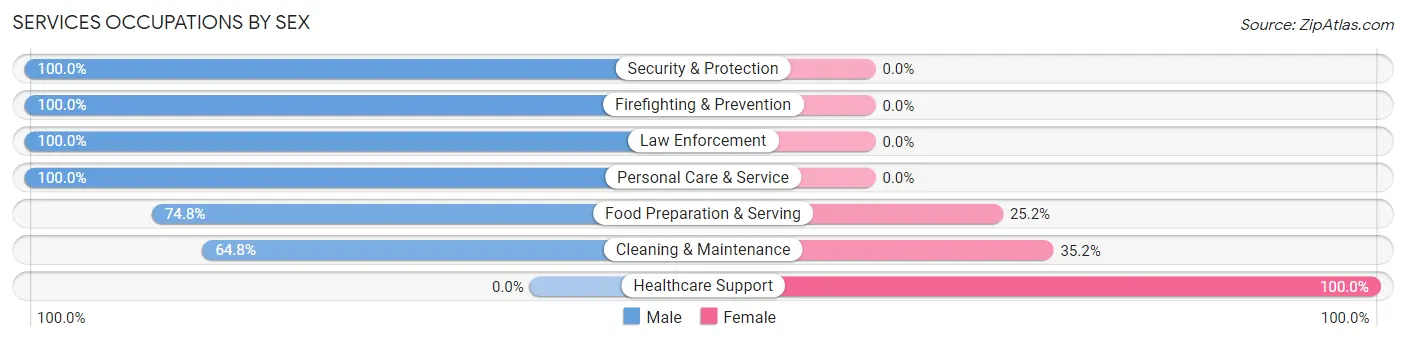
Services Occupations by Sex
Within the Services occupations in Hatillo, the most male-oriented occupations are Security & Protection (100.0%), Firefighting & Prevention (100.0%), and Law Enforcement (100.0%), while the most female-oriented occupations are Healthcare Support (100.0%), Cleaning & Maintenance (35.2%), and Food Preparation & Serving (25.2%).
| Occupation | Male | Female |
| Healthcare Support | 0 (0.0%) | 36 (100.0%) |
| Security & Protection | 47 (100.0%) | 0 (0.0%) |
| Firefighting & Prevention | 39 (100.0%) | 0 (0.0%) |
| Law Enforcement | 8 (100.0%) | 0 (0.0%) |
| Food Preparation & Serving | 83 (74.8%) | 28 (25.2%) |
| Cleaning & Maintenance | 57 (64.8%) | 31 (35.2%) |
| Personal Care & Service | 40 (100.0%) | 0 (0.0%) |
| Total (Category) | 227 (70.5%) | 95 (29.5%) |
| Total (Overall) | 622 (48.4%) | 663 (51.6%) |
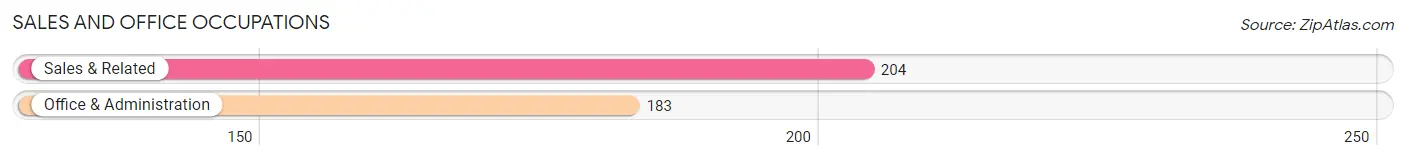
Sales and Office Occupations
The most common Sales and Office occupations in Hatillo are Sales & Related (204 | 15.9%), and Office & Administration (183 | 14.2%).
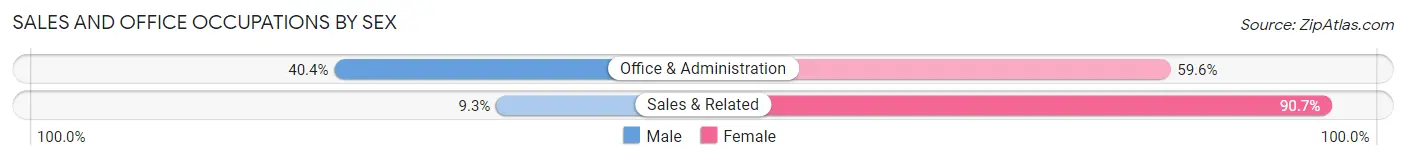
Sales and Office Occupations by Sex
| Occupation | Male | Female |
| Sales & Related | 19 (9.3%) | 185 (90.7%) |
| Office & Administration | 74 (40.4%) | 109 (59.6%) |
| Total (Category) | 93 (24.0%) | 294 (76.0%) |
| Total (Overall) | 622 (48.4%) | 663 (51.6%) |
Natural Resources, Construction and Maintenance Occupations
The most common Natural Resources, Construction and Maintenance occupations in Hatillo are Farming, Fishing & Forestry (45 | 3.5%), and Construction & Extraction (43 | 3.4%).
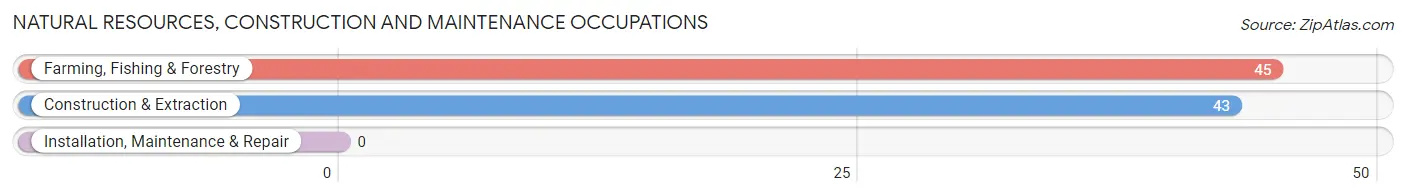
Natural Resources, Construction and Maintenance Occupations by Sex
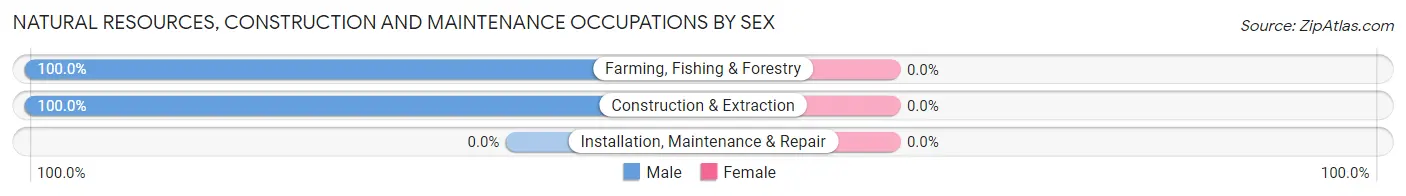
| Occupation | Male | Female |
| Farming, Fishing & Forestry | 45 (100.0%) | 0 (0.0%) |
| Construction & Extraction | 43 (100.0%) | 0 (0.0%) |
| Installation, Maintenance & Repair | 0 (0.0%) | 0 (0.0%) |
| Total (Category) | 88 (100.0%) | 0 (0.0%) |
| Total (Overall) | 622 (48.4%) | 663 (51.6%) |
Production, Transportation and Moving Occupations
The most common Production, Transportation and Moving occupations in Hatillo are Production (75 | 5.8%), Material Moving (38 | 3.0%), and Transportation (21 | 1.6%).
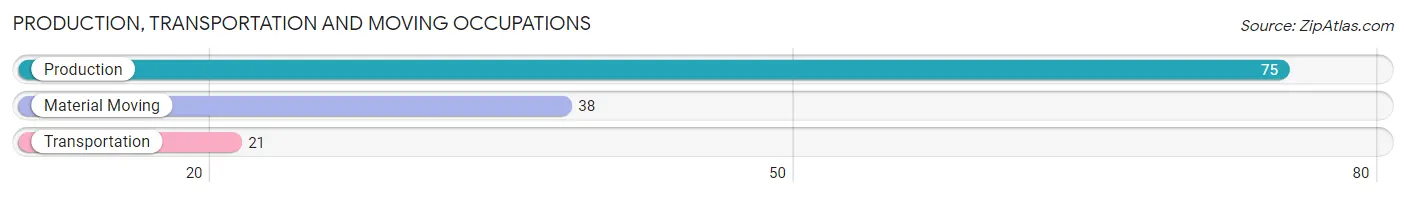
Production, Transportation and Moving Occupations by Sex
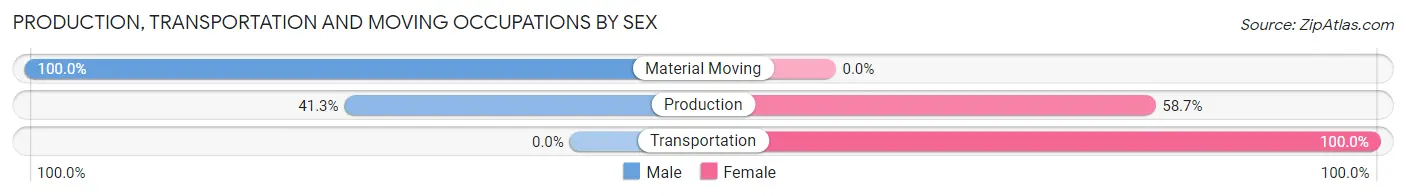
| Occupation | Male | Female |
| Production | 31 (41.3%) | 44 (58.7%) |
| Transportation | 0 (0.0%) | 21 (100.0%) |
| Material Moving | 38 (100.0%) | 0 (0.0%) |
| Total (Category) | 69 (51.5%) | 65 (48.5%) |
| Total (Overall) | 622 (48.4%) | 663 (51.6%) |
Employment Industries by Sex in Hatillo
Employment Industries in Hatillo
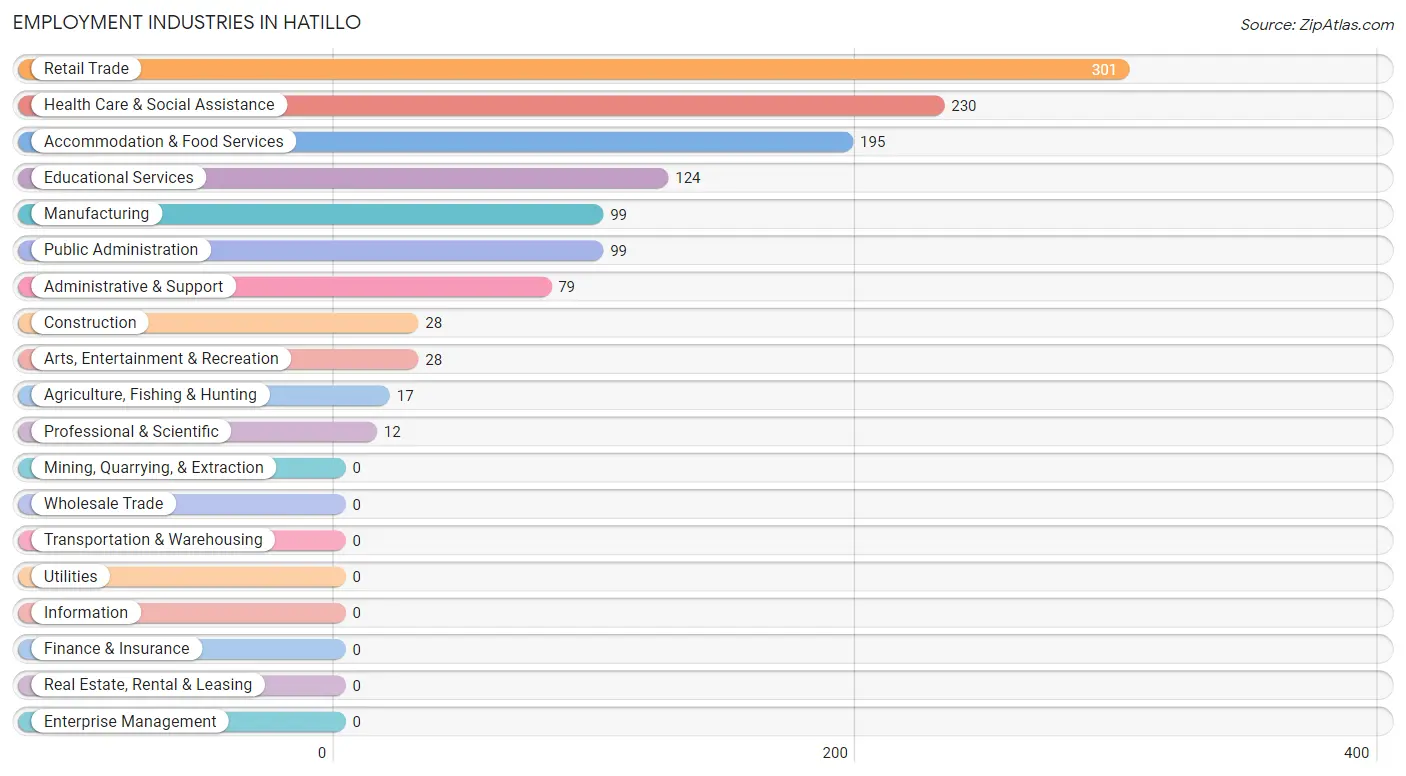
The major employment industries in Hatillo include Retail Trade (301 | 23.4%), Health Care & Social Assistance (230 | 17.9%), Accommodation & Food Services (195 | 15.2%), Educational Services (124 | 9.7%), and Manufacturing (99 | 7.7%).
Employment Industries by Sex in Hatillo
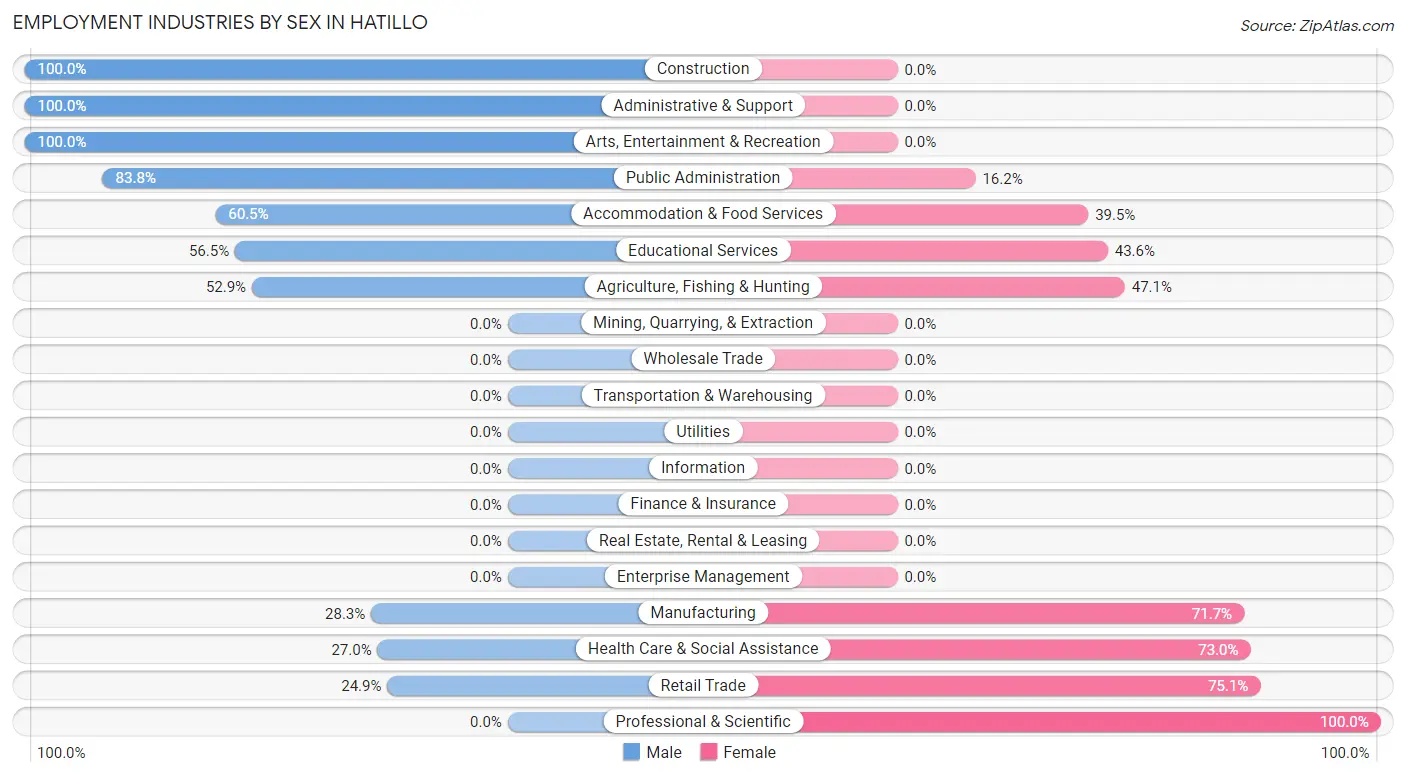
The Hatillo industries that see more men than women are Construction (100.0%), Administrative & Support (100.0%), and Arts, Entertainment & Recreation (100.0%), whereas the industries that tend to have a higher number of women are Professional & Scientific (100.0%), Retail Trade (75.1%), and Health Care & Social Assistance (73.0%).
| Industry | Male | Female |
| Agriculture, Fishing & Hunting | 9 (52.9%) | 8 (47.1%) |
| Mining, Quarrying, & Extraction | 0 (0.0%) | 0 (0.0%) |
| Construction | 28 (100.0%) | 0 (0.0%) |
| Manufacturing | 28 (28.3%) | 71 (71.7%) |
| Wholesale Trade | 0 (0.0%) | 0 (0.0%) |
| Retail Trade | 75 (24.9%) | 226 (75.1%) |
| Transportation & Warehousing | 0 (0.0%) | 0 (0.0%) |
| Utilities | 0 (0.0%) | 0 (0.0%) |
| Information | 0 (0.0%) | 0 (0.0%) |
| Finance & Insurance | 0 (0.0%) | 0 (0.0%) |
| Real Estate, Rental & Leasing | 0 (0.0%) | 0 (0.0%) |
| Professional & Scientific | 0 (0.0%) | 12 (100.0%) |
| Enterprise Management | 0 (0.0%) | 0 (0.0%) |
| Administrative & Support | 79 (100.0%) | 0 (0.0%) |
| Educational Services | 70 (56.5%) | 54 (43.5%) |
| Health Care & Social Assistance | 62 (27.0%) | 168 (73.0%) |
| Arts, Entertainment & Recreation | 28 (100.0%) | 0 (0.0%) |
| Accommodation & Food Services | 118 (60.5%) | 77 (39.5%) |
| Public Administration | 83 (83.8%) | 16 (16.2%) |
| Total | 622 (48.4%) | 663 (51.6%) |
Education in Hatillo
School Enrollment in Hatillo
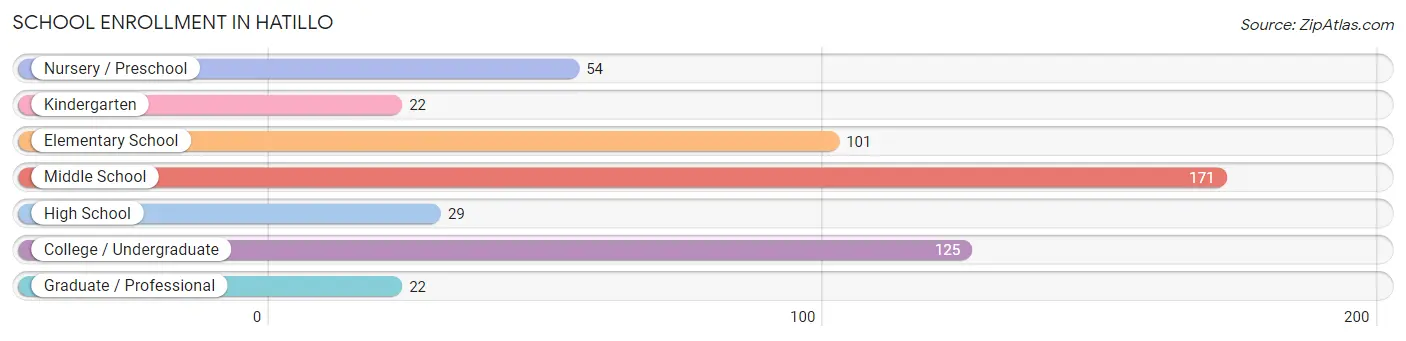
The most common levels of schooling among the 524 students in Hatillo are middle school (171 | 32.6%), college / undergraduate (125 | 23.8%), and elementary school (101 | 19.3%).
| School Level | # Students | % Students |
| Nursery / Preschool | 54 | 10.3% |
| Kindergarten | 22 | 4.2% |
| Elementary School | 101 | 19.3% |
| Middle School | 171 | 32.6% |
| High School | 29 | 5.5% |
| College / Undergraduate | 125 | 23.8% |
| Graduate / Professional | 22 | 4.2% |
| Total | 524 | 100.0% |
School Enrollment by Age by Funding Source in Hatillo
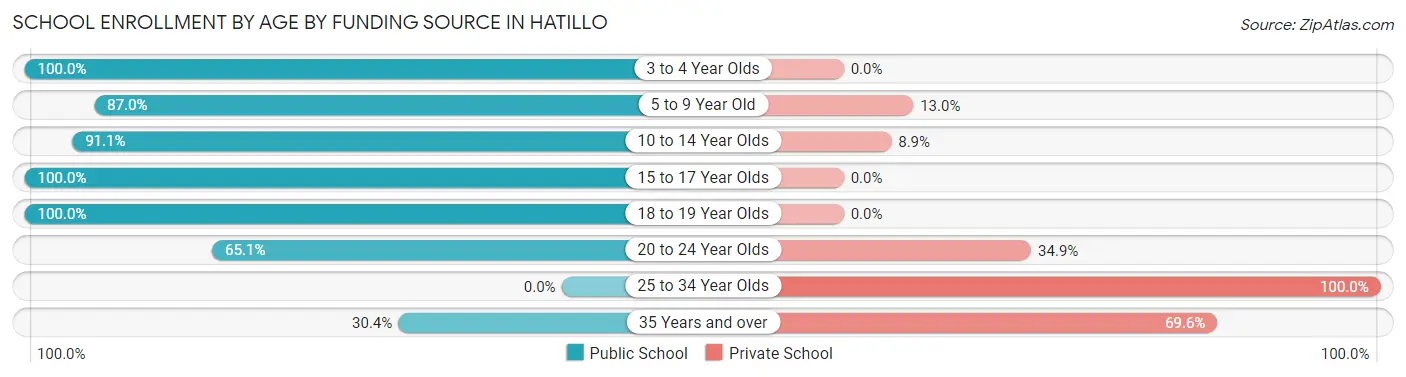
Out of a total of 524 students who are enrolled in schools in Hatillo, 92 (17.6%) attend a private institution, while the remaining 432 (82.4%) are enrolled in public schools. The age group of 25 to 34 year olds has the highest likelihood of being enrolled in private schools, with 22 (100.0% in the age bracket) enrolled. Conversely, the age group of 3 to 4 year olds has the lowest likelihood of being enrolled in a private school, with 30 (100.0% in the age bracket) attending a public institution.
| Age Bracket | Public School | Private School |
| 3 to 4 Year Olds | 30 (100.0%) | 0 (0.0%) |
| 5 to 9 Year Old | 94 (87.0%) | 14 (13.0%) |
| 10 to 14 Year Olds | 185 (91.1%) | 18 (8.9%) |
| 15 to 17 Year Olds | 45 (100.0%) | 0 (0.0%) |
| 18 to 19 Year Olds | 30 (100.0%) | 0 (0.0%) |
| 20 to 24 Year Olds | 41 (65.1%) | 22 (34.9%) |
| 25 to 34 Year Olds | 0 (0.0%) | 22 (100.0%) |
| 35 Years and over | 7 (30.4%) | 16 (69.6%) |
| Total | 432 (82.4%) | 92 (17.6%) |
Educational Attainment by Field of Study in Hatillo
Education (303 | 37.3%), arts & humanities (119 | 14.6%), business (111 | 13.7%), science & technology (100 | 12.3%), and psychology (81 | 10.0%) are the most common fields of study among 813 individuals in Hatillo who have obtained a bachelor's degree or higher.
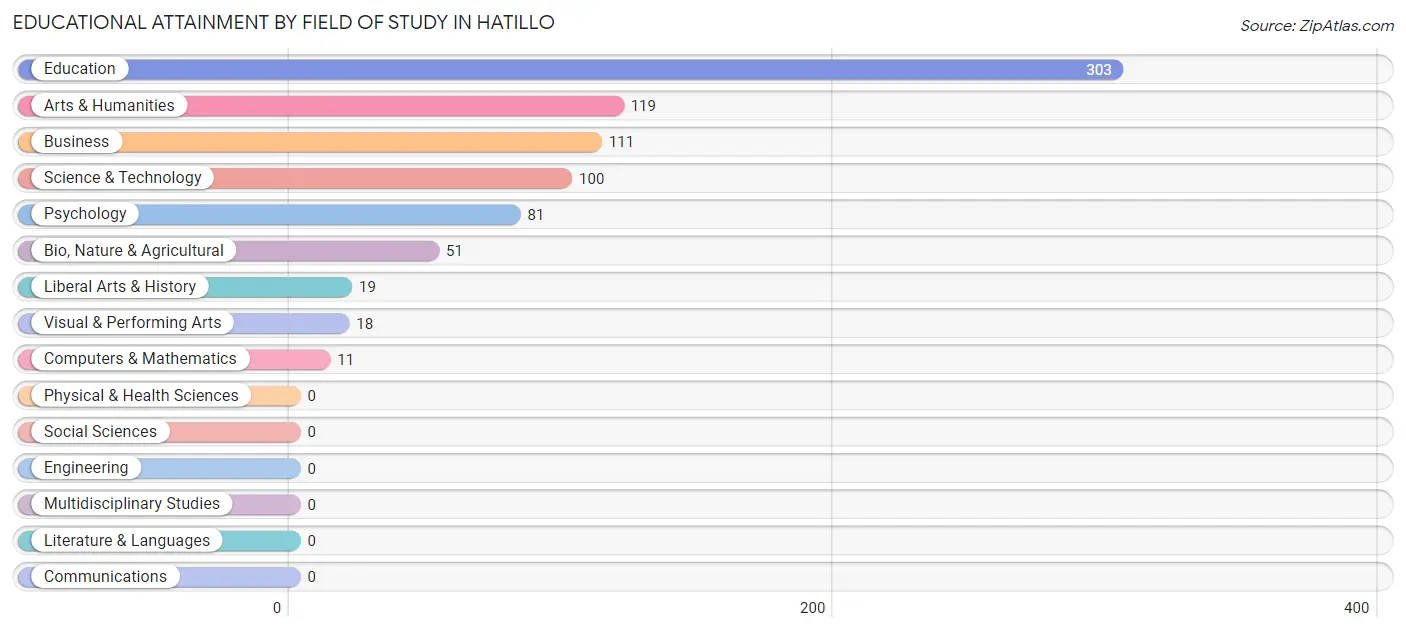
| Field of Study | # Graduates | % Graduates |
| Computers & Mathematics | 11 | 1.3% |
| Bio, Nature & Agricultural | 51 | 6.3% |
| Physical & Health Sciences | 0 | 0.0% |
| Psychology | 81 | 10.0% |
| Social Sciences | 0 | 0.0% |
| Engineering | 0 | 0.0% |
| Multidisciplinary Studies | 0 | 0.0% |
| Science & Technology | 100 | 12.3% |
| Business | 111 | 13.7% |
| Education | 303 | 37.3% |
| Literature & Languages | 0 | 0.0% |
| Liberal Arts & History | 19 | 2.3% |
| Visual & Performing Arts | 18 | 2.2% |
| Communications | 0 | 0.0% |
| Arts & Humanities | 119 | 14.6% |
| Total | 813 | 100.0% |
Transportation & Commute in Hatillo
Vehicle Availability by Sex in Hatillo
The most prevalent vehicle ownership categories in Hatillo are males with 2 vehicles (357, accounting for 57.6%) and females with 2 vehicles (230, making up 53.9%).
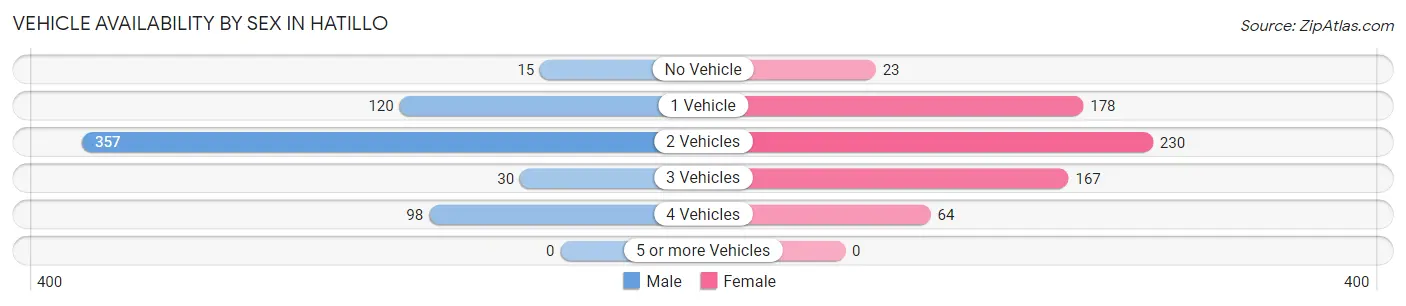
| Vehicles Available | Male | Female |
| No Vehicle | 15 (2.4%) | 23 (3.5%) |
| 1 Vehicle | 120 (19.4%) | 178 (26.9%) |
| 2 Vehicles | 357 (57.6%) | 230 (34.7%) |
| 3 Vehicles | 30 (4.8%) | 167 (25.2%) |
| 4 Vehicles | 98 (15.8%) | 64 (9.7%) |
| 5 or more Vehicles | 0 (0.0%) | 0 (0.0%) |
| Total | 620 (100.0%) | 662 (100.0%) |
Commute Time in Hatillo
The most frequently occuring commute durations in Hatillo are 20 to 24 minutes (524 commuters, 44.9%), 10 to 14 minutes (238 commuters, 20.4%), and 15 to 19 minutes (173 commuters, 14.8%).
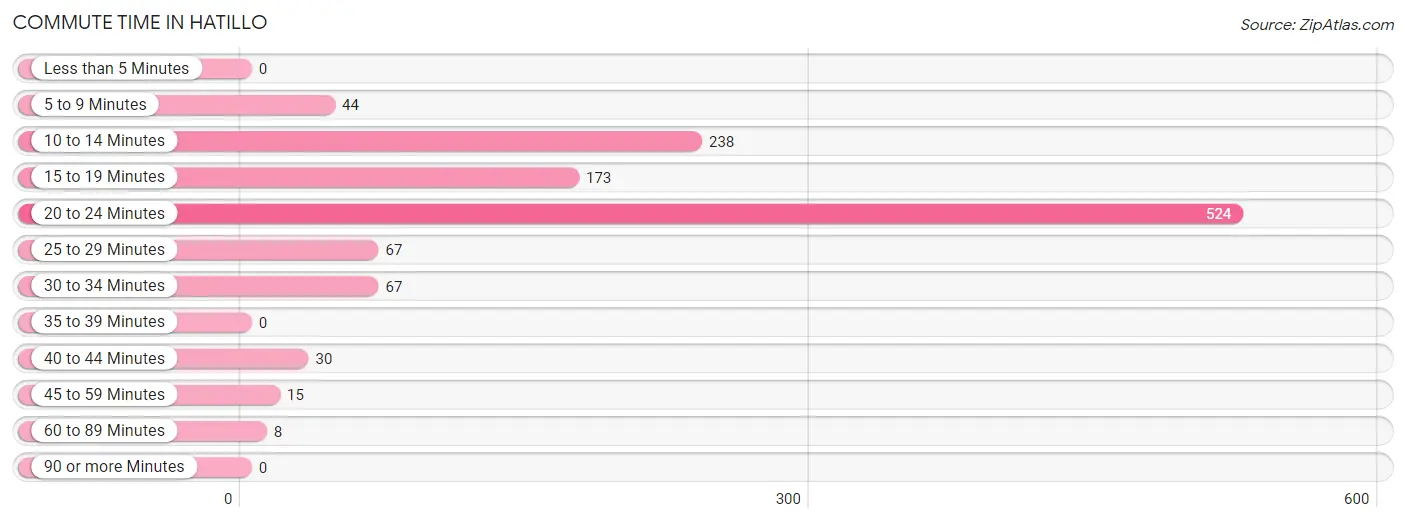
| Commute Time | # Commuters | % Commuters |
| Less than 5 Minutes | 0 | 0.0% |
| 5 to 9 Minutes | 44 | 3.8% |
| 10 to 14 Minutes | 238 | 20.4% |
| 15 to 19 Minutes | 173 | 14.8% |
| 20 to 24 Minutes | 524 | 44.9% |
| 25 to 29 Minutes | 67 | 5.8% |
| 30 to 34 Minutes | 67 | 5.8% |
| 35 to 39 Minutes | 0 | 0.0% |
| 40 to 44 Minutes | 30 | 2.6% |
| 45 to 59 Minutes | 15 | 1.3% |
| 60 to 89 Minutes | 8 | 0.7% |
| 90 or more Minutes | 0 | 0.0% |
Commute Time by Sex in Hatillo
The most common commute times in Hatillo are 20 to 24 minutes (258 commuters, 46.8%) for males and 20 to 24 minutes (266 commuters, 43.2%) for females.
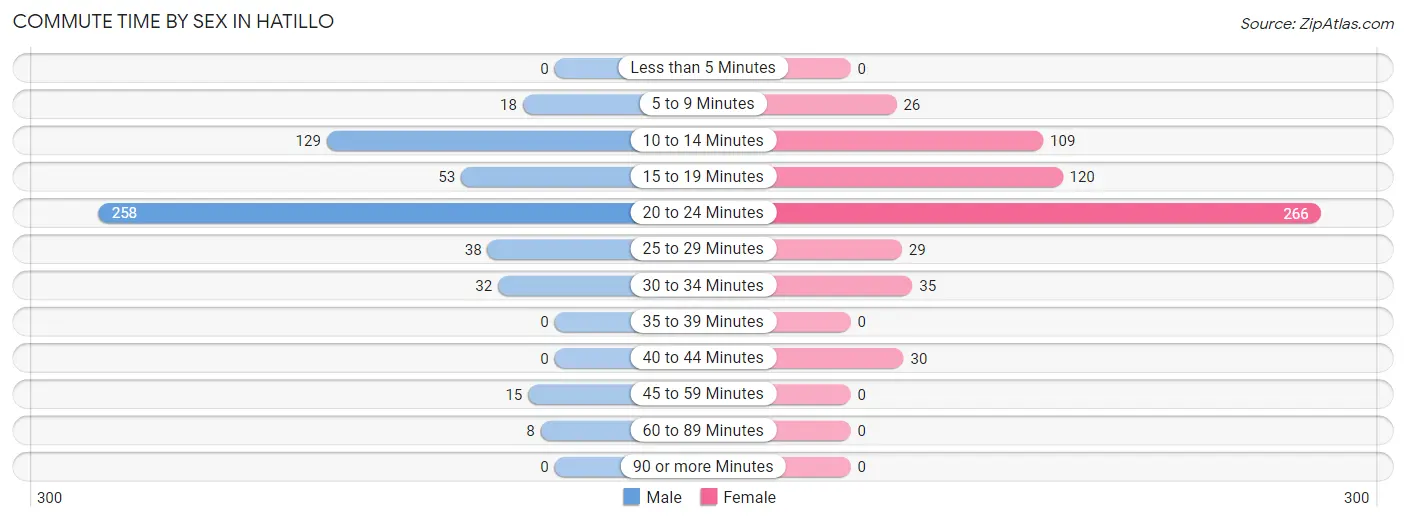
| Commute Time | Male | Female |
| Less than 5 Minutes | 0 (0.0%) | 0 (0.0%) |
| 5 to 9 Minutes | 18 (3.3%) | 26 (4.2%) |
| 10 to 14 Minutes | 129 (23.4%) | 109 (17.7%) |
| 15 to 19 Minutes | 53 (9.6%) | 120 (19.5%) |
| 20 to 24 Minutes | 258 (46.8%) | 266 (43.2%) |
| 25 to 29 Minutes | 38 (6.9%) | 29 (4.7%) |
| 30 to 34 Minutes | 32 (5.8%) | 35 (5.7%) |
| 35 to 39 Minutes | 0 (0.0%) | 0 (0.0%) |
| 40 to 44 Minutes | 0 (0.0%) | 30 (4.9%) |
| 45 to 59 Minutes | 15 (2.7%) | 0 (0.0%) |
| 60 to 89 Minutes | 8 (1.5%) | 0 (0.0%) |
| 90 or more Minutes | 0 (0.0%) | 0 (0.0%) |
Time of Departure to Work by Sex in Hatillo
The most frequent times of departure to work in Hatillo are 7:00 AM to 7:29 AM (183, 33.2%) for males and 7:00 AM to 7:29 AM (211, 34.3%) for females.
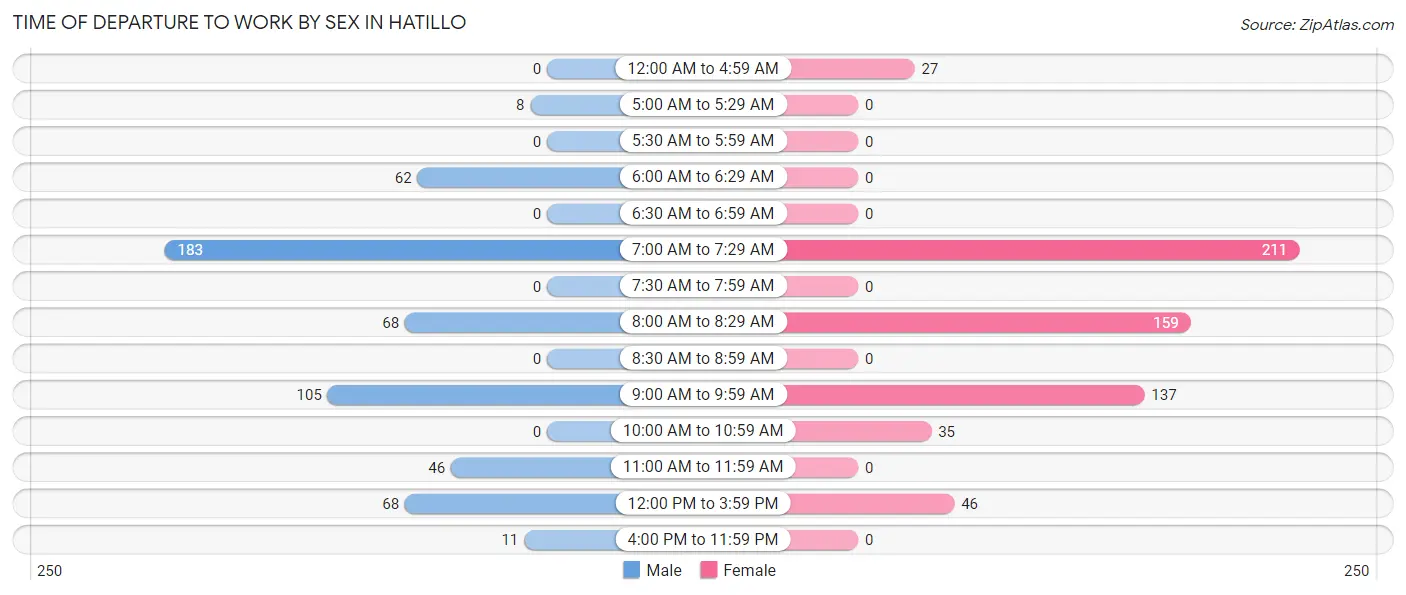
| Time of Departure | Male | Female |
| 12:00 AM to 4:59 AM | 0 (0.0%) | 27 (4.4%) |
| 5:00 AM to 5:29 AM | 8 (1.5%) | 0 (0.0%) |
| 5:30 AM to 5:59 AM | 0 (0.0%) | 0 (0.0%) |
| 6:00 AM to 6:29 AM | 62 (11.3%) | 0 (0.0%) |
| 6:30 AM to 6:59 AM | 0 (0.0%) | 0 (0.0%) |
| 7:00 AM to 7:29 AM | 183 (33.2%) | 211 (34.3%) |
| 7:30 AM to 7:59 AM | 0 (0.0%) | 0 (0.0%) |
| 8:00 AM to 8:29 AM | 68 (12.3%) | 159 (25.9%) |
| 8:30 AM to 8:59 AM | 0 (0.0%) | 0 (0.0%) |
| 9:00 AM to 9:59 AM | 105 (19.1%) | 137 (22.3%) |
| 10:00 AM to 10:59 AM | 0 (0.0%) | 35 (5.7%) |
| 11:00 AM to 11:59 AM | 46 (8.4%) | 0 (0.0%) |
| 12:00 PM to 3:59 PM | 68 (12.3%) | 46 (7.5%) |
| 4:00 PM to 11:59 PM | 11 (2.0%) | 0 (0.0%) |
| Total | 551 (100.0%) | 615 (100.0%) |
Housing Occupancy in Hatillo
Occupancy by Ownership in Hatillo
Of the total 1,560 dwellings in Hatillo, owner-occupied units account for 880 (56.4%), while renter-occupied units make up 680 (43.6%).
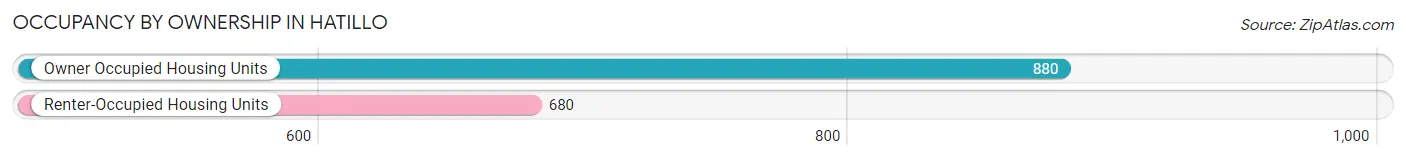
| Occupancy | # Housing Units | % Housing Units |
| Owner Occupied Housing Units | 880 | 56.4% |
| Renter-Occupied Housing Units | 680 | 43.6% |
| Total Occupied Housing Units | 1,560 | 100.0% |
Occupancy by Household Size in Hatillo
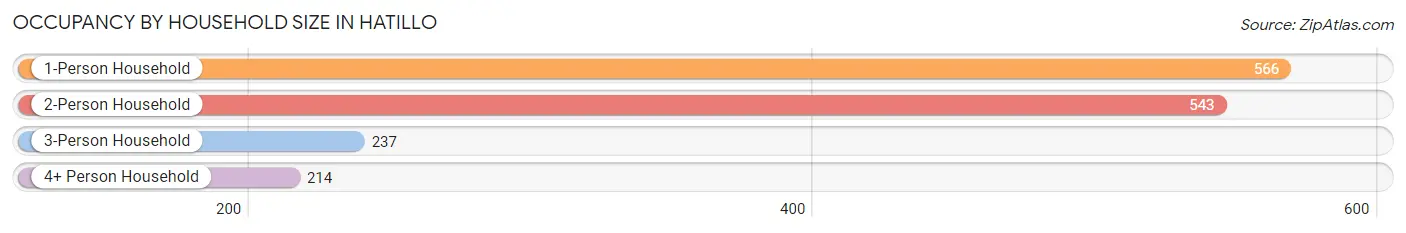
| Household Size | # Housing Units | % Housing Units |
| 1-Person Household | 566 | 36.3% |
| 2-Person Household | 543 | 34.8% |
| 3-Person Household | 237 | 15.2% |
| 4+ Person Household | 214 | 13.7% |
| Total Housing Units | 1,560 | 100.0% |
Occupancy by Ownership by Household Size in Hatillo
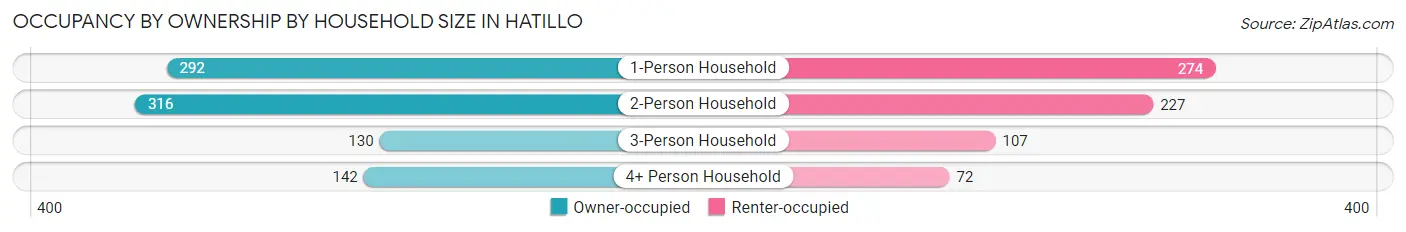
| Household Size | Owner-occupied | Renter-occupied |
| 1-Person Household | 292 (51.6%) | 274 (48.4%) |
| 2-Person Household | 316 (58.2%) | 227 (41.8%) |
| 3-Person Household | 130 (54.8%) | 107 (45.2%) |
| 4+ Person Household | 142 (66.4%) | 72 (33.6%) |
| Total Housing Units | 880 (56.4%) | 680 (43.6%) |
Occupancy by Educational Attainment in Hatillo
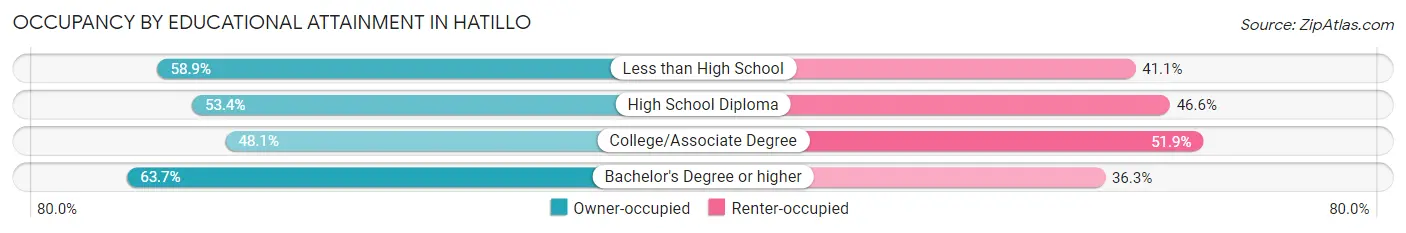
| Household Size | Owner-occupied | Renter-occupied |
| Less than High School | 278 (58.9%) | 194 (41.1%) |
| High School Diploma | 171 (53.4%) | 149 (46.6%) |
| College/Associate Degree | 180 (48.1%) | 194 (51.9%) |
| Bachelor's Degree or higher | 251 (63.7%) | 143 (36.3%) |
Occupancy by Age of Householder in Hatillo
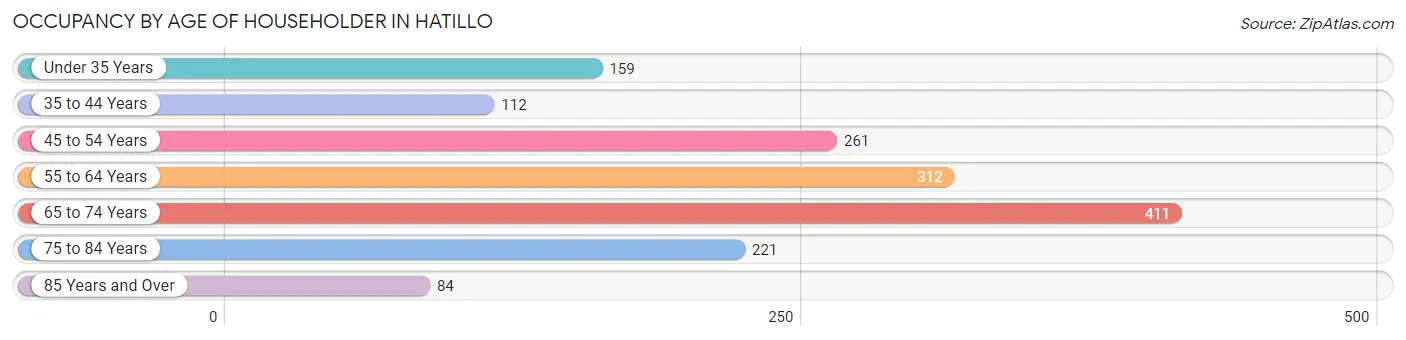
| Age Bracket | # Households | % Households |
| Under 35 Years | 159 | 10.2% |
| 35 to 44 Years | 112 | 7.2% |
| 45 to 54 Years | 261 | 16.7% |
| 55 to 64 Years | 312 | 20.0% |
| 65 to 74 Years | 411 | 26.4% |
| 75 to 84 Years | 221 | 14.2% |
| 85 Years and Over | 84 | 5.4% |
| Total | 1,560 | 100.0% |
Housing Finances in Hatillo
Median Income by Occupancy in Hatillo
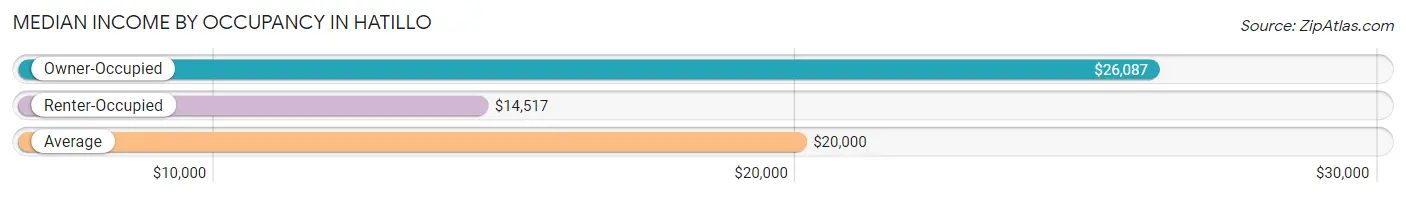
| Occupancy Type | # Households | Median Income |
| Owner-Occupied | 880 (56.4%) | $26,087 |
| Renter-Occupied | 680 (43.6%) | $14,517 |
| Average | 1,560 (100.0%) | $20,000 |
Occupancy by Householder Income Bracket in Hatillo
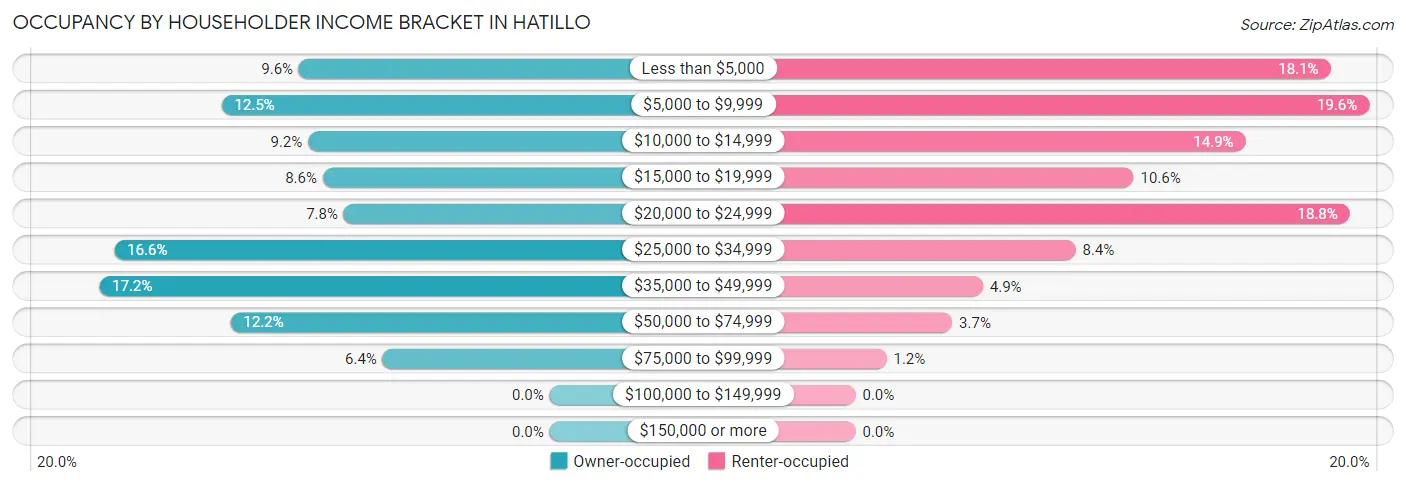
| Income Bracket | Owner-occupied | Renter-occupied |
| Less than $5,000 | 84 (9.6%) | 123 (18.1%) |
| $5,000 to $9,999 | 110 (12.5%) | 133 (19.6%) |
| $10,000 to $14,999 | 81 (9.2%) | 101 (14.8%) |
| $15,000 to $19,999 | 76 (8.6%) | 72 (10.6%) |
| $20,000 to $24,999 | 69 (7.8%) | 128 (18.8%) |
| $25,000 to $34,999 | 146 (16.6%) | 57 (8.4%) |
| $35,000 to $49,999 | 151 (17.2%) | 33 (4.9%) |
| $50,000 to $74,999 | 107 (12.2%) | 25 (3.7%) |
| $75,000 to $99,999 | 56 (6.4%) | 8 (1.2%) |
| $100,000 to $149,999 | 0 (0.0%) | 0 (0.0%) |
| $150,000 or more | 0 (0.0%) | 0 (0.0%) |
| Total | 880 (100.0%) | 680 (100.0%) |
Monthly Housing Cost Tiers in Hatillo
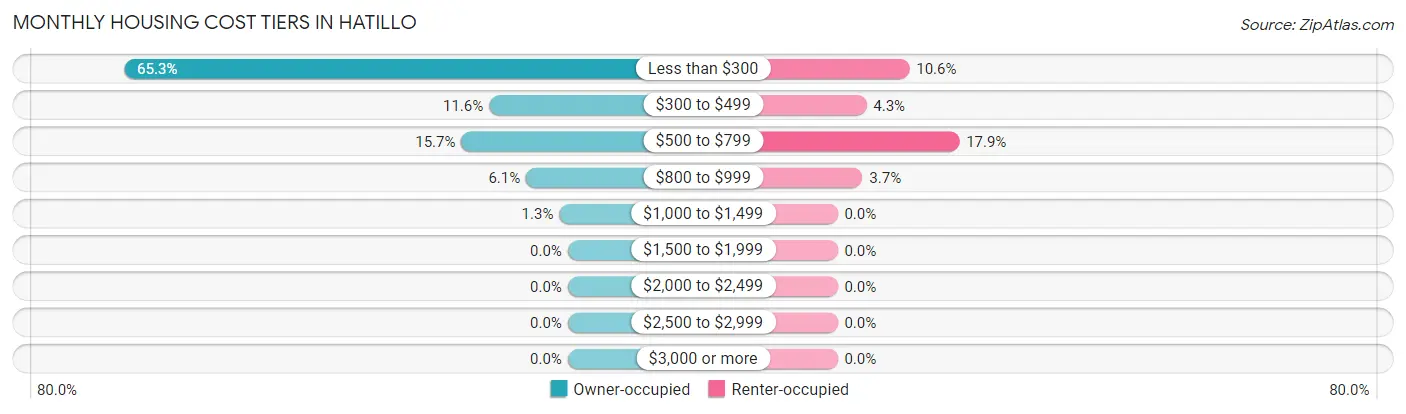
| Monthly Cost | Owner-occupied | Renter-occupied |
| Less than $300 | 575 (65.3%) | 72 (10.6%) |
| $300 to $499 | 102 (11.6%) | 29 (4.3%) |
| $500 to $799 | 138 (15.7%) | 122 (17.9%) |
| $800 to $999 | 54 (6.1%) | 25 (3.7%) |
| $1,000 to $1,499 | 11 (1.3%) | 0 (0.0%) |
| $1,500 to $1,999 | 0 (0.0%) | 0 (0.0%) |
| $2,000 to $2,499 | 0 (0.0%) | 0 (0.0%) |
| $2,500 to $2,999 | 0 (0.0%) | 0 (0.0%) |
| $3,000 or more | 0 (0.0%) | 0 (0.0%) |
| Total | 880 (100.0%) | 680 (100.0%) |
Physical Housing Characteristics in Hatillo
Housing Structures in Hatillo
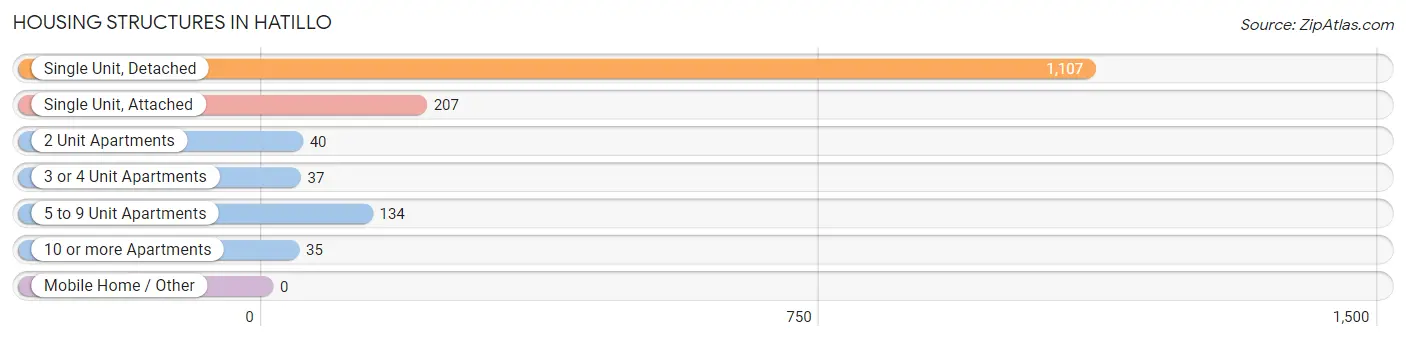
| Structure Type | # Housing Units | % Housing Units |
| Single Unit, Detached | 1,107 | 71.0% |
| Single Unit, Attached | 207 | 13.3% |
| 2 Unit Apartments | 40 | 2.6% |
| 3 or 4 Unit Apartments | 37 | 2.4% |
| 5 to 9 Unit Apartments | 134 | 8.6% |
| 10 or more Apartments | 35 | 2.2% |
| Mobile Home / Other | 0 | 0.0% |
| Total | 1,560 | 100.0% |
Housing Structures by Occupancy in Hatillo
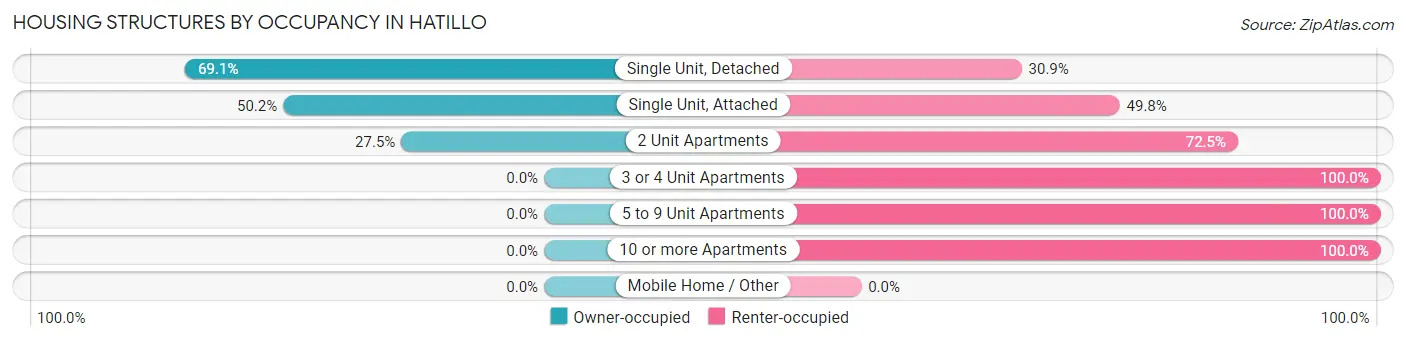
| Structure Type | Owner-occupied | Renter-occupied |
| Single Unit, Detached | 765 (69.1%) | 342 (30.9%) |
| Single Unit, Attached | 104 (50.2%) | 103 (49.8%) |
| 2 Unit Apartments | 11 (27.5%) | 29 (72.5%) |
| 3 or 4 Unit Apartments | 0 (0.0%) | 37 (100.0%) |
| 5 to 9 Unit Apartments | 0 (0.0%) | 134 (100.0%) |
| 10 or more Apartments | 0 (0.0%) | 35 (100.0%) |
| Mobile Home / Other | 0 (0.0%) | 0 (0.0%) |
| Total | 880 (56.4%) | 680 (43.6%) |
Housing Structures by Number of Rooms in Hatillo
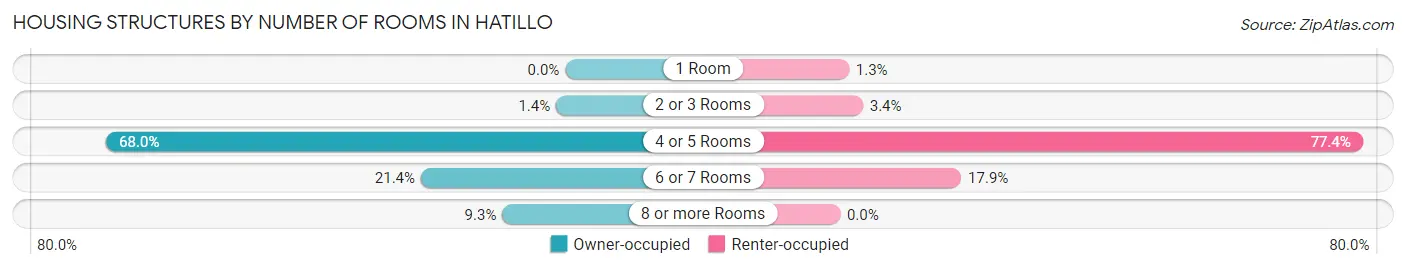
| Number of Rooms | Owner-occupied | Renter-occupied |
| 1 Room | 0 (0.0%) | 9 (1.3%) |
| 2 or 3 Rooms | 12 (1.4%) | 23 (3.4%) |
| 4 or 5 Rooms | 598 (67.9%) | 526 (77.3%) |
| 6 or 7 Rooms | 188 (21.4%) | 122 (17.9%) |
| 8 or more Rooms | 82 (9.3%) | 0 (0.0%) |
| Total | 880 (100.0%) | 680 (100.0%) |
Housing Structure by Heating Type in Hatillo
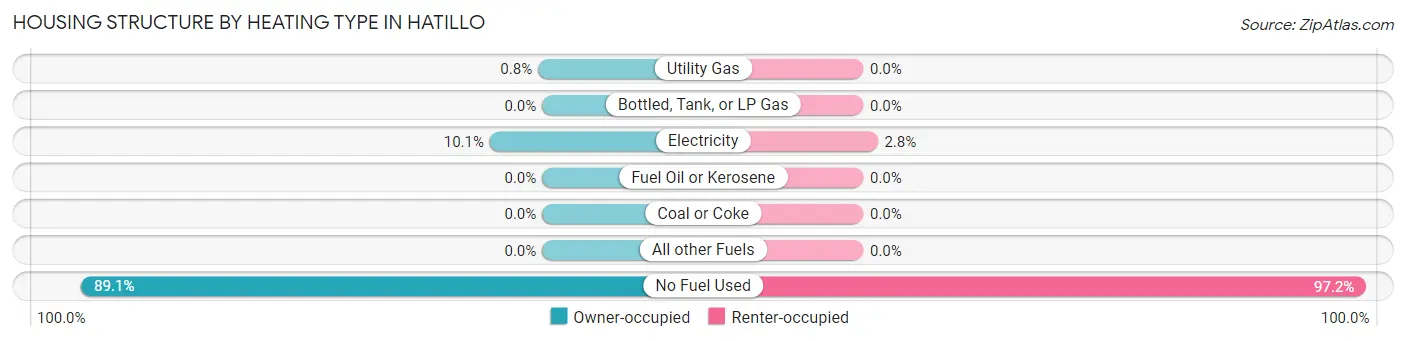
| Heating Type | Owner-occupied | Renter-occupied |
| Utility Gas | 7 (0.8%) | 0 (0.0%) |
| Bottled, Tank, or LP Gas | 0 (0.0%) | 0 (0.0%) |
| Electricity | 89 (10.1%) | 19 (2.8%) |
| Fuel Oil or Kerosene | 0 (0.0%) | 0 (0.0%) |
| Coal or Coke | 0 (0.0%) | 0 (0.0%) |
| All other Fuels | 0 (0.0%) | 0 (0.0%) |
| No Fuel Used | 784 (89.1%) | 661 (97.2%) |
| Total | 880 (100.0%) | 680 (100.0%) |
Household Vehicle Usage in Hatillo
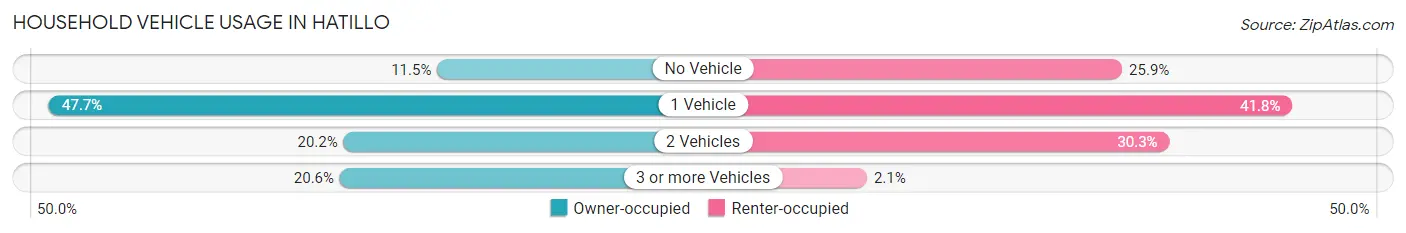
| Vehicles per Household | Owner-occupied | Renter-occupied |
| No Vehicle | 101 (11.5%) | 176 (25.9%) |
| 1 Vehicle | 420 (47.7%) | 284 (41.8%) |
| 2 Vehicles | 178 (20.2%) | 206 (30.3%) |
| 3 or more Vehicles | 181 (20.6%) | 14 (2.1%) |
| Total | 880 (100.0%) | 680 (100.0%) |
Real Estate & Mortgages in Hatillo
Real Estate and Mortgage Overview in Hatillo
| Characteristic | Without Mortgage | With Mortgage |
| Housing Units | 629 | 251 |
| Median Property Value | $131,300 | $105,300 |
| Median Household Income | $22,276 | $0 |
| Monthly Housing Costs | $148 | $0 |
| Real Estate Taxes | - | - |
Property Value by Mortgage Status in Hatillo
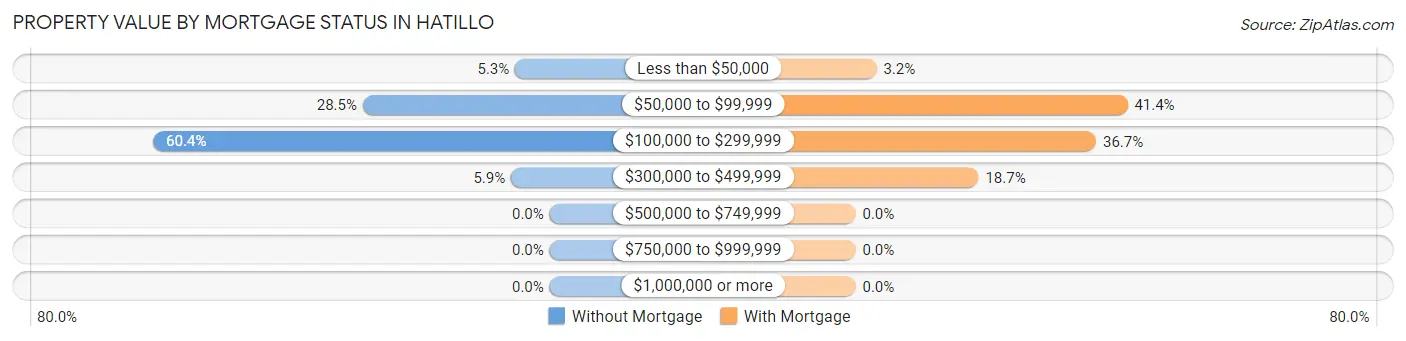
| Property Value | Without Mortgage | With Mortgage |
| Less than $50,000 | 33 (5.2%) | 8 (3.2%) |
| $50,000 to $99,999 | 179 (28.5%) | 104 (41.4%) |
| $100,000 to $299,999 | 380 (60.4%) | 92 (36.6%) |
| $300,000 to $499,999 | 37 (5.9%) | 47 (18.7%) |
| $500,000 to $749,999 | 0 (0.0%) | 0 (0.0%) |
| $750,000 to $999,999 | 0 (0.0%) | 0 (0.0%) |
| $1,000,000 or more | 0 (0.0%) | 0 (0.0%) |
| Total | 629 (100.0%) | 251 (100.0%) |
Household Income by Mortgage Status in Hatillo
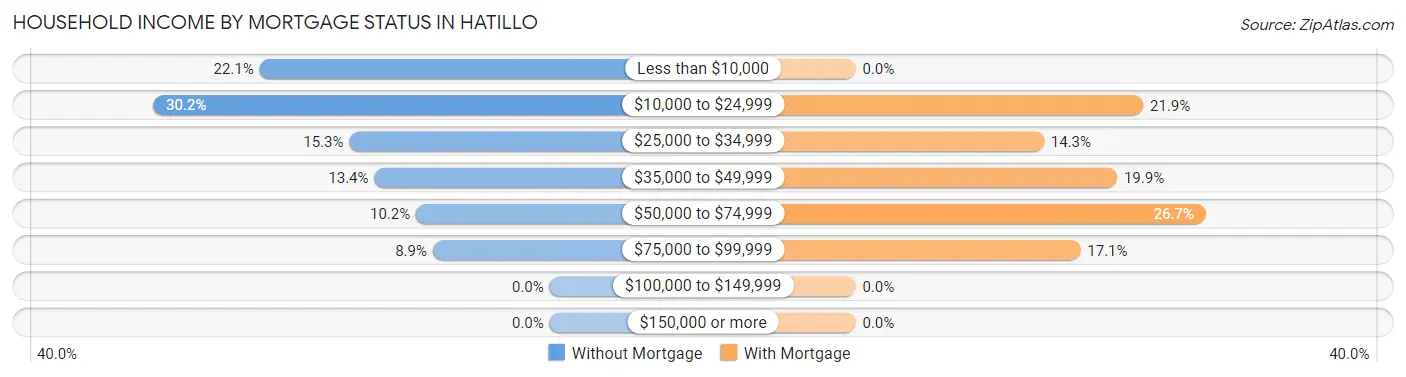
| Household Income | Without Mortgage | With Mortgage |
| Less than $10,000 | 139 (22.1%) | 0 (0.0%) |
| $10,000 to $24,999 | 190 (30.2%) | 55 (21.9%) |
| $25,000 to $34,999 | 96 (15.3%) | 36 (14.3%) |
| $35,000 to $49,999 | 84 (13.4%) | 50 (19.9%) |
| $50,000 to $74,999 | 64 (10.2%) | 67 (26.7%) |
| $75,000 to $99,999 | 56 (8.9%) | 43 (17.1%) |
| $100,000 to $149,999 | 0 (0.0%) | 0 (0.0%) |
| $150,000 or more | 0 (0.0%) | 0 (0.0%) |
| Total | 629 (100.0%) | 251 (100.0%) |
Property Value to Household Income Ratio in Hatillo
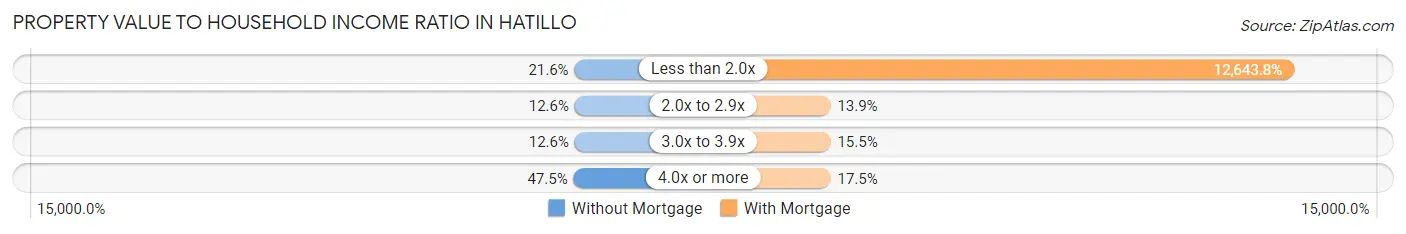
| Value-to-Income Ratio | Without Mortgage | With Mortgage |
| Less than 2.0x | 136 (21.6%) | 31,736 (12,643.8%) |
| 2.0x to 2.9x | 79 (12.6%) | 35 (13.9%) |
| 3.0x to 3.9x | 79 (12.6%) | 39 (15.5%) |
| 4.0x or more | 299 (47.5%) | 44 (17.5%) |
| Total | 629 (100.0%) | 251 (100.0%) |
Real Estate Taxes by Mortgage Status in Hatillo
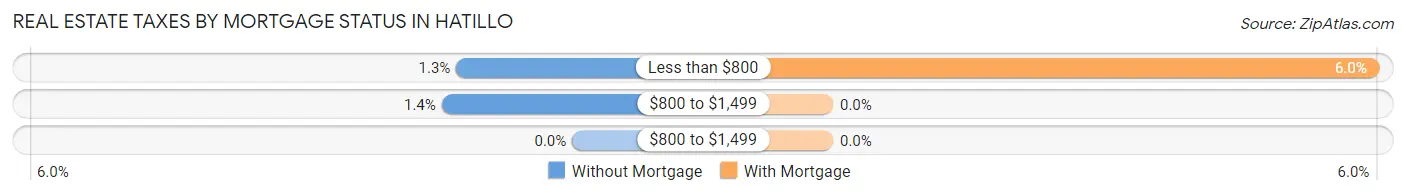
| Property Taxes | Without Mortgage | With Mortgage |
| Less than $800 | 8 (1.3%) | 15 (6.0%) |
| $800 to $1,499 | 9 (1.4%) | 0 (0.0%) |
| $800 to $1,499 | 0 (0.0%) | 0 (0.0%) |
| Total | 629 (100.0%) | 251 (100.0%) |
Health & Disability in Hatillo
Health Insurance Coverage by Age in Hatillo
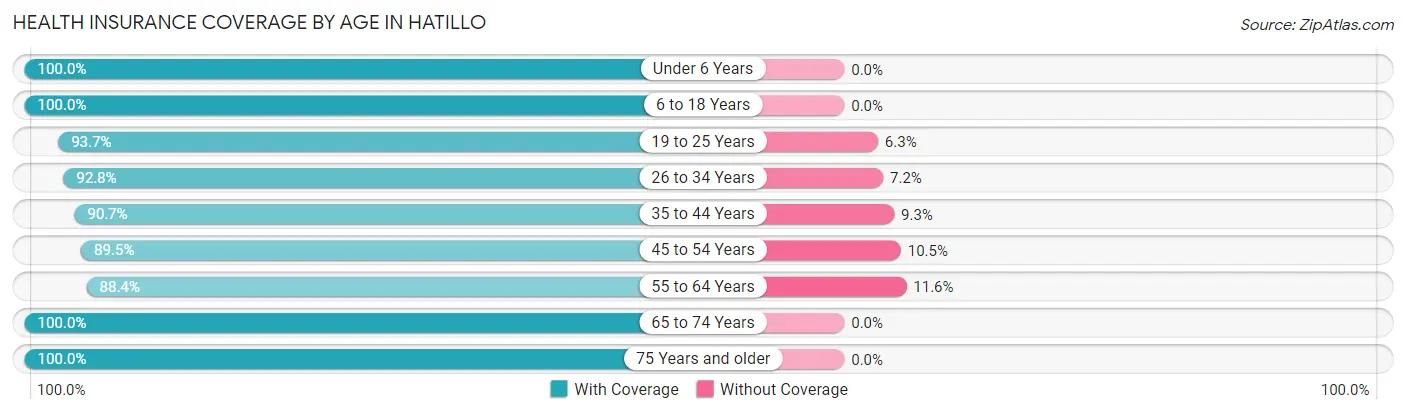
| Age Bracket | With Coverage | Without Coverage |
| Under 6 Years | 161 (100.0%) | 0 (0.0%) |
| 6 to 18 Years | 343 (100.0%) | 0 (0.0%) |
| 19 to 25 Years | 329 (93.7%) | 22 (6.3%) |
| 26 to 34 Years | 590 (92.8%) | 46 (7.2%) |
| 35 to 44 Years | 381 (90.7%) | 39 (9.3%) |
| 45 to 54 Years | 365 (89.5%) | 43 (10.5%) |
| 55 to 64 Years | 703 (88.4%) | 92 (11.6%) |
| 65 to 74 Years | 505 (100.0%) | 0 (0.0%) |
| 75 Years and older | 430 (100.0%) | 0 (0.0%) |
| Total | 3,807 (94.0%) | 242 (6.0%) |
Health Insurance Coverage by Citizenship Status in Hatillo
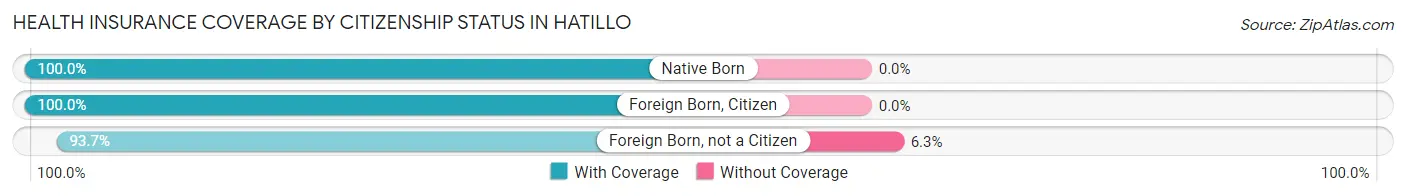
| Citizenship Status | With Coverage | Without Coverage |
| Native Born | 161 (100.0%) | 0 (0.0%) |
| Foreign Born, Citizen | 343 (100.0%) | 0 (0.0%) |
| Foreign Born, not a Citizen | 329 (93.7%) | 22 (6.3%) |
Health Insurance Coverage by Household Income in Hatillo
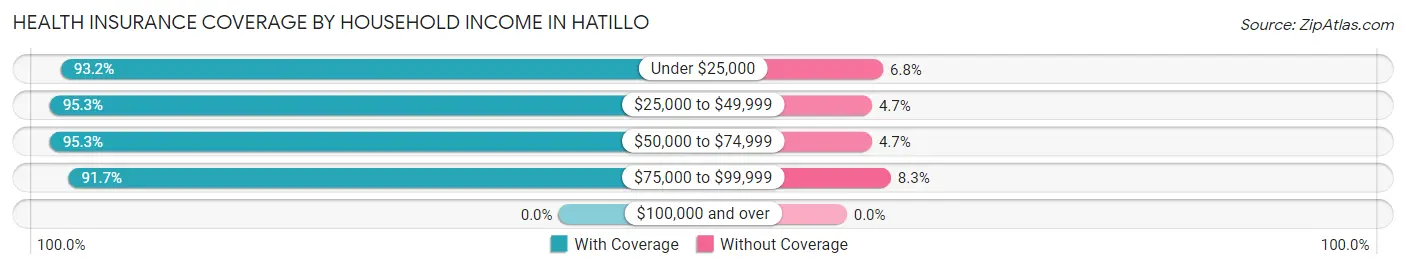
| Household Income | With Coverage | Without Coverage |
| Under $25,000 | 1,932 (93.2%) | 141 (6.8%) |
| $25,000 to $49,999 | 1,174 (95.3%) | 58 (4.7%) |
| $50,000 to $74,999 | 486 (95.3%) | 24 (4.7%) |
| $75,000 to $99,999 | 211 (91.7%) | 19 (8.3%) |
| $100,000 and over | 0 (0.0%) | 0 (0.0%) |
Public vs Private Health Insurance Coverage by Age in Hatillo
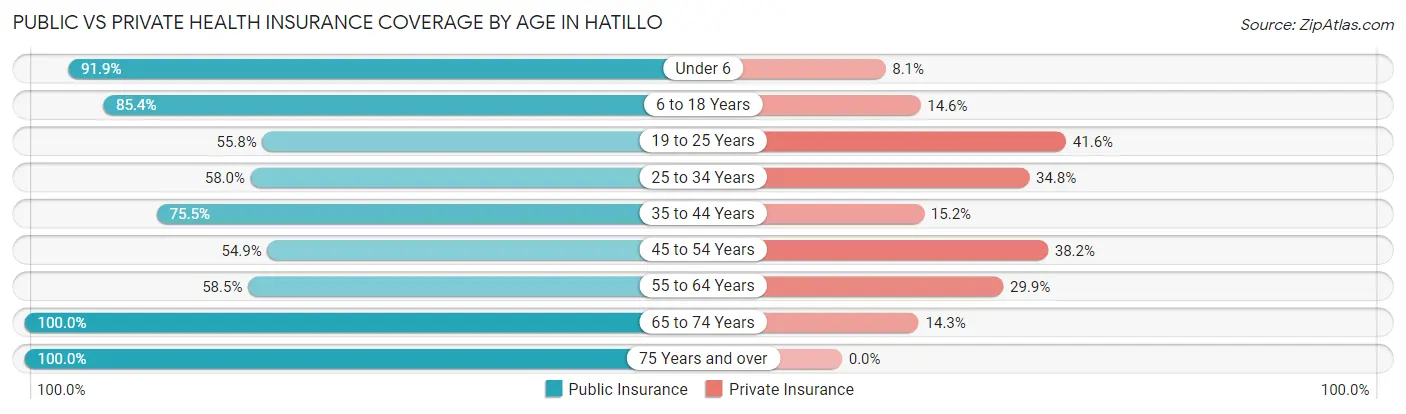
| Age Bracket | Public Insurance | Private Insurance |
| Under 6 | 148 (91.9%) | 13 (8.1%) |
| 6 to 18 Years | 293 (85.4%) | 50 (14.6%) |
| 19 to 25 Years | 196 (55.8%) | 146 (41.6%) |
| 25 to 34 Years | 369 (58.0%) | 221 (34.7%) |
| 35 to 44 Years | 317 (75.5%) | 64 (15.2%) |
| 45 to 54 Years | 224 (54.9%) | 156 (38.2%) |
| 55 to 64 Years | 465 (58.5%) | 238 (29.9%) |
| 65 to 74 Years | 505 (100.0%) | 72 (14.3%) |
| 75 Years and over | 430 (100.0%) | 0 (0.0%) |
| Total | 2,947 (72.8%) | 960 (23.7%) |
Disability Status by Sex by Age in Hatillo
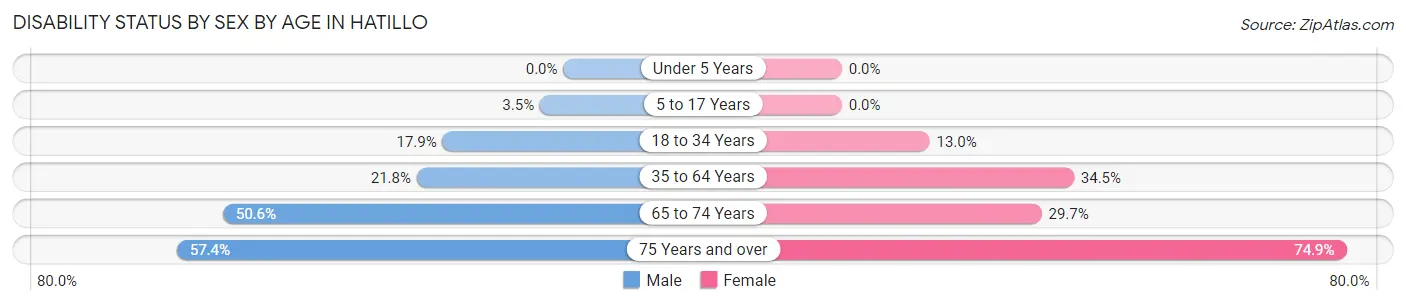
| Age Bracket | Male | Female |
| Under 5 Years | 0 (0.0%) | 0 (0.0%) |
| 5 to 17 Years | 7 (3.5%) | 0 (0.0%) |
| 18 to 34 Years | 73 (17.9%) | 77 (13.0%) |
| 35 to 64 Years | 148 (21.8%) | 325 (34.5%) |
| 65 to 74 Years | 90 (50.6%) | 97 (29.7%) |
| 75 Years and over | 66 (57.4%) | 236 (74.9%) |
Disability Class by Sex by Age in Hatillo
Disability Class: Hearing Difficulty
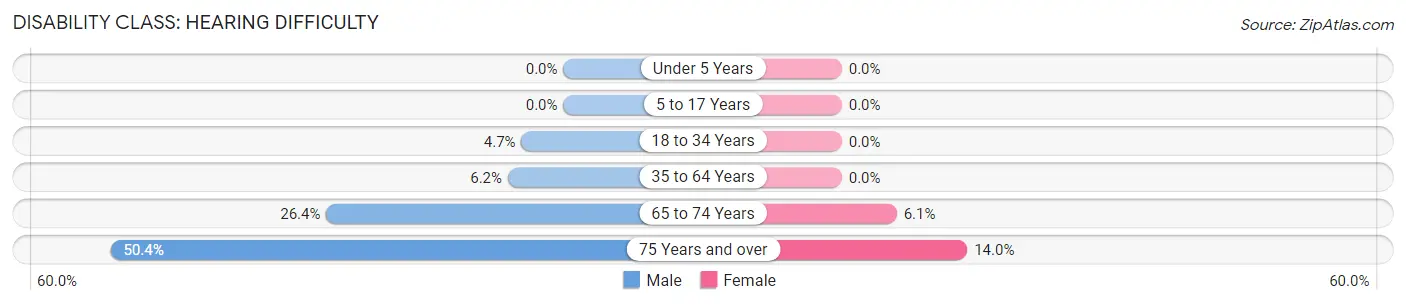
| Age Bracket | Male | Female |
| Under 5 Years | 0 (0.0%) | 0 (0.0%) |
| 5 to 17 Years | 0 (0.0%) | 0 (0.0%) |
| 18 to 34 Years | 19 (4.7%) | 0 (0.0%) |
| 35 to 64 Years | 42 (6.2%) | 0 (0.0%) |
| 65 to 74 Years | 47 (26.4%) | 20 (6.1%) |
| 75 Years and over | 58 (50.4%) | 44 (14.0%) |
Disability Class: Vision Difficulty
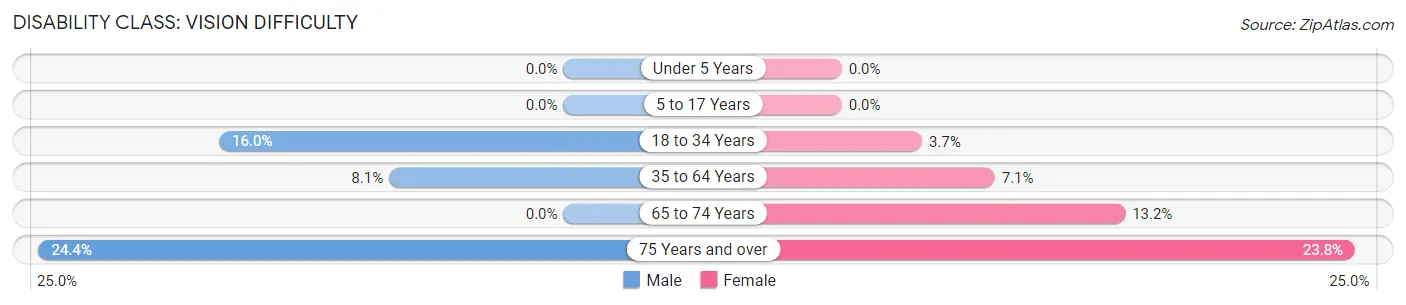
| Age Bracket | Male | Female |
| Under 5 Years | 0 (0.0%) | 0 (0.0%) |
| 5 to 17 Years | 0 (0.0%) | 0 (0.0%) |
| 18 to 34 Years | 65 (16.0%) | 22 (3.7%) |
| 35 to 64 Years | 55 (8.1%) | 67 (7.1%) |
| 65 to 74 Years | 0 (0.0%) | 43 (13.2%) |
| 75 Years and over | 28 (24.3%) | 75 (23.8%) |
Disability Class: Cognitive Difficulty
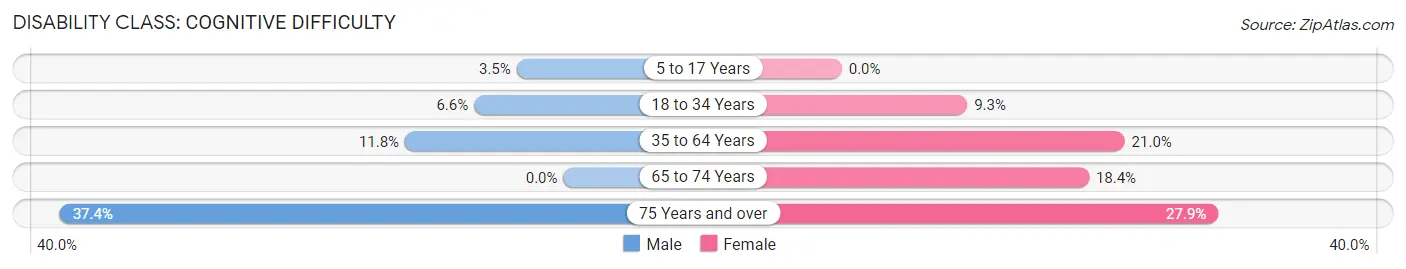
| Age Bracket | Male | Female |
| 5 to 17 Years | 7 (3.5%) | 0 (0.0%) |
| 18 to 34 Years | 27 (6.6%) | 55 (9.3%) |
| 35 to 64 Years | 80 (11.8%) | 198 (21.0%) |
| 65 to 74 Years | 0 (0.0%) | 60 (18.3%) |
| 75 Years and over | 43 (37.4%) | 88 (27.9%) |
Disability Class: Ambulatory Difficulty
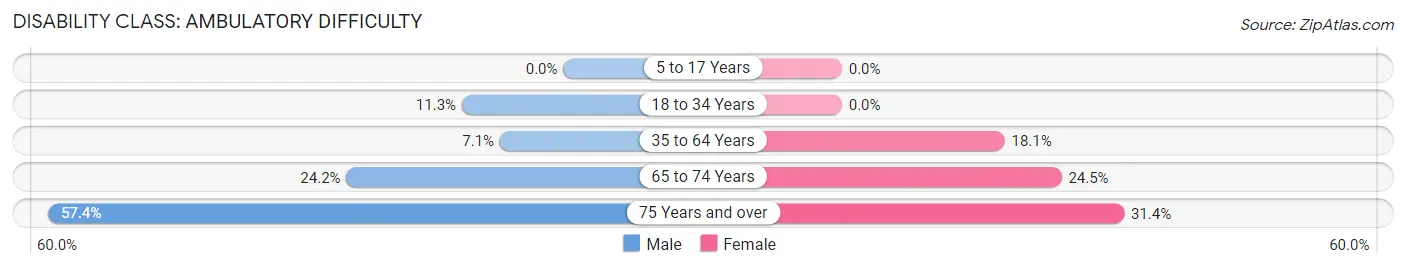
| Age Bracket | Male | Female |
| 5 to 17 Years | 0 (0.0%) | 0 (0.0%) |
| 18 to 34 Years | 46 (11.3%) | 0 (0.0%) |
| 35 to 64 Years | 48 (7.1%) | 171 (18.1%) |
| 65 to 74 Years | 43 (24.2%) | 80 (24.5%) |
| 75 Years and over | 66 (57.4%) | 99 (31.4%) |
Disability Class: Self-Care Difficulty
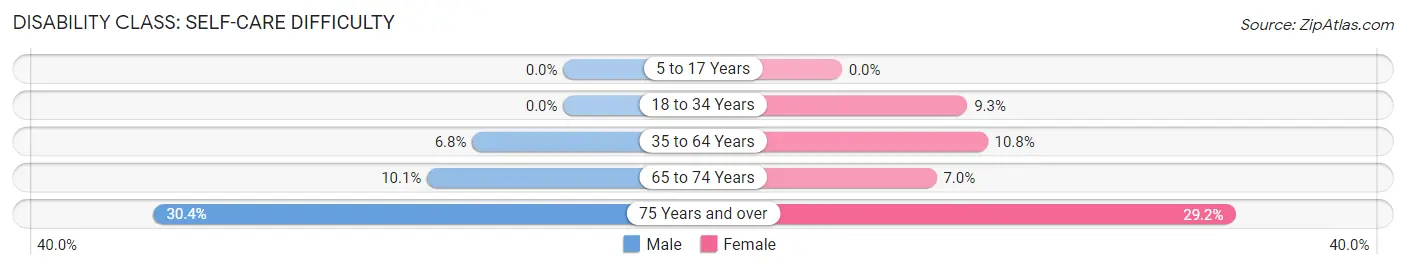
| Age Bracket | Male | Female |
| 5 to 17 Years | 0 (0.0%) | 0 (0.0%) |
| 18 to 34 Years | 0 (0.0%) | 55 (9.3%) |
| 35 to 64 Years | 46 (6.8%) | 102 (10.8%) |
| 65 to 74 Years | 18 (10.1%) | 23 (7.0%) |
| 75 Years and over | 35 (30.4%) | 92 (29.2%) |
Technology Access in Hatillo
Computing Device Access in Hatillo
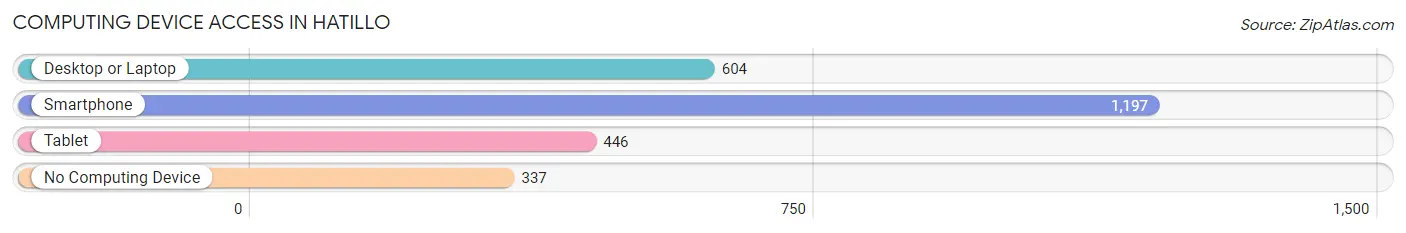
| Device Type | # Households | % Households |
| Desktop or Laptop | 604 | 38.7% |
| Smartphone | 1,197 | 76.7% |
| Tablet | 446 | 28.6% |
| No Computing Device | 337 | 21.6% |
| Total | 1,560 | 100.0% |
Internet Access in Hatillo
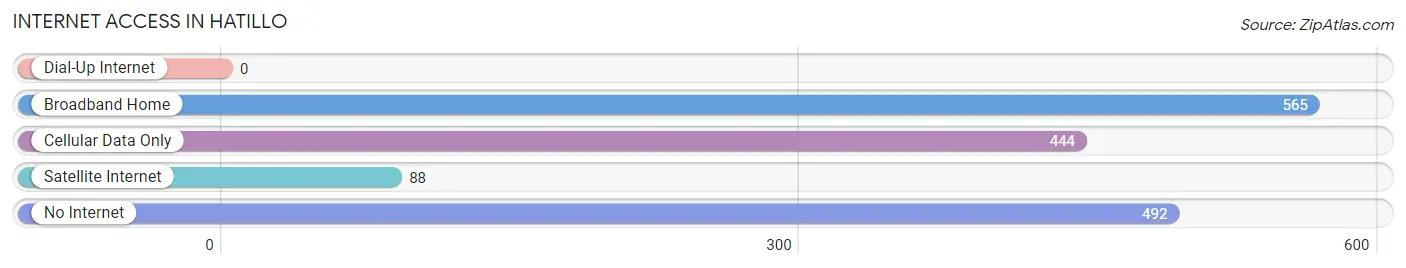
| Internet Type | # Households | % Households |
| Dial-Up Internet | 0 | 0.0% |
| Broadband Home | 565 | 36.2% |
| Cellular Data Only | 444 | 28.5% |
| Satellite Internet | 88 | 5.6% |
| No Internet | 492 | 31.5% |
| Total | 1,560 | 100.0% |
Hatillo Summary
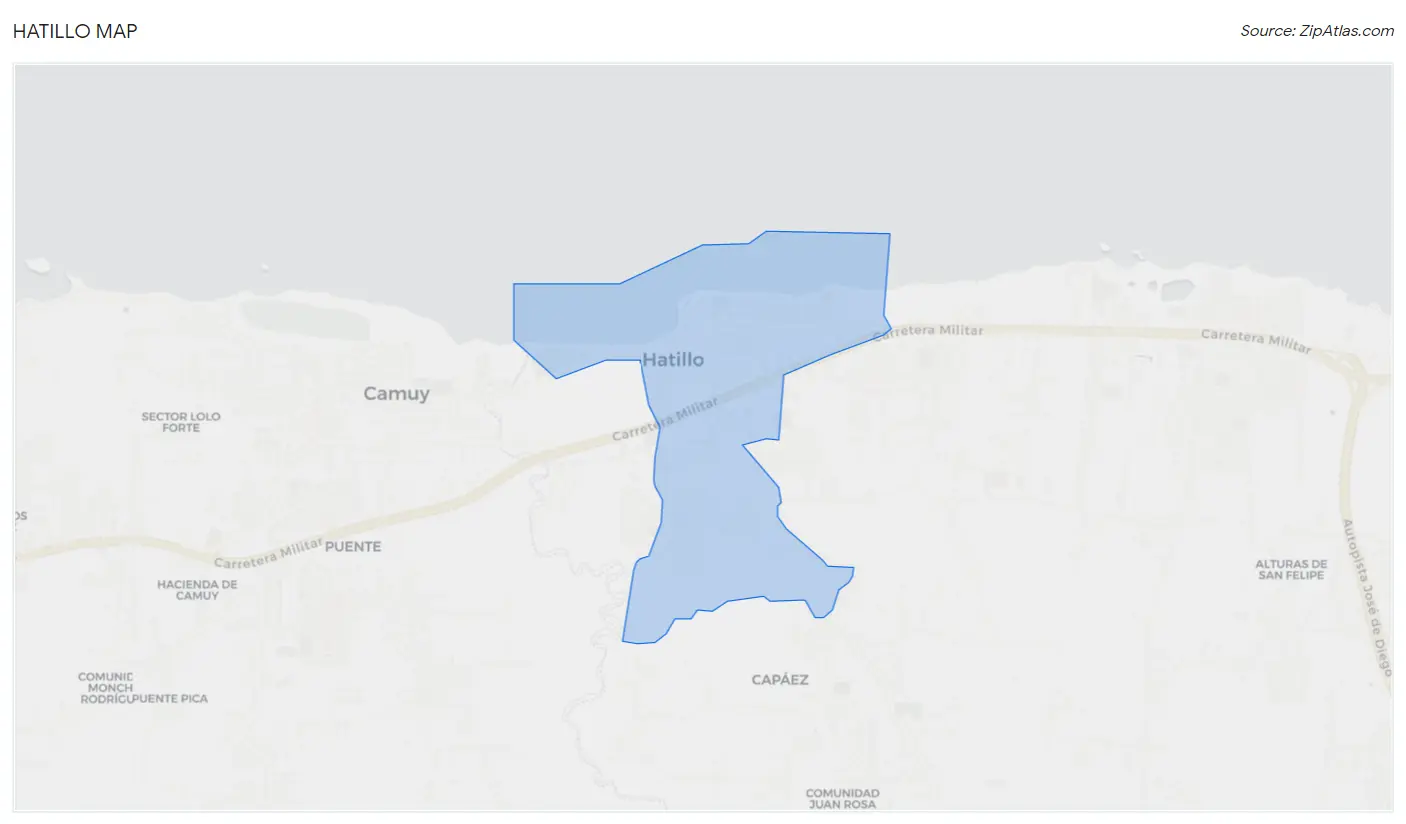
Hatillo is a municipality located in the northern coast of Puerto Rico, in the northern karst zone of the island. It is bordered by the municipalities of Arecibo, Camuy, Quebradillas, and Utuado. The municipality is spread over 8 wards and Hatillo Pueblo (the downtown area and the administrative center of the municipality). It has a total area of 39.9 square miles (103.3 km2). As of the 2010 US Census, the population of Hatillo was 17,109, which represents a decrease of 4.2% since the 2000 US Census.
History
The area of Hatillo was originally inhabited by the Taíno Indians. The first European settlers arrived in the area in the early 16th century. The area was part of the municipality of Arecibo until 1823, when it was established as an independent municipality. The name of the municipality comes from the Spanish word for “hat”, as the area was known for its production of hats.
Geography
Hatillo is located in the northern coast of Puerto Rico, in the northern karst zone of the island. It is bordered by the municipalities of Arecibo, Camuy, Quebradillas, and Utuado. The municipality is spread over 8 wards and Hatillo Pueblo (the downtown area and the administrative center of the municipality). It has a total area of 39.9 square miles (103.3 km2).
The terrain of Hatillo is mostly flat, with some hills in the western part of the municipality. The highest point is Cerro La Torrecilla, which has an elevation of 1,067 feet (325 m). The municipality is drained by several rivers, including the Grande de Hatillo, which is the main river in the municipality.
Climate
Hatillo has a tropical monsoon climate, with hot and humid summers and mild winters. The average temperature is 78°F (26°C), and the average annual precipitation is 64 inches (1,620 mm).
Economy
The economy of Hatillo is mainly based on agriculture and tourism. The main agricultural products are sugarcane, coffee, and fruits. The municipality is also home to several industrial parks, which are home to a variety of industries, including electronics, pharmaceuticals, and food processing.
Tourism is an important part of the economy of Hatillo. The municipality is home to several beaches, including Playa de Hatillo, Playa de Punta Salinas, and Playa de Punta Borinquen. The municipality also has several historical sites, including the ruins of the Spanish fort of San Antonio de la Tuna.
Demographics
As of the 2010 US Census, the population of Hatillo was 17,109, which represents a decrease of 4.2% since the 2000 US Census. The population is spread over 8 wards and Hatillo Pueblo (the downtown area and the administrative center of the municipality). The population is mostly of Hispanic origin (97.2%), with a small percentage of African descent (2.3%). The median household income is $14,945, and the poverty rate is 44.3%.
Common Questions
What is Per Capita Income in Hatillo?
Per Capita income in Hatillo is $11,171.
What is the Median Family Income in Hatillo?
Median Family Income in Hatillo is $24,044.
What is the Median Household income in Hatillo?
Median Household Income in Hatillo is $20,000.
What is Income or Wage Gap in Hatillo?
Income or Wage Gap in Hatillo is 3.6%.
Women in Hatillo earn 96.4 cents for every dollar earned by a man.
What is Family Income Deficit in Hatillo?
Family Income Deficit in Hatillo is $9,634.
Families that are below poverty line in Hatillo earn $9,634 less on average than the poverty threshold level.
What is Inequality or Gini Index in Hatillo?
Inequality or Gini Index in Hatillo is 0.45.
What is the Total Population of Hatillo?
Total Population of Hatillo is 4,049.
What is the Total Male Population of Hatillo?
Total Male Population of Hatillo is 1,630.
What is the Total Female Population of Hatillo?
Total Female Population of Hatillo is 2,419.
What is the Ratio of Males per 100 Females in Hatillo?
There are 67.38 Males per 100 Females in Hatillo.
What is the Ratio of Females per 100 Males in Hatillo?
There are 148.40 Females per 100 Males in Hatillo.
What is the Median Population Age in Hatillo?
Median Population Age in Hatillo is 46.8 Years.
What is the Average Family Size in Hatillo
Average Family Size in Hatillo is 3.5 People.
What is the Average Household Size in Hatillo
Average Household Size in Hatillo is 2.6 People.
How Large is the Labor Force in Hatillo?
There are 1,548 People in the Labor Forcein in Hatillo.
What is the Percentage of People in the Labor Force in Hatillo?
43.0% of People are in the Labor Force in Hatillo.
What is the Unemployment Rate in Hatillo?
Unemployment Rate in Hatillo is 17.0%.