San Jose, PR Map & Demographics
San Jose Overview
$8,113
PER CAPITA INCOME
$17,440
AVG FAMILY INCOME
$16,011
AVG HOUSEHOLD INCOME
0.9%
WAGE / INCOME GAP [ % ]
99.1¢/ $1
WAGE / INCOME GAP [ $ ]
0.45
INEQUALITY / GINI INDEX
2,153
TOTAL POPULATION
1,013
MALE POPULATION
1,140
FEMALE POPULATION
88.86
MALES / 100 FEMALES
112.54
FEMALES / 100 MALES
42.8
MEDIAN AGE
3.4
AVG FAMILY SIZE
2.7
AVG HOUSEHOLD SIZE
760
LABOR FORCE [ PEOPLE ]
40.9%
PERCENT IN LABOR FORCE
12.4%
UNEMPLOYMENT RATE
Income in San Jose
Income Overview in San Jose
Per Capita Income in San Jose is $8,113, while median incomes of families and households are $17,440 and $16,011 respectively.
| Characteristic | Number | Measure |
| Per Capita Income | 2,153 | $8,113 |
| Median Family Income | 465 | $17,440 |
| Mean Family Income | 465 | $20,225 |
| Median Household Income | 808 | $16,011 |
| Mean Household Income | 808 | $19,455 |
| Income Deficit | 465 | $0 |
| Wage / Income Gap (%) | 2,153 | 0.90% |
| Wage / Income Gap ($) | 2,153 | 99.10¢ per $1 |
| Gini / Inequality Index | 2,153 | 0.45 |
Earnings by Sex in San Jose
Average Earnings in San Jose are $15,531, $15,471 for men and $15,611 for women, a difference of 0.9%.
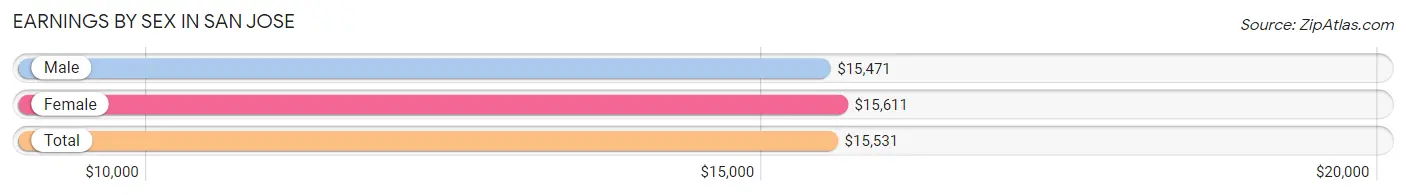
| Sex | Number | Average Earnings |
| Male | 389 (52.2%) | $15,471 |
| Female | 356 (47.8%) | $15,611 |
| Total | 745 (100.0%) | $15,531 |
Earnings by Sex by Income Bracket in San Jose
The most common earnings brackets in San Jose are $12,500 to $14,999 for men (71 | 18.2%) and $2,499 or less for women (51 | 14.3%).
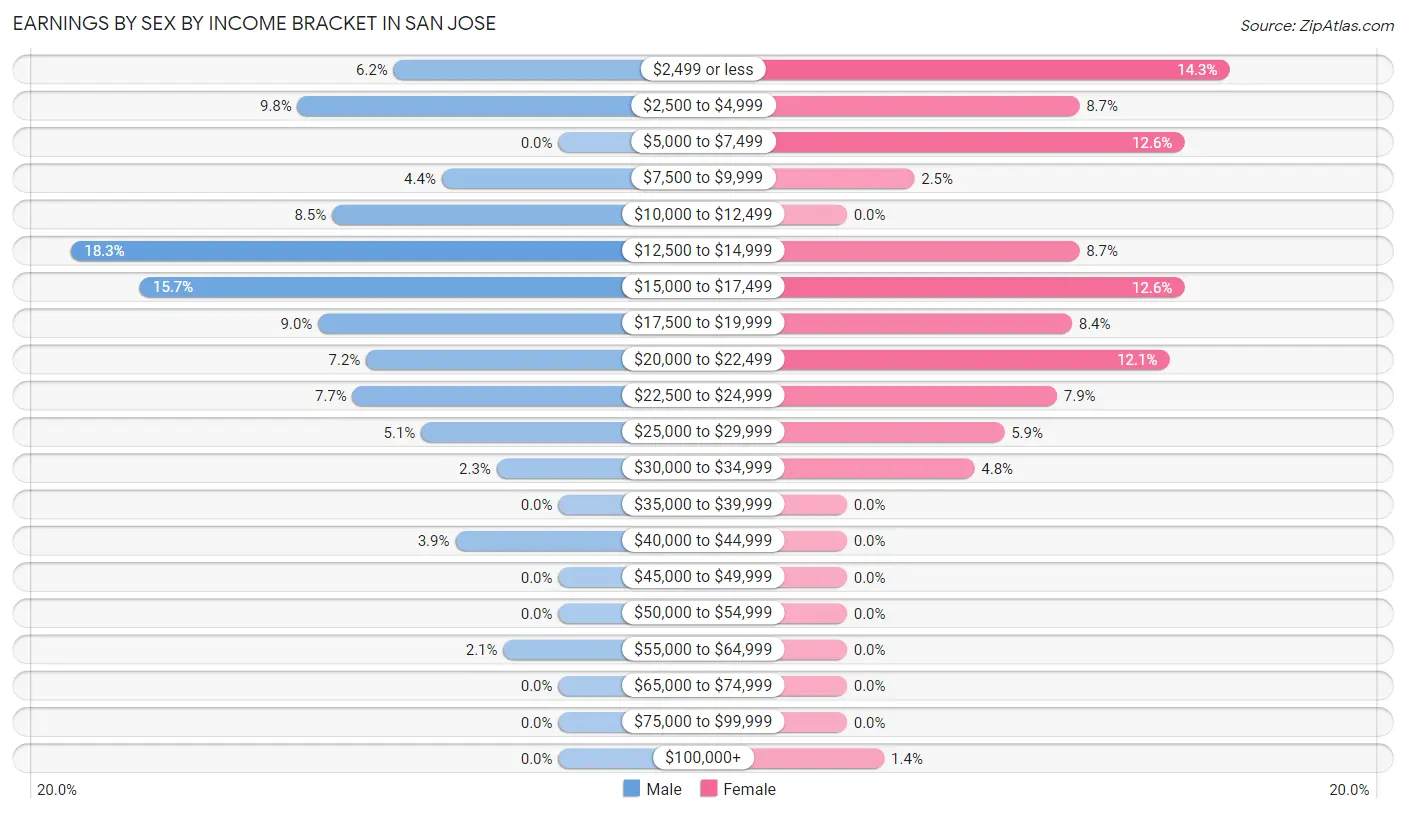
| Income | Male | Female |
| $2,499 or less | 24 (6.2%) | 51 (14.3%) |
| $2,500 to $4,999 | 38 (9.8%) | 31 (8.7%) |
| $5,000 to $7,499 | 0 (0.0%) | 45 (12.6%) |
| $7,500 to $9,999 | 17 (4.4%) | 9 (2.5%) |
| $10,000 to $12,499 | 33 (8.5%) | 0 (0.0%) |
| $12,500 to $14,999 | 71 (18.2%) | 31 (8.7%) |
| $15,000 to $17,499 | 61 (15.7%) | 45 (12.6%) |
| $17,500 to $19,999 | 35 (9.0%) | 30 (8.4%) |
| $20,000 to $22,499 | 28 (7.2%) | 43 (12.1%) |
| $22,500 to $24,999 | 30 (7.7%) | 28 (7.9%) |
| $25,000 to $29,999 | 20 (5.1%) | 21 (5.9%) |
| $30,000 to $34,999 | 9 (2.3%) | 17 (4.8%) |
| $35,000 to $39,999 | 0 (0.0%) | 0 (0.0%) |
| $40,000 to $44,999 | 15 (3.9%) | 0 (0.0%) |
| $45,000 to $49,999 | 0 (0.0%) | 0 (0.0%) |
| $50,000 to $54,999 | 0 (0.0%) | 0 (0.0%) |
| $55,000 to $64,999 | 8 (2.1%) | 0 (0.0%) |
| $65,000 to $74,999 | 0 (0.0%) | 0 (0.0%) |
| $75,000 to $99,999 | 0 (0.0%) | 0 (0.0%) |
| $100,000+ | 0 (0.0%) | 5 (1.4%) |
| Total | 389 (100.0%) | 356 (100.0%) |
Earnings by Sex by Educational Attainment in San Jose
Average earnings in San Jose are $16,885 for men and $16,000 for women, a difference of 5.2%. Men with an educational attainment of less than high school enjoy the highest average annual earnings of $18,971, while those with high school diploma education earn the least with $14,750. Women with an educational attainment of bachelor's degree earn the most with the average annual earnings of $18,542, while those with high school diploma education have the smallest earnings of $11,250.
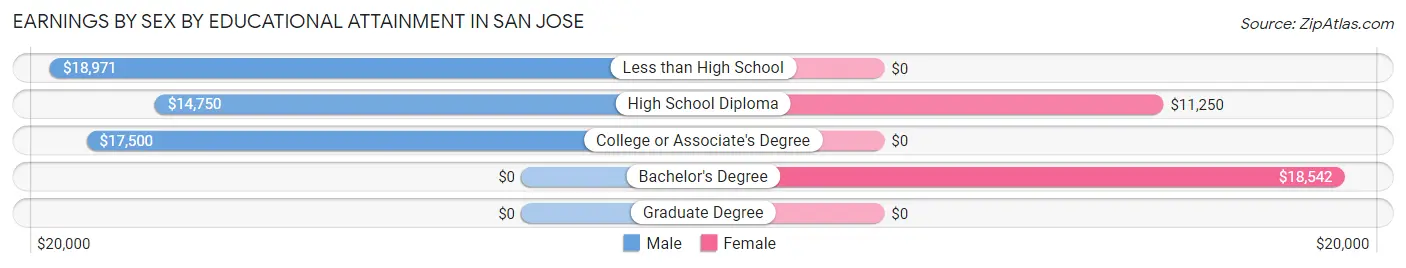
| Educational Attainment | Male Income | Female Income |
| Less than High School | $18,971 | $0 |
| High School Diploma | $14,750 | $11,250 |
| College or Associate's Degree | $17,500 | $0 |
| Bachelor's Degree | - | - |
| Graduate Degree | - | - |
| Total | $16,885 | $16,000 |
Family Income in San Jose
Family Income Brackets in San Jose
According to the San Jose family income data, there are 163 families falling into the less than $10,000 income range, which is the most common income bracket and makes up 35.0% of all families.
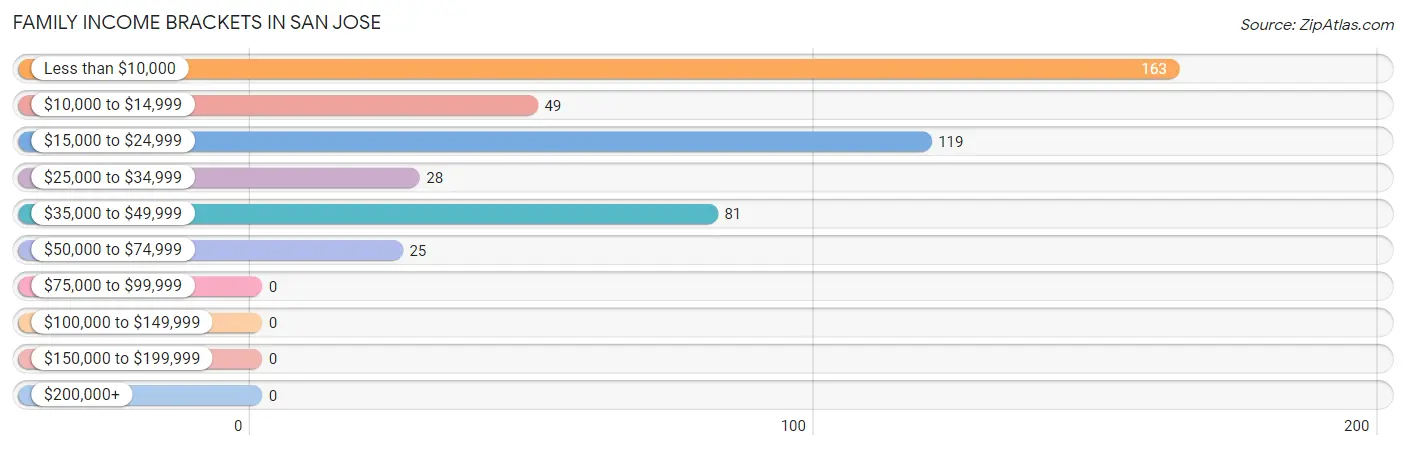
| Income Bracket | # Families | % Families |
| Less than $10,000 | 163 | 35.1% |
| $10,000 to $14,999 | 49 | 10.5% |
| $15,000 to $24,999 | 119 | 25.6% |
| $25,000 to $34,999 | 28 | 6.0% |
| $35,000 to $49,999 | 81 | 17.4% |
| $50,000 to $74,999 | 25 | 5.4% |
| $75,000 to $99,999 | 0 | 0.0% |
| $100,000 to $149,999 | 0 | 0.0% |
| $150,000 to $199,999 | 0 | 0.0% |
| $200,000+ | 0 | 0.0% |
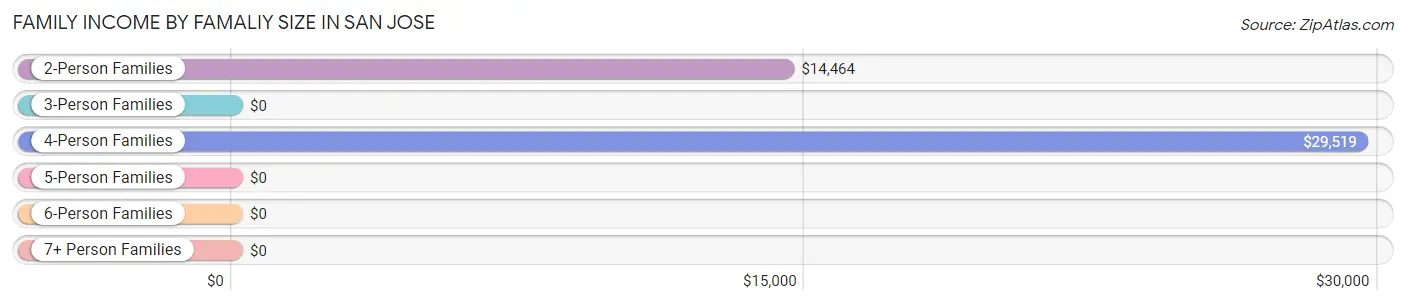
Family Income by Famaliy Size in San Jose
4-person families (63 | 13.6%) account for the highest median family income in San Jose with $29,519 per family, while 4-person families (63 | 13.6%) have the highest median income of $7,380 per family member.
| Income Bracket | # Families | Median Income |
| 2-Person Families | 245 (52.7%) | $14,464 |
| 3-Person Families | 101 (21.7%) | $0 |
| 4-Person Families | 63 (13.6%) | $29,519 |
| 5-Person Families | 39 (8.4%) | $0 |
| 6-Person Families | 0 (0.0%) | $0 |
| 7+ Person Families | 17 (3.7%) | $0 |
| Total | 465 (100.0%) | $17,440 |
Family Income by Number of Earners in San Jose
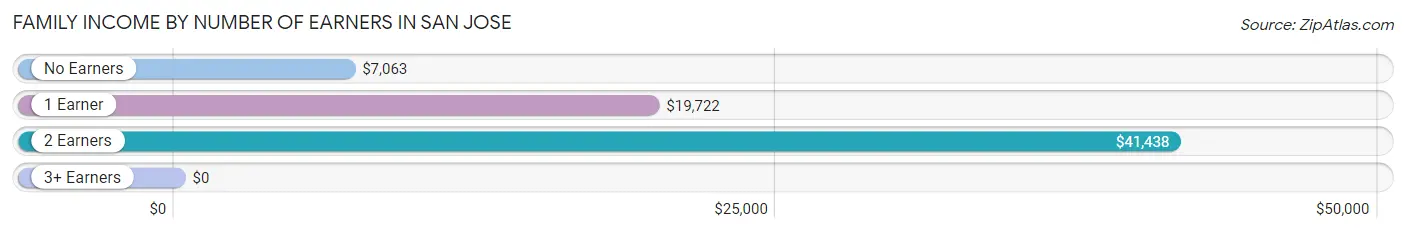
| Number of Earners | # Families | Median Income |
| No Earners | 196 (42.1%) | $7,063 |
| 1 Earner | 152 (32.7%) | $19,722 |
| 2 Earners | 103 (22.2%) | $41,438 |
| 3+ Earners | 14 (3.0%) | $0 |
| Total | 465 (100.0%) | $17,440 |
Household Income in San Jose
Household Income Brackets in San Jose
With 279 households falling in the category, the less than $10,000 income range is the most frequent in San Jose, accounting for 34.5% of all households.
| Income Bracket | # Households | % Households |
| Less than $10,000 | 279 | 34.5% |
| $10,000 to $14,999 | 106 | 13.1% |
| $15,000 to $24,999 | 194 | 24.0% |
| $25,000 to $34,999 | 91 | 11.3% |
| $35,000 to $49,999 | 108 | 13.4% |
| $50,000 to $74,999 | 25 | 3.1% |
| $75,000 to $99,999 | 0 | 0.0% |
| $100,000 to $149,999 | 5 | 0.6% |
| $150,000 to $199,999 | 0 | 0.0% |
| $200,000+ | 0 | 0.0% |
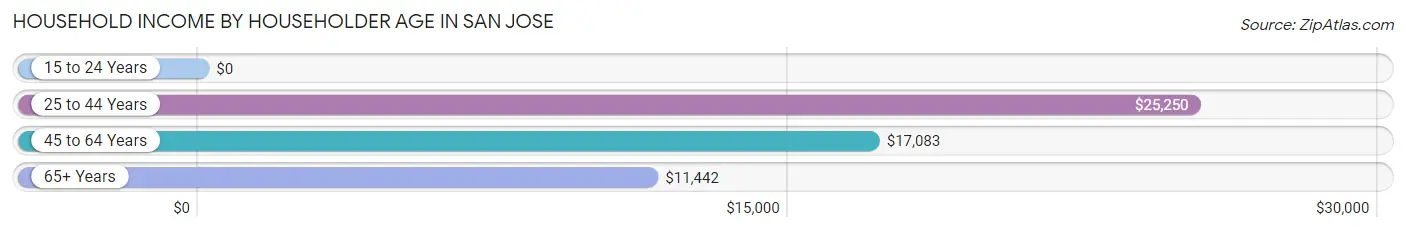
Household Income by Householder Age in San Jose
The median household income in San Jose is $16,011, with the highest median household income of $25,250 found in the 25 to 44 years age bracket for the primary householder. A total of 156 households (19.3%) fall into this category. Meanwhile, the 15 to 24 years age bracket for the primary householder has the lowest median household income of $0, with 16 households (2.0%) in this group.
| Income Bracket | # Households | Median Income |
| 15 to 24 Years | 16 (2.0%) | $0 |
| 25 to 44 Years | 156 (19.3%) | $25,250 |
| 45 to 64 Years | 385 (47.6%) | $17,083 |
| 65+ Years | 251 (31.1%) | $11,442 |
| Total | 808 (100.0%) | $16,011 |
Poverty in San Jose
Income Below Poverty by Sex and Age in San Jose
With 70.7% poverty level for males and 71.7% for females among the residents of San Jose, under 5 year old males and 5 year old females are the most vulnerable to poverty, with 41 males (100.0%) and 7 females (100.0%) in their respective age groups living below the poverty level.
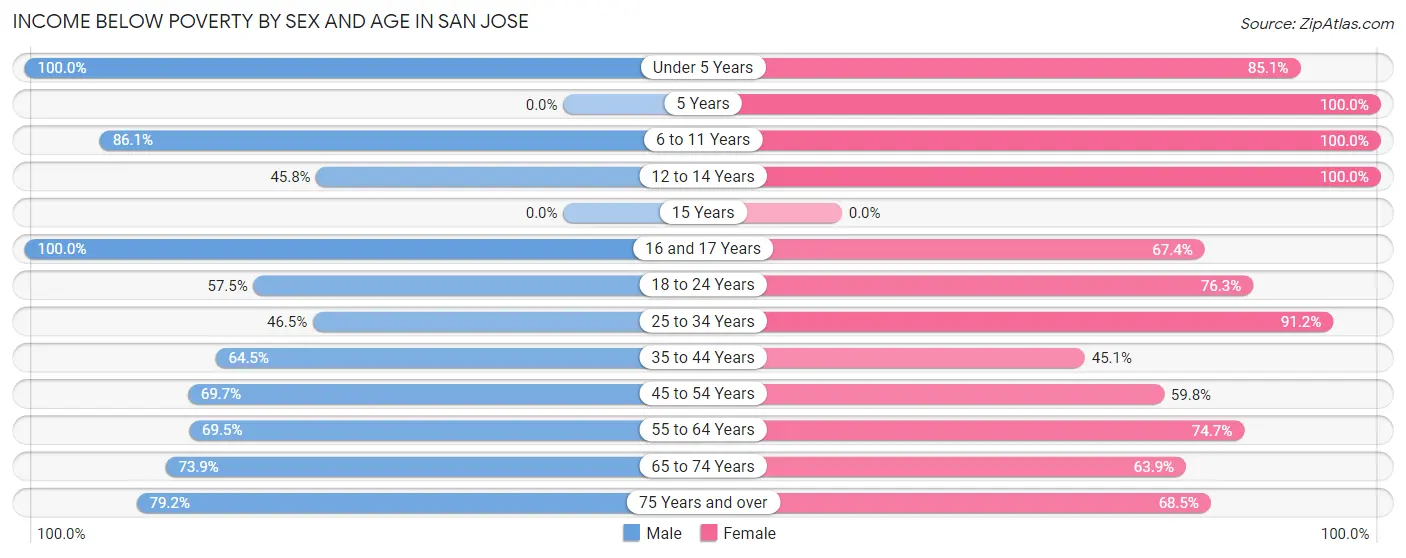
| Age Bracket | Male | Female |
| Under 5 Years | 41 (100.0%) | 57 (85.1%) |
| 5 Years | 0 (0.0%) | 7 (100.0%) |
| 6 to 11 Years | 74 (86.1%) | 32 (100.0%) |
| 12 to 14 Years | 11 (45.8%) | 11 (100.0%) |
| 15 Years | 0 (0.0%) | 0 (0.0%) |
| 16 and 17 Years | 55 (100.0%) | 33 (67.3%) |
| 18 to 24 Years | 46 (57.5%) | 71 (76.3%) |
| 25 to 34 Years | 46 (46.5%) | 155 (91.2%) |
| 35 to 44 Years | 91 (64.5%) | 69 (45.1%) |
| 45 to 54 Years | 69 (69.7%) | 58 (59.8%) |
| 55 to 64 Years | 116 (69.5%) | 162 (74.7%) |
| 65 to 74 Years | 96 (73.9%) | 76 (63.9%) |
| 75 Years and over | 61 (79.2%) | 76 (68.5%) |
| Total | 706 (70.7%) | 807 (71.7%) |
Income Above Poverty by Sex and Age in San Jose
According to the poverty statistics in San Jose, males aged 12 to 14 years and females aged 35 to 44 years are the age groups that are most secure financially, with 54.2% of males and 54.9% of females in these age groups living above the poverty line.
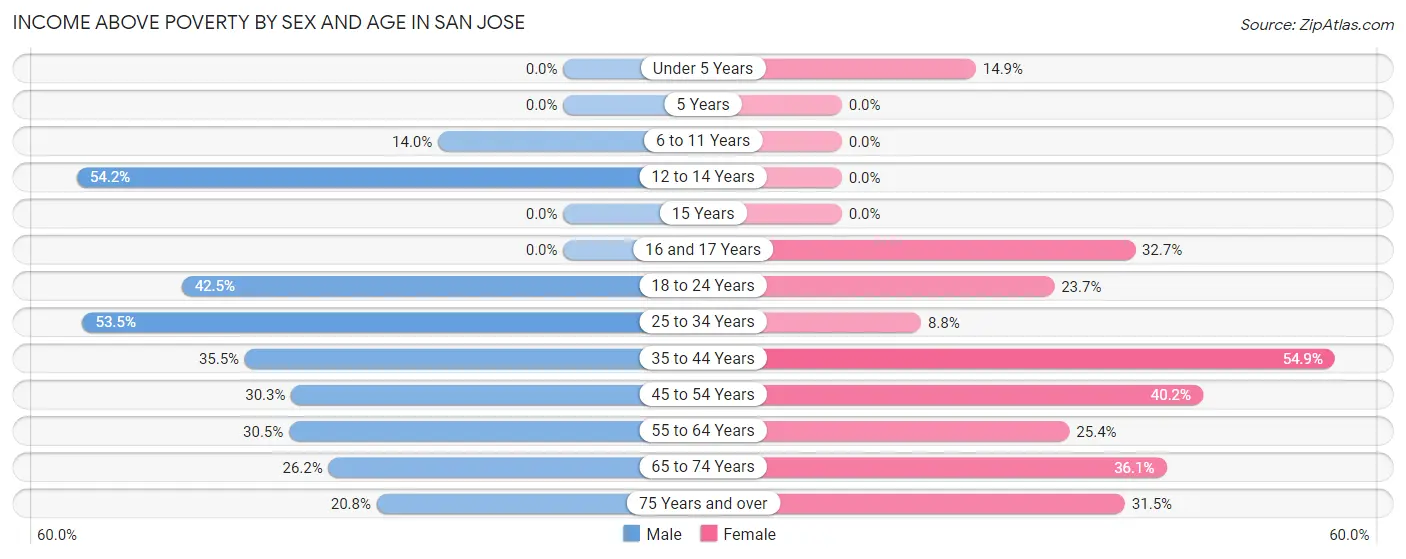
| Age Bracket | Male | Female |
| Under 5 Years | 0 (0.0%) | 10 (14.9%) |
| 5 Years | 0 (0.0%) | 0 (0.0%) |
| 6 to 11 Years | 12 (14.0%) | 0 (0.0%) |
| 12 to 14 Years | 13 (54.2%) | 0 (0.0%) |
| 15 Years | 0 (0.0%) | 0 (0.0%) |
| 16 and 17 Years | 0 (0.0%) | 16 (32.7%) |
| 18 to 24 Years | 34 (42.5%) | 22 (23.7%) |
| 25 to 34 Years | 53 (53.5%) | 15 (8.8%) |
| 35 to 44 Years | 50 (35.5%) | 84 (54.9%) |
| 45 to 54 Years | 30 (30.3%) | 39 (40.2%) |
| 55 to 64 Years | 51 (30.5%) | 55 (25.4%) |
| 65 to 74 Years | 34 (26.2%) | 43 (36.1%) |
| 75 Years and over | 16 (20.8%) | 35 (31.5%) |
| Total | 293 (29.3%) | 319 (28.3%) |
Income Below Poverty Among Married-Couple Families in San Jose
The poverty statistics for married-couple families in San Jose show that 53.8% or 119 of the total 221 families live below the poverty line. Families with 3 or 4 children have the highest poverty rate of 100.0%, comprising of 8 families. On the other hand, families with no children have the lowest poverty rate of 49.7%, which includes 77 families.
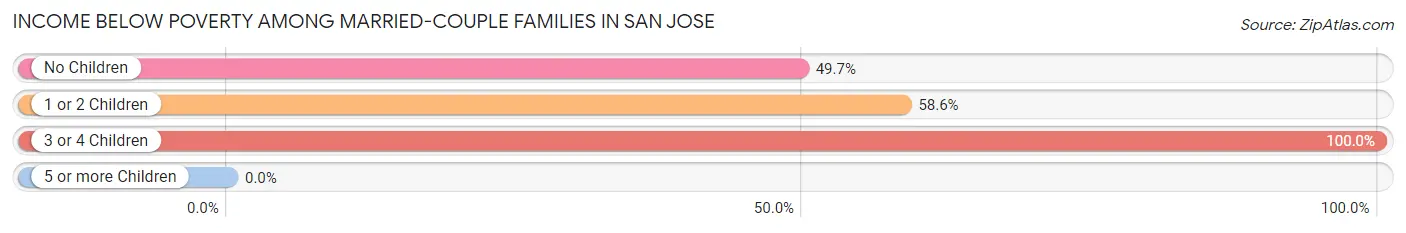
| Children | Above Poverty | Below Poverty |
| No Children | 78 (50.3%) | 77 (49.7%) |
| 1 or 2 Children | 24 (41.4%) | 34 (58.6%) |
| 3 or 4 Children | 0 (0.0%) | 8 (100.0%) |
| 5 or more Children | 0 (0.0%) | 0 (0.0%) |
| Total | 102 (46.2%) | 119 (53.8%) |
Income Below Poverty Among Single-Parent Households in San Jose
According to the poverty data in San Jose, 100.0% or 24 single-father households and 82.3% or 181 single-mother households are living below the poverty line. Among single-father households, those with no children have the highest poverty rate, with 24 households (100.0%) experiencing poverty. Likewise, among single-mother households, those with 3 or 4 children have the highest poverty rate, with 17 households (100.0%) falling below the poverty line.
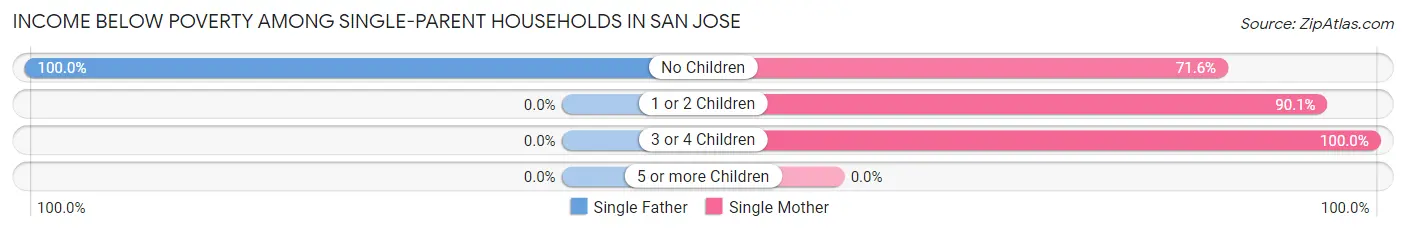
| Children | Single Father | Single Mother |
| No Children | 24 (100.0%) | 73 (71.6%) |
| 1 or 2 Children | 0 (0.0%) | 91 (90.1%) |
| 3 or 4 Children | 0 (0.0%) | 17 (100.0%) |
| 5 or more Children | 0 (0.0%) | 0 (0.0%) |
| Total | 24 (100.0%) | 181 (82.3%) |
Income Below Poverty Among Married-Couple vs Single-Parent Households in San Jose
The poverty data for San Jose shows that 119 of the married-couple family households (53.8%) and 205 of the single-parent households (84.0%) are living below the poverty level. Within the married-couple family households, those with 3 or 4 children have the highest poverty rate, with 8 households (100.0%) falling below the poverty line. Among the single-parent households, those with 3 or 4 children have the highest poverty rate, with 17 household (100.0%) living below poverty.
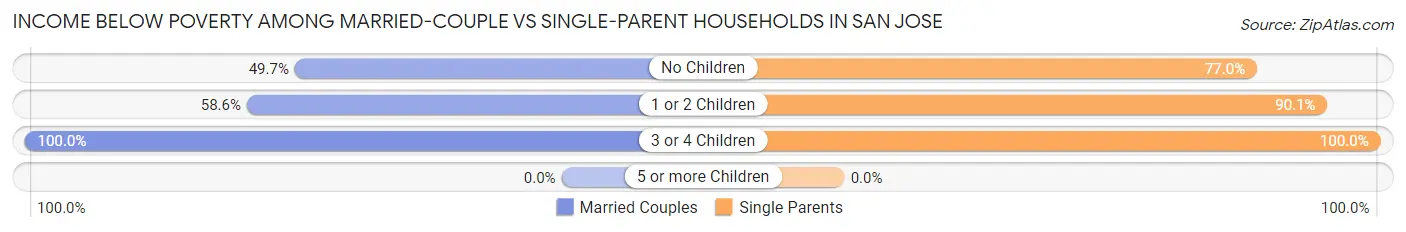
| Children | Married-Couple Families | Single-Parent Households |
| No Children | 77 (49.7%) | 97 (77.0%) |
| 1 or 2 Children | 34 (58.6%) | 91 (90.1%) |
| 3 or 4 Children | 8 (100.0%) | 17 (100.0%) |
| 5 or more Children | 0 (0.0%) | 0 (0.0%) |
| Total | 119 (53.8%) | 205 (84.0%) |
Race in San Jose
The most populous races in San Jose are Hispanic or Latino (2,139 | 99.4%), Some other Race (1,021 | 47.4%), and White / Caucasian (838 | 38.9%).
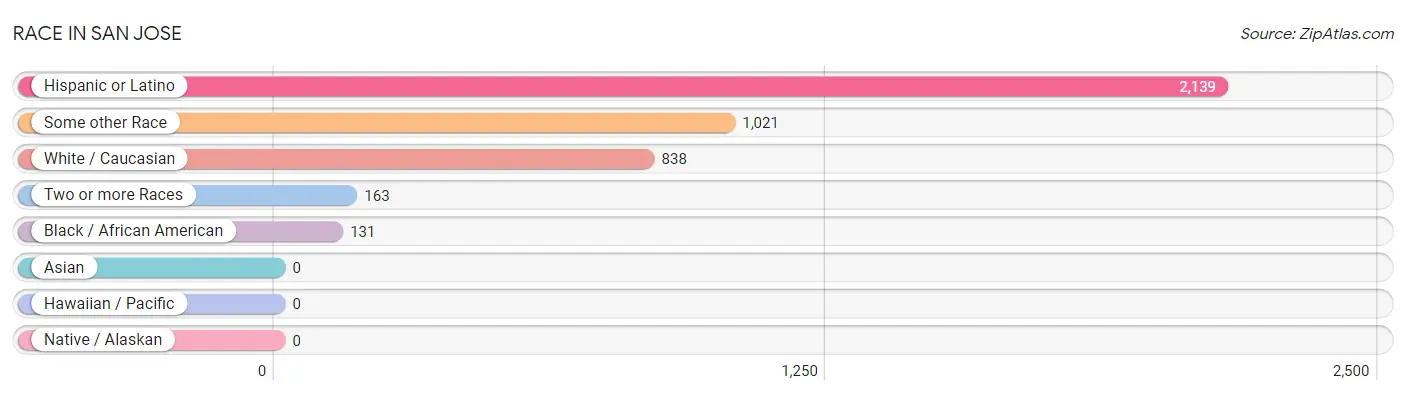
| Race | # Population | % Population |
| Asian | 0 | 0.0% |
| Black / African American | 131 | 6.1% |
| Hawaiian / Pacific | 0 | 0.0% |
| Hispanic or Latino | 2,139 | 99.4% |
| Native / Alaskan | 0 | 0.0% |
| White / Caucasian | 838 | 38.9% |
| Two or more Races | 163 | 7.6% |
| Some other Race | 1,021 | 47.4% |
| Total | 2,153 | 100.0% |
Ancestry in San Jose
The most populous ancestries reported in San Jose are Puerto Rican (2,114 | 98.2%), Dominican (10 | 0.5%), and Spaniard (5 | 0.2%), together accounting for 98.9% of all San Jose residents.
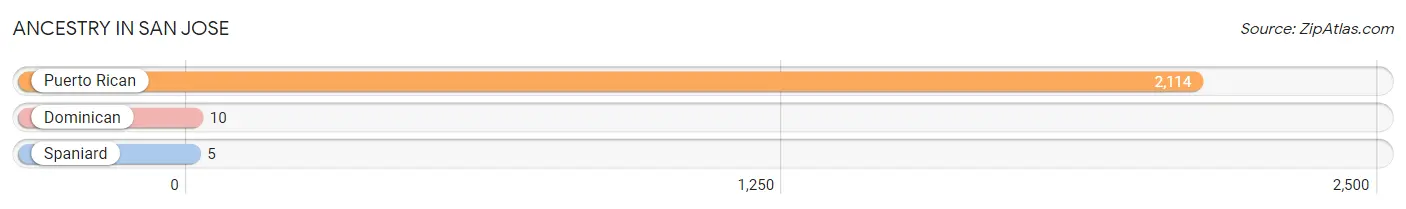
| Ancestry | # Population | % Population |
| Dominican | 10 | 0.5% |
| Puerto Rican | 2,114 | 98.2% |
| Spaniard | 5 | 0.2% | View All 3 Rows |
Immigrants in San Jose

| Immigration Origin | # Population | % Population | View All 0 Rows |
Sex and Age in San Jose
Sex and Age in San Jose
The most populous age groups in San Jose are 55 to 59 Years (121 | 11.9%) for men and 60 to 64 Years (136 | 11.9%) for women.
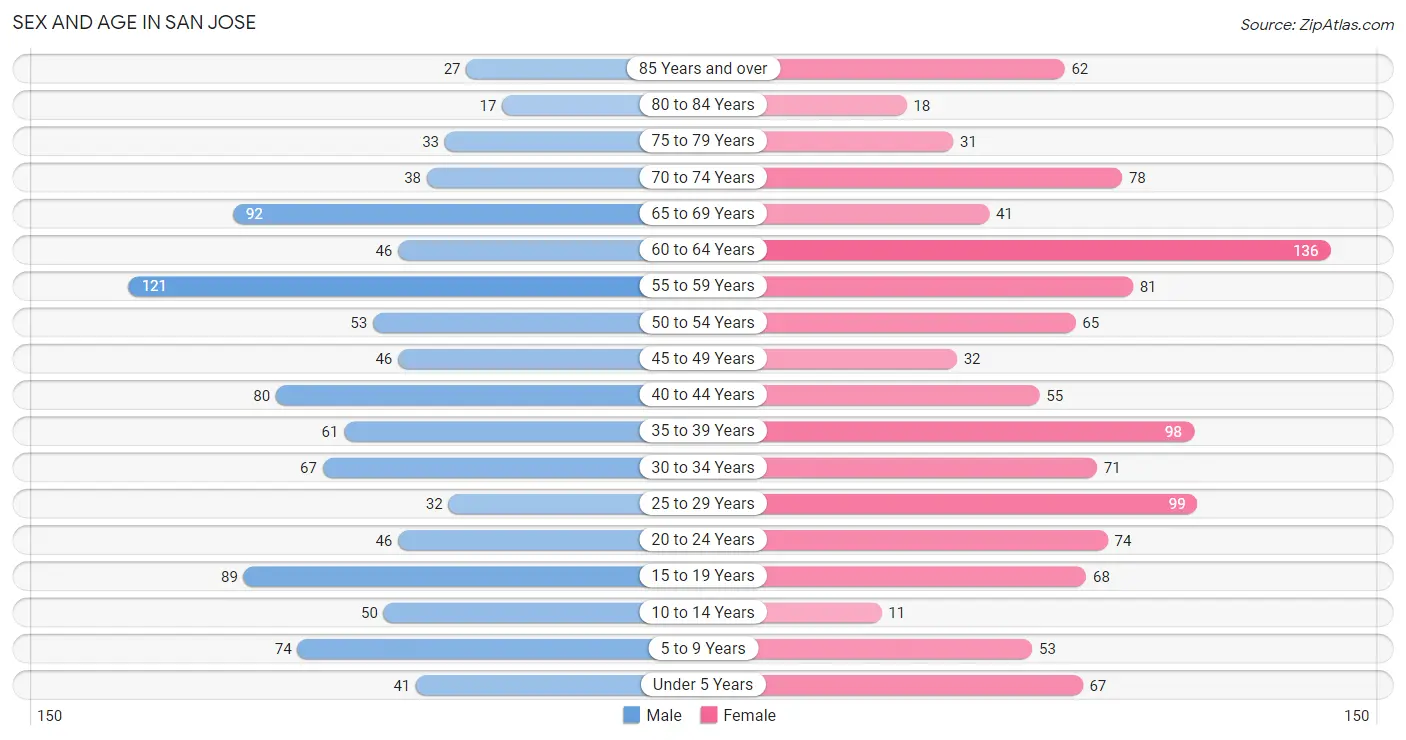
| Age Bracket | Male | Female |
| Under 5 Years | 41 (4.1%) | 67 (5.9%) |
| 5 to 9 Years | 74 (7.3%) | 53 (4.6%) |
| 10 to 14 Years | 50 (4.9%) | 11 (1.0%) |
| 15 to 19 Years | 89 (8.8%) | 68 (6.0%) |
| 20 to 24 Years | 46 (4.5%) | 74 (6.5%) |
| 25 to 29 Years | 32 (3.2%) | 99 (8.7%) |
| 30 to 34 Years | 67 (6.6%) | 71 (6.2%) |
| 35 to 39 Years | 61 (6.0%) | 98 (8.6%) |
| 40 to 44 Years | 80 (7.9%) | 55 (4.8%) |
| 45 to 49 Years | 46 (4.5%) | 32 (2.8%) |
| 50 to 54 Years | 53 (5.2%) | 65 (5.7%) |
| 55 to 59 Years | 121 (11.9%) | 81 (7.1%) |
| 60 to 64 Years | 46 (4.5%) | 136 (11.9%) |
| 65 to 69 Years | 92 (9.1%) | 41 (3.6%) |
| 70 to 74 Years | 38 (3.7%) | 78 (6.8%) |
| 75 to 79 Years | 33 (3.3%) | 31 (2.7%) |
| 80 to 84 Years | 17 (1.7%) | 18 (1.6%) |
| 85 Years and over | 27 (2.7%) | 62 (5.4%) |
| Total | 1,013 (100.0%) | 1,140 (100.0%) |
Families and Households in San Jose
Median Family Size in San Jose
The median family size in San Jose is 3.44 persons per family, with single female/mother families (220 | 47.3%) accounting for the largest median family size of 3.6 persons per family. On the other hand, married-couple families (221 | 47.5%) represent the smallest median family size with 3.29 persons per family.
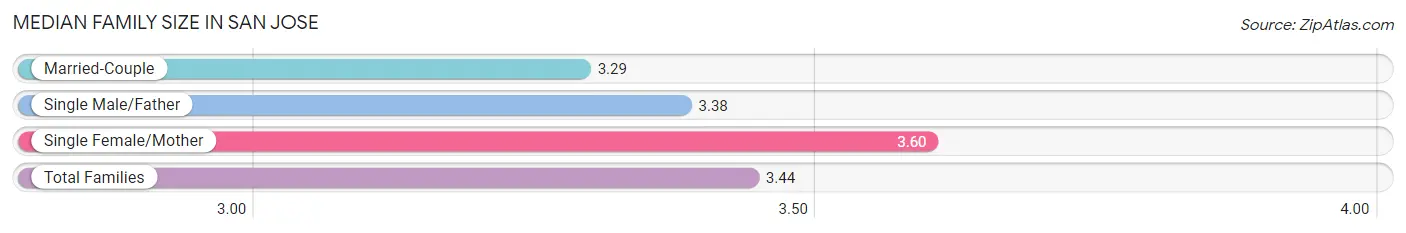
| Family Type | # Families | Family Size |
| Married-Couple | 221 (47.5%) | 3.29 |
| Single Male/Father | 24 (5.2%) | 3.38 |
| Single Female/Mother | 220 (47.3%) | 3.60 |
| Total Families | 465 (100.0%) | 3.44 |
Median Household Size in San Jose
The median household size in San Jose is 2.66 persons per household, with single male/father households (24 | 3.0%) accounting for the largest median household size of 3.96 persons per household. non-family households (343 | 42.4%) represent the smallest median household size with 1.36 persons per household.
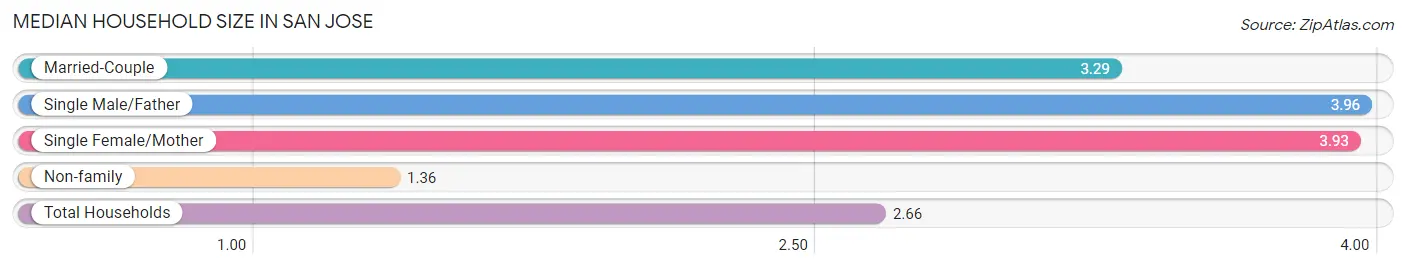
| Household Type | # Households | Household Size |
| Married-Couple | 221 (27.4%) | 3.29 |
| Single Male/Father | 24 (3.0%) | 3.96 |
| Single Female/Mother | 220 (27.2%) | 3.93 |
| Non-family | 343 (42.4%) | 1.36 |
| Total Households | 808 (100.0%) | 2.66 |
Household Size by Marriage Status in San Jose
Out of a total of 808 households in San Jose, 465 (57.6%) are family households, while 343 (42.4%) are nonfamily households. The most numerous type of family households are 2-person households, comprising 211, and the most common type of nonfamily households are 1-person households, comprising 257.
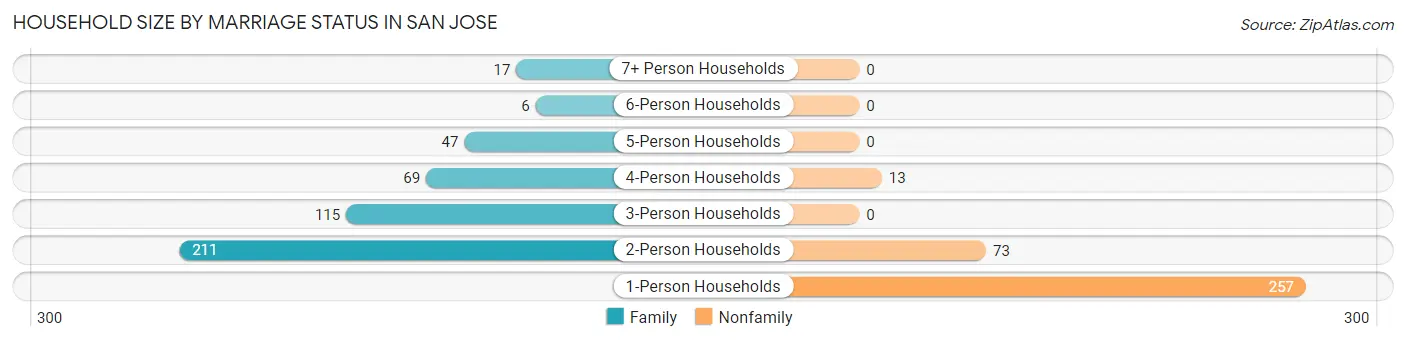
| Household Size | Family Households | Nonfamily Households |
| 1-Person Households | - | 257 (31.8%) |
| 2-Person Households | 211 (26.1%) | 73 (9.0%) |
| 3-Person Households | 115 (14.2%) | 0 (0.0%) |
| 4-Person Households | 69 (8.5%) | 13 (1.6%) |
| 5-Person Households | 47 (5.8%) | 0 (0.0%) |
| 6-Person Households | 6 (0.7%) | 0 (0.0%) |
| 7+ Person Households | 17 (2.1%) | 0 (0.0%) |
| Total | 465 (57.6%) | 343 (42.4%) |
Female Fertility in San Jose
Fertility by Age in San Jose
Average fertility rate in San Jose is 41.0 births per 1,000 women. Women in the age bracket of 20 to 34 years have the highest fertility rate with 86.0 births per 1,000 women. Women in the age bracket of 20 to 34 years acount for 100.0% of all women with births.
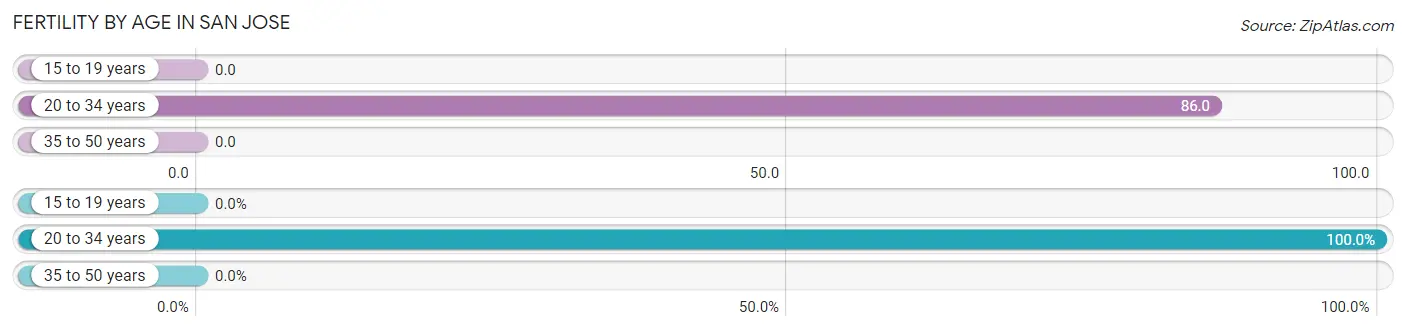
| Age Bracket | Women with Births | Births / 1,000 Women |
| 15 to 19 years | 0 (0.0%) | 0.0 |
| 20 to 34 years | 21 (100.0%) | 86.0 |
| 35 to 50 years | 0 (0.0%) | 0.0 |
| Total | 21 (100.0%) | 41.0 |
Fertility by Age by Marriage Status in San Jose
61.9% of women with births (21) in San Jose are married. The highest percentage of unmarried women with births falls into 20 to 34 years age bracket with 38.1% of them unmarried at the time of birth, while the lowest percentage of unmarried women with births belong to 20 to 34 years age bracket with 38.1% of them unmarried.
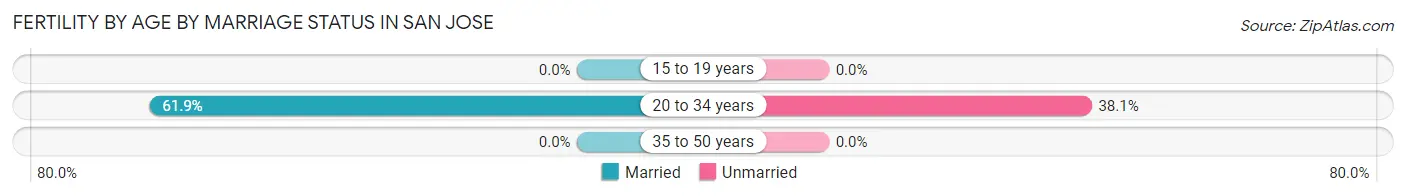
| Age Bracket | Married | Unmarried |
| 15 to 19 years | 0 (0.0%) | 0 (0.0%) |
| 20 to 34 years | 13 (61.9%) | 8 (38.1%) |
| 35 to 50 years | 0 (0.0%) | 0 (0.0%) |
| Total | 13 (61.9%) | 8 (38.1%) |
Fertility by Education in San Jose
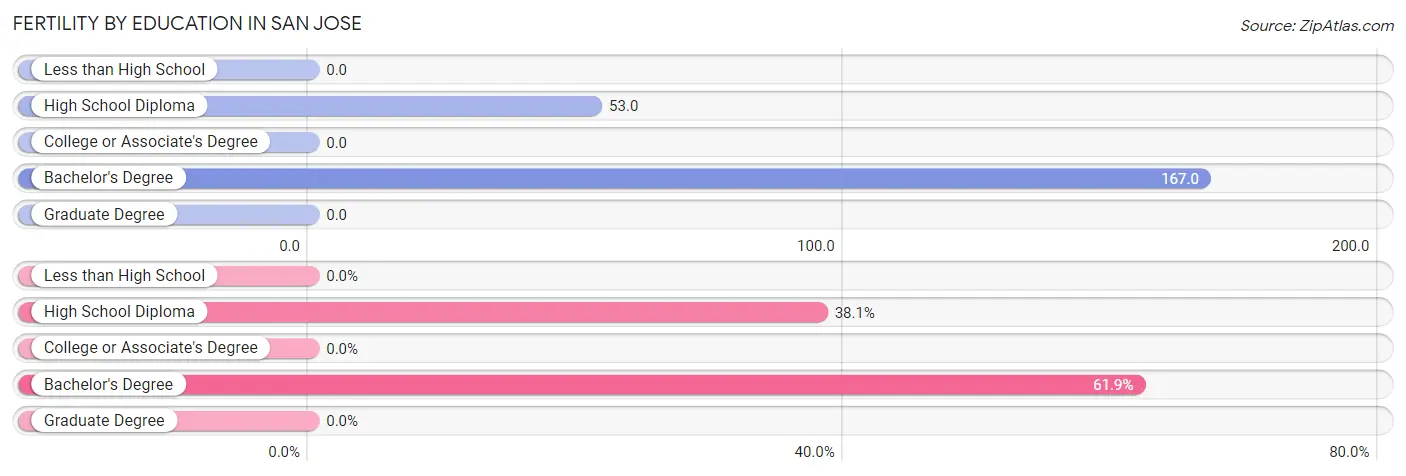
| Educational Attainment | Women with Births | Births / 1,000 Women |
| Less than High School | 0 (0.0%) | 0.0 |
| High School Diploma | 8 (38.1%) | 53.0 |
| College or Associate's Degree | 0 (0.0%) | 0.0 |
| Bachelor's Degree | 13 (61.9%) | 167.0 |
| Graduate Degree | 0 (0.0%) | 0.0 |
| Total | 21 (100.0%) | 41.0 |
Fertility by Education by Marriage Status in San Jose
38.1% of women with births in San Jose are unmarried. Women with the educational attainment of bachelor's degree are most likely to be married with 100.0% of them married at childbirth, while women with the educational attainment of high school diploma are least likely to be married with 100.0% of them unmarried at childbirth.
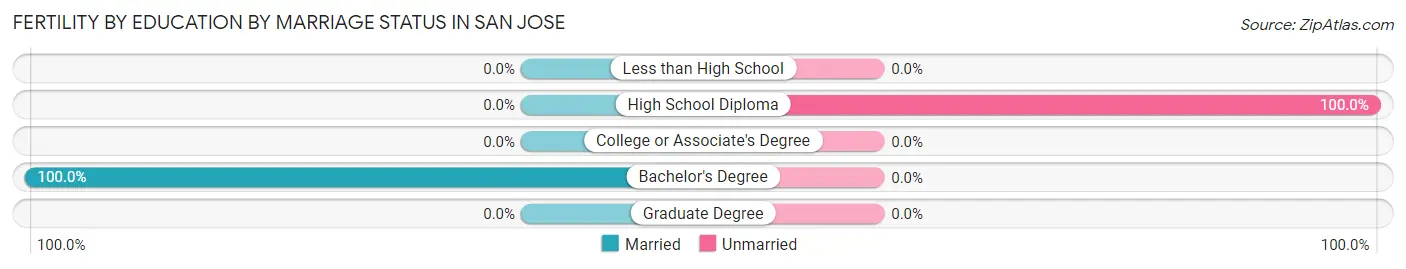
| Educational Attainment | Married | Unmarried |
| Less than High School | 0 (0.0%) | 0 (0.0%) |
| High School Diploma | 0 (0.0%) | 8 (100.0%) |
| College or Associate's Degree | 0 (0.0%) | 0 (0.0%) |
| Bachelor's Degree | 13 (100.0%) | 0 (0.0%) |
| Graduate Degree | 0 (0.0%) | 0 (0.0%) |
| Total | 13 (61.9%) | 8 (38.1%) |
Employment Characteristics in San Jose
Employment by Class of Employer in San Jose
Among the 605 employed individuals in San Jose, private company employees (422 | 69.8%), self-employed (not incorporated) (100 | 16.5%), and local government employees (53 | 8.8%) make up the most common classes of employment.
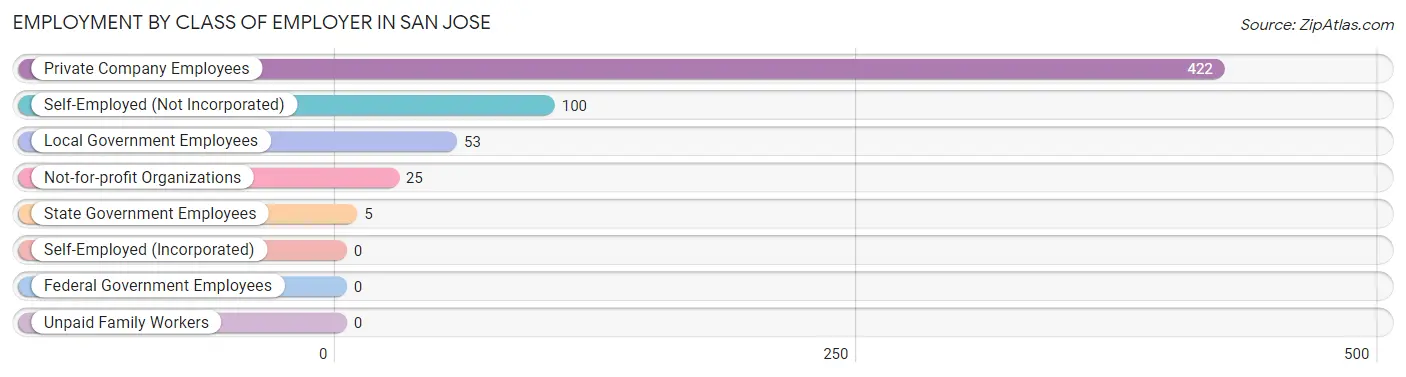
| Employer Class | # Employees | % Employees |
| Private Company Employees | 422 | 69.8% |
| Self-Employed (Incorporated) | 0 | 0.0% |
| Self-Employed (Not Incorporated) | 100 | 16.5% |
| Not-for-profit Organizations | 25 | 4.1% |
| Local Government Employees | 53 | 8.8% |
| State Government Employees | 5 | 0.8% |
| Federal Government Employees | 0 | 0.0% |
| Unpaid Family Workers | 0 | 0.0% |
| Total | 605 | 100.0% |
Employment Status by Age in San Jose
According to the labor force statistics for San Jose, out of the total population over 16 years of age (1,857), 40.9% or 760 individuals are in the labor force, with 12.4% or 94 of them unemployed. The age group with the highest labor force participation rate is 35 to 44 years, with 77.6% or 228 individuals in the labor force. Within the labor force, the 25 to 29 years age range has the highest percentage of unemployed individuals, with 26.7% or 20 of them being unemployed.
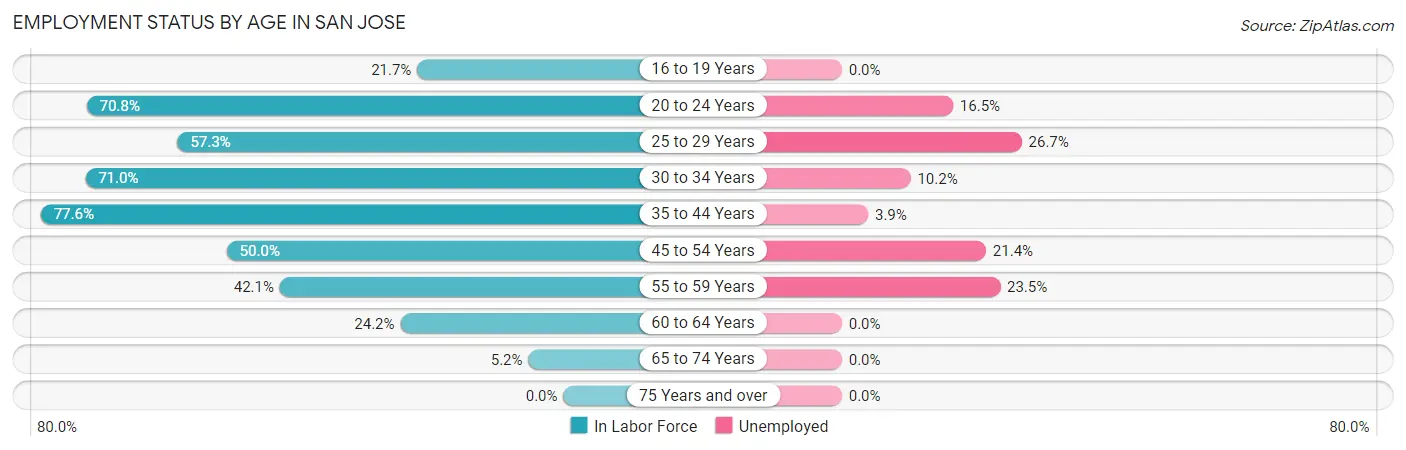
| Age Bracket | In Labor Force | Unemployed |
| 16 to 19 Years | 34 (21.7%) | 0 (0.0%) |
| 20 to 24 Years | 85 (70.8%) | 14 (16.5%) |
| 25 to 29 Years | 75 (57.3%) | 20 (26.7%) |
| 30 to 34 Years | 98 (71.0%) | 10 (10.2%) |
| 35 to 44 Years | 228 (77.6%) | 9 (3.9%) |
| 45 to 54 Years | 98 (50.0%) | 21 (21.4%) |
| 55 to 59 Years | 85 (42.1%) | 20 (23.5%) |
| 60 to 64 Years | 44 (24.2%) | 0 (0.0%) |
| 65 to 74 Years | 13 (5.2%) | 0 (0.0%) |
| 75 Years and over | 0 (0.0%) | 0 (0.0%) |
| Total | 760 (40.9%) | 94 (12.4%) |
Employment Status by Educational Attainment in San Jose
According to labor force statistics for San Jose, 54.9% of individuals (628) out of the total population between 25 and 64 years of age (1,143) are in the labor force, with 12.7% or 80 of them being unemployed. The group with the highest labor force participation rate are those with the educational attainment of bachelor's degree or higher, with 85.7% or 114 individuals in the labor force. Within the labor force, individuals with college / associate degree education have the highest percentage of unemployment, with 20.0% or 41 of them being unemployed.
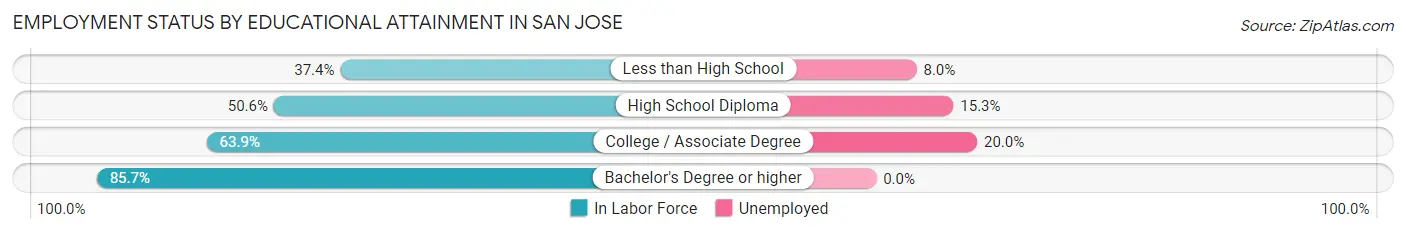
| Educational Attainment | In Labor Force | Unemployed |
| Less than High School | 113 (37.4%) | 24 (8.0%) |
| High School Diploma | 196 (50.6%) | 59 (15.3%) |
| College / Associate Degree | 205 (63.9%) | 64 (20.0%) |
| Bachelor's Degree or higher | 114 (85.7%) | 0 (0.0%) |
| Total | 628 (54.9%) | 145 (12.7%) |
Employment Occupations by Sex in San Jose
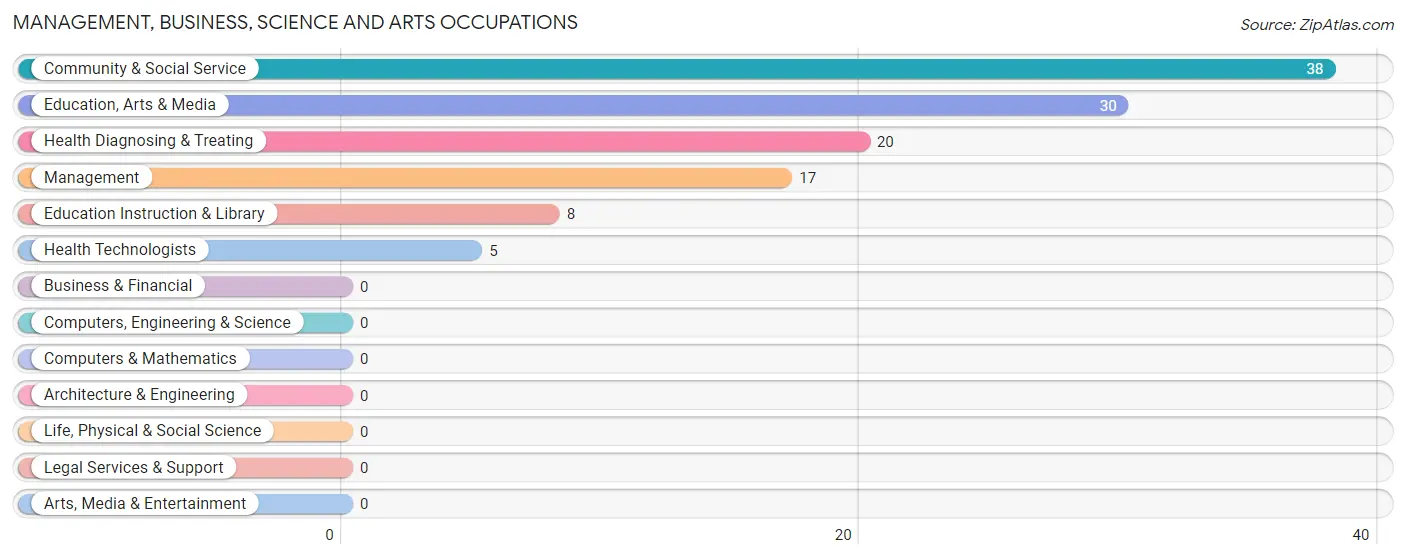
Management, Business, Science and Arts Occupations
The most common Management, Business, Science and Arts occupations in San Jose are Community & Social Service (38 | 5.7%), Education, Arts & Media (30 | 4.5%), Health Diagnosing & Treating (20 | 3.0%), Management (17 | 2.5%), and Education Instruction & Library (8 | 1.2%).
Management, Business, Science and Arts Occupations by Sex
Within the Management, Business, Science and Arts occupations in San Jose, the most male-oriented occupations are Management (47.1%), Education, Arts & Media (40.0%), and Community & Social Service (31.6%), while the most female-oriented occupations are Education Instruction & Library (100.0%), Health Diagnosing & Treating (100.0%), and Health Technologists (100.0%).
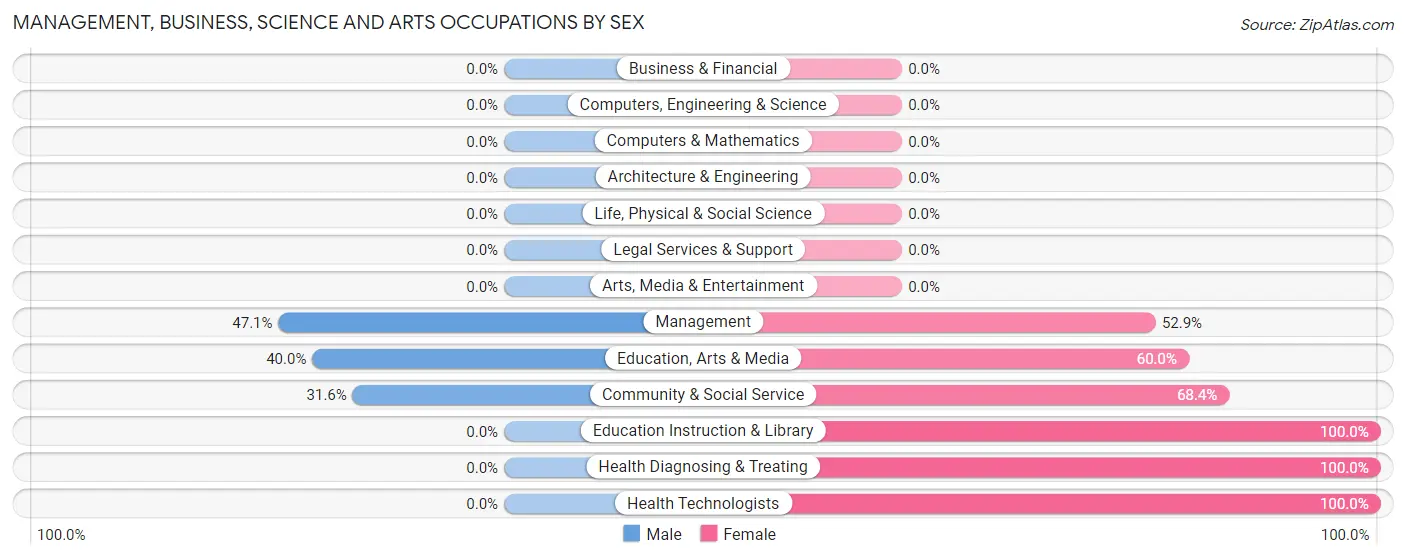
| Occupation | Male | Female |
| Management | 8 (47.1%) | 9 (52.9%) |
| Business & Financial | 0 (0.0%) | 0 (0.0%) |
| Computers, Engineering & Science | 0 (0.0%) | 0 (0.0%) |
| Computers & Mathematics | 0 (0.0%) | 0 (0.0%) |
| Architecture & Engineering | 0 (0.0%) | 0 (0.0%) |
| Life, Physical & Social Science | 0 (0.0%) | 0 (0.0%) |
| Community & Social Service | 12 (31.6%) | 26 (68.4%) |
| Education, Arts & Media | 12 (40.0%) | 18 (60.0%) |
| Legal Services & Support | 0 (0.0%) | 0 (0.0%) |
| Education Instruction & Library | 0 (0.0%) | 8 (100.0%) |
| Arts, Media & Entertainment | 0 (0.0%) | 0 (0.0%) |
| Health Diagnosing & Treating | 0 (0.0%) | 20 (100.0%) |
| Health Technologists | 0 (0.0%) | 5 (100.0%) |
| Total (Category) | 20 (26.7%) | 55 (73.3%) |
| Total (Overall) | 370 (55.6%) | 296 (44.4%) |
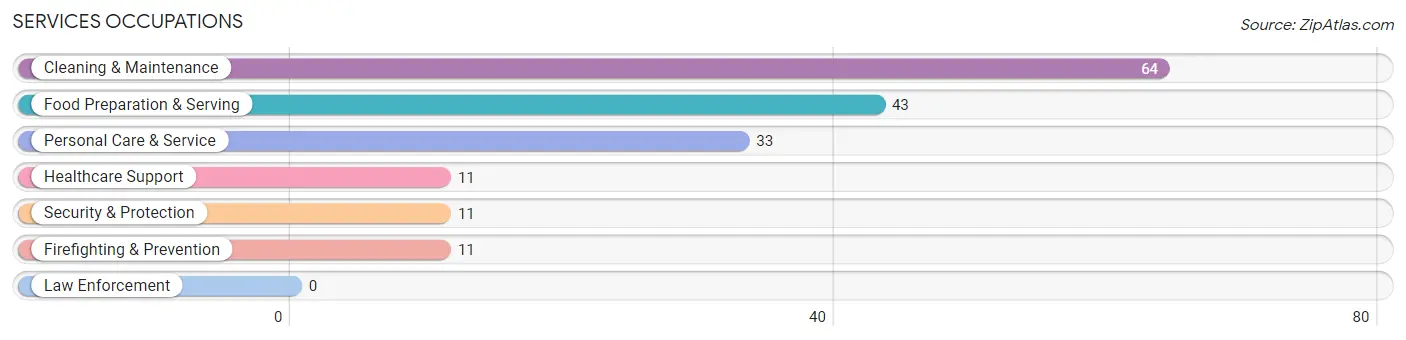
Services Occupations
The most common Services occupations in San Jose are Cleaning & Maintenance (64 | 9.6%), Food Preparation & Serving (43 | 6.5%), Personal Care & Service (33 | 5.0%), Healthcare Support (11 | 1.7%), and Security & Protection (11 | 1.7%).
Services Occupations by Sex
Within the Services occupations in San Jose, the most male-oriented occupations are Food Preparation & Serving (79.1%), and Cleaning & Maintenance (68.8%), while the most female-oriented occupations are Healthcare Support (100.0%), Security & Protection (100.0%), and Firefighting & Prevention (100.0%).
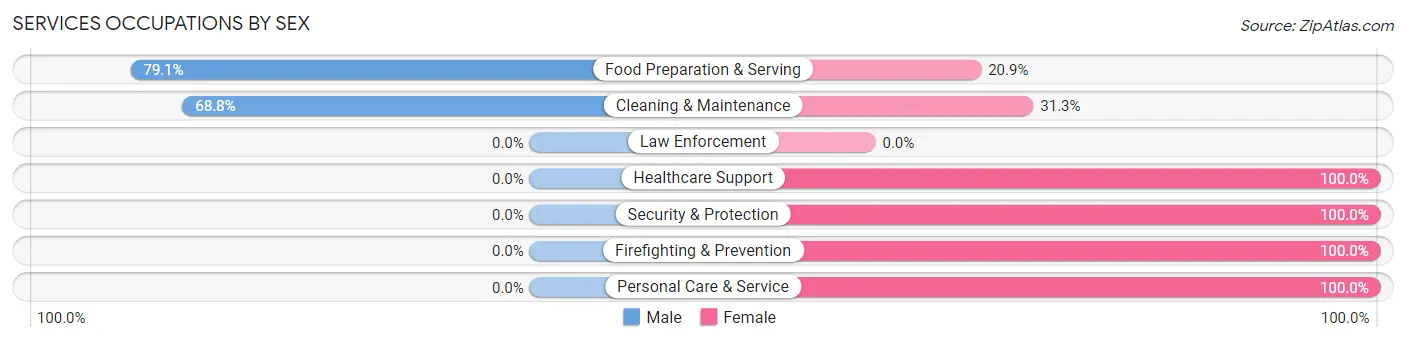
| Occupation | Male | Female |
| Healthcare Support | 0 (0.0%) | 11 (100.0%) |
| Security & Protection | 0 (0.0%) | 11 (100.0%) |
| Firefighting & Prevention | 0 (0.0%) | 11 (100.0%) |
| Law Enforcement | 0 (0.0%) | 0 (0.0%) |
| Food Preparation & Serving | 34 (79.1%) | 9 (20.9%) |
| Cleaning & Maintenance | 44 (68.8%) | 20 (31.2%) |
| Personal Care & Service | 0 (0.0%) | 33 (100.0%) |
| Total (Category) | 78 (48.1%) | 84 (51.8%) |
| Total (Overall) | 370 (55.6%) | 296 (44.4%) |
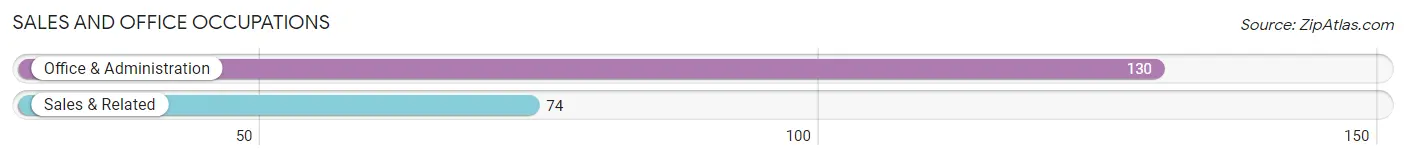
Sales and Office Occupations
The most common Sales and Office occupations in San Jose are Office & Administration (130 | 19.5%), and Sales & Related (74 | 11.1%).
Sales and Office Occupations by Sex
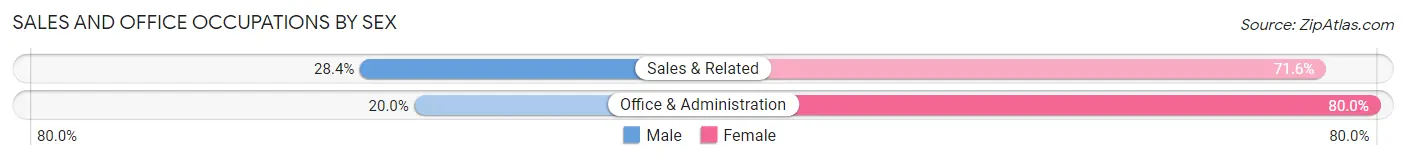
| Occupation | Male | Female |
| Sales & Related | 21 (28.4%) | 53 (71.6%) |
| Office & Administration | 26 (20.0%) | 104 (80.0%) |
| Total (Category) | 47 (23.0%) | 157 (77.0%) |
| Total (Overall) | 370 (55.6%) | 296 (44.4%) |
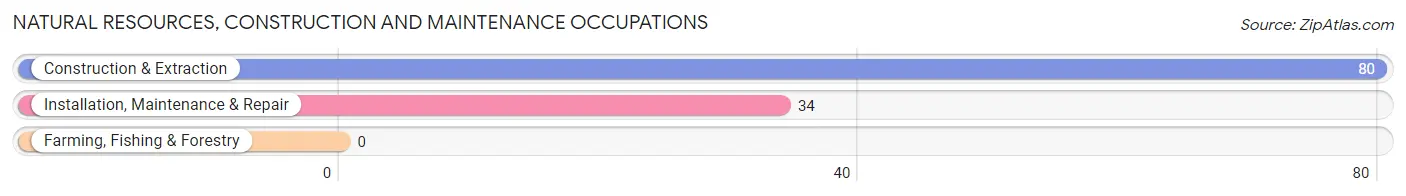
Natural Resources, Construction and Maintenance Occupations
The most common Natural Resources, Construction and Maintenance occupations in San Jose are Construction & Extraction (80 | 12.0%), and Installation, Maintenance & Repair (34 | 5.1%).
Natural Resources, Construction and Maintenance Occupations by Sex
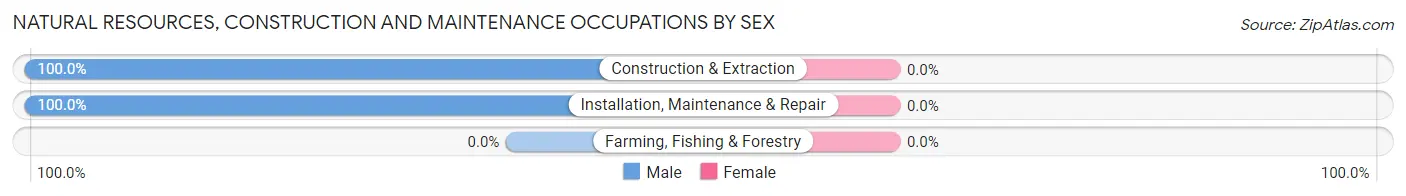
| Occupation | Male | Female |
| Farming, Fishing & Forestry | 0 (0.0%) | 0 (0.0%) |
| Construction & Extraction | 80 (100.0%) | 0 (0.0%) |
| Installation, Maintenance & Repair | 34 (100.0%) | 0 (0.0%) |
| Total (Category) | 114 (100.0%) | 0 (0.0%) |
| Total (Overall) | 370 (55.6%) | 296 (44.4%) |
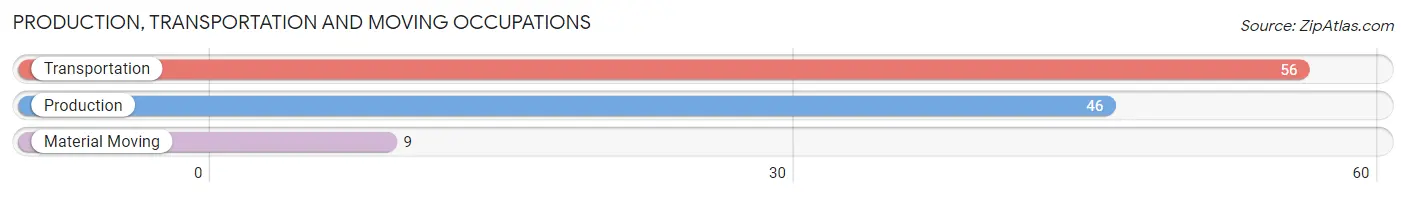
Production, Transportation and Moving Occupations
The most common Production, Transportation and Moving occupations in San Jose are Transportation (56 | 8.4%), Production (46 | 6.9%), and Material Moving (9 | 1.3%).
Production, Transportation and Moving Occupations by Sex
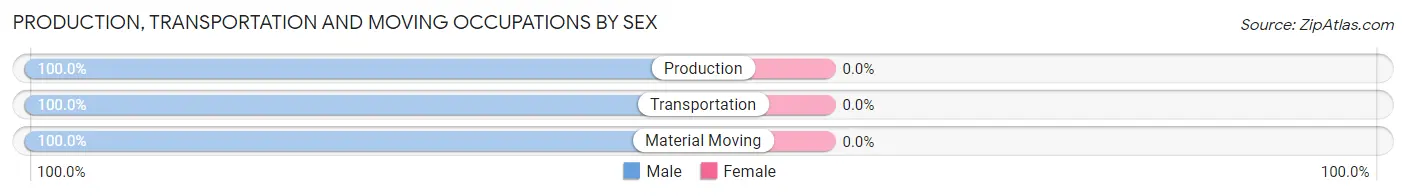
| Occupation | Male | Female |
| Production | 46 (100.0%) | 0 (0.0%) |
| Transportation | 56 (100.0%) | 0 (0.0%) |
| Material Moving | 9 (100.0%) | 0 (0.0%) |
| Total (Category) | 111 (100.0%) | 0 (0.0%) |
| Total (Overall) | 370 (55.6%) | 296 (44.4%) |
Employment Industries by Sex in San Jose
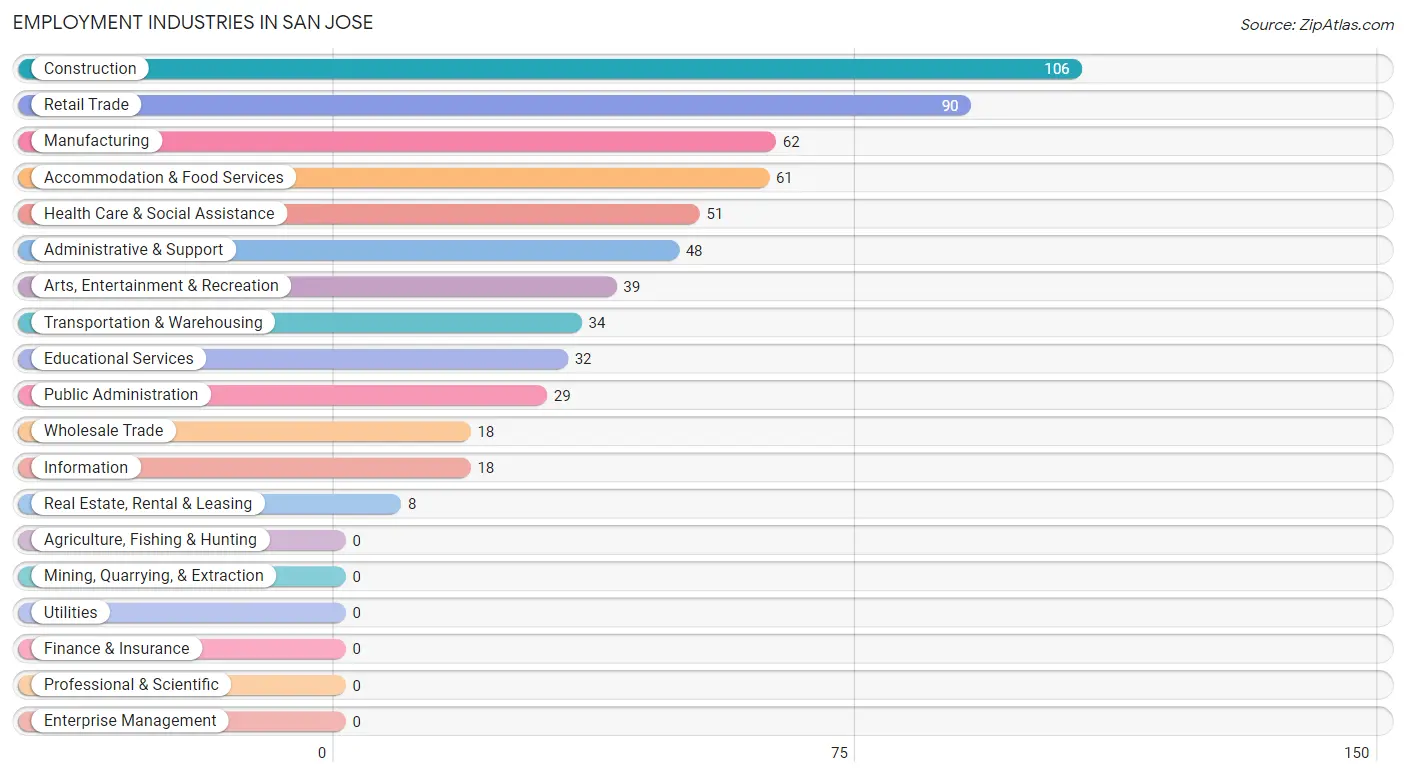
Employment Industries in San Jose
The major employment industries in San Jose include Construction (106 | 15.9%), Retail Trade (90 | 13.5%), Manufacturing (62 | 9.3%), Accommodation & Food Services (61 | 9.2%), and Health Care & Social Assistance (51 | 7.7%).
Employment Industries by Sex in San Jose
The San Jose industries that see more men than women are Construction (100.0%), Wholesale Trade (100.0%), and Real Estate, Rental & Leasing (100.0%), whereas the industries that tend to have a higher number of women are Information (100.0%), Educational Services (100.0%), and Arts, Entertainment & Recreation (100.0%).
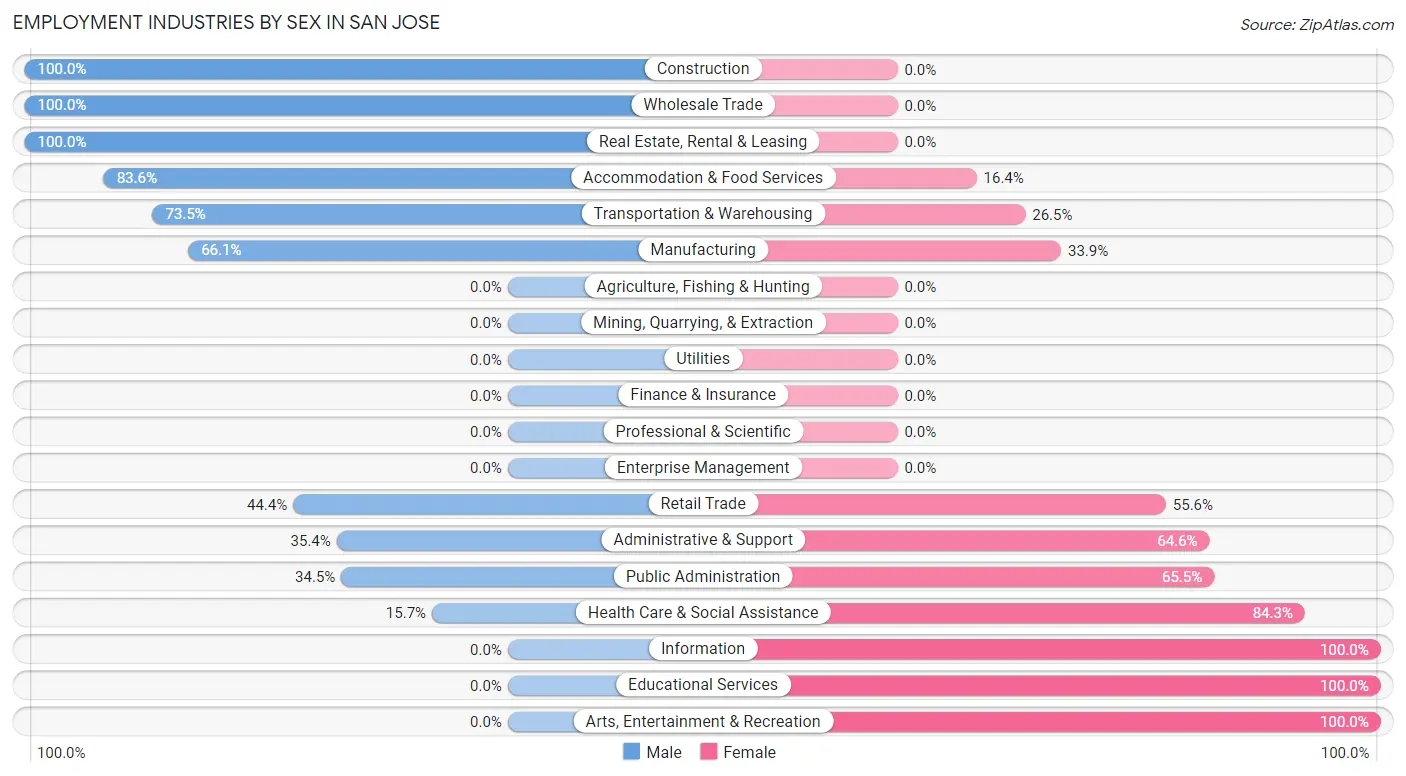
| Industry | Male | Female |
| Agriculture, Fishing & Hunting | 0 (0.0%) | 0 (0.0%) |
| Mining, Quarrying, & Extraction | 0 (0.0%) | 0 (0.0%) |
| Construction | 106 (100.0%) | 0 (0.0%) |
| Manufacturing | 41 (66.1%) | 21 (33.9%) |
| Wholesale Trade | 18 (100.0%) | 0 (0.0%) |
| Retail Trade | 40 (44.4%) | 50 (55.6%) |
| Transportation & Warehousing | 25 (73.5%) | 9 (26.5%) |
| Utilities | 0 (0.0%) | 0 (0.0%) |
| Information | 0 (0.0%) | 18 (100.0%) |
| Finance & Insurance | 0 (0.0%) | 0 (0.0%) |
| Real Estate, Rental & Leasing | 8 (100.0%) | 0 (0.0%) |
| Professional & Scientific | 0 (0.0%) | 0 (0.0%) |
| Enterprise Management | 0 (0.0%) | 0 (0.0%) |
| Administrative & Support | 17 (35.4%) | 31 (64.6%) |
| Educational Services | 0 (0.0%) | 32 (100.0%) |
| Health Care & Social Assistance | 8 (15.7%) | 43 (84.3%) |
| Arts, Entertainment & Recreation | 0 (0.0%) | 39 (100.0%) |
| Accommodation & Food Services | 51 (83.6%) | 10 (16.4%) |
| Public Administration | 10 (34.5%) | 19 (65.5%) |
| Total | 370 (55.6%) | 296 (44.4%) |
Education in San Jose
School Enrollment in San Jose
The most common levels of schooling among the 436 students in San Jose are high school (132 | 30.3%), college / undergraduate (120 | 27.5%), and elementary school (108 | 24.8%).
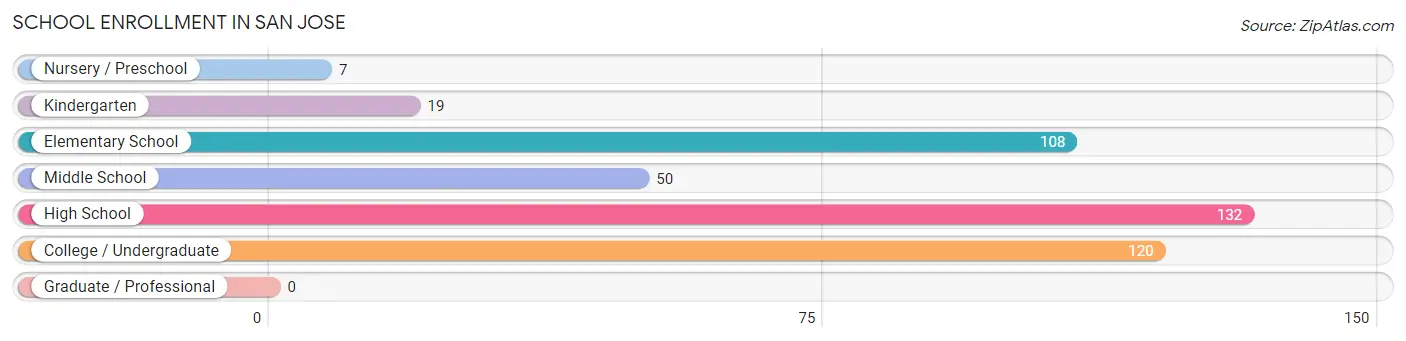
| School Level | # Students | % Students |
| Nursery / Preschool | 7 | 1.6% |
| Kindergarten | 19 | 4.4% |
| Elementary School | 108 | 24.8% |
| Middle School | 50 | 11.5% |
| High School | 132 | 30.3% |
| College / Undergraduate | 120 | 27.5% |
| Graduate / Professional | 0 | 0.0% |
| Total | 436 | 100.0% |
School Enrollment by Age by Funding Source in San Jose
Out of a total of 436 students who are enrolled in schools in San Jose, 110 (25.2%) attend a private institution, while the remaining 326 (74.8%) are enrolled in public schools. The age group of 25 to 34 year olds has the highest likelihood of being enrolled in private schools, with 15 (100.0% in the age bracket) enrolled. Conversely, the age group of 3 to 4 year olds has the lowest likelihood of being enrolled in a private school, with 7 (100.0% in the age bracket) attending a public institution.
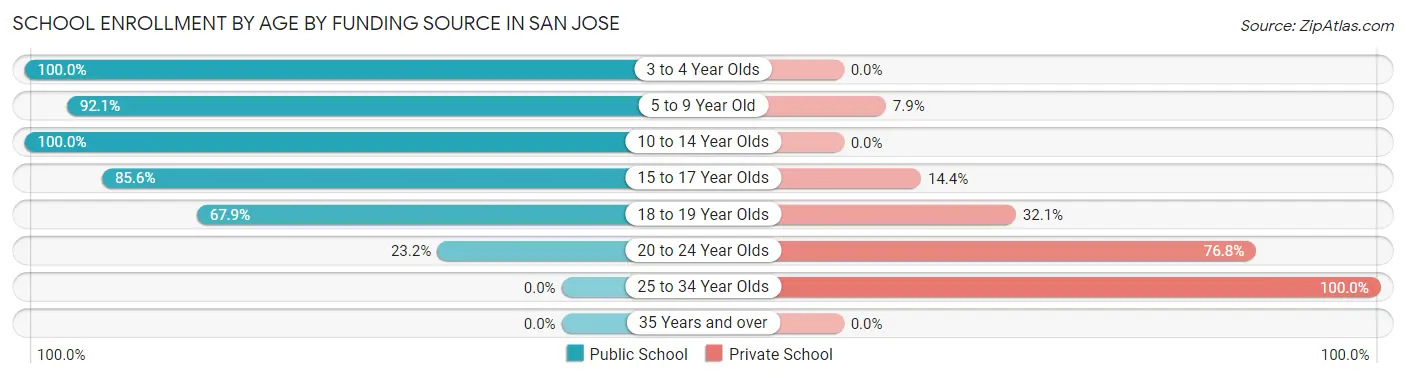
| Age Bracket | Public School | Private School |
| 3 to 4 Year Olds | 7 (100.0%) | 0 (0.0%) |
| 5 to 9 Year Old | 117 (92.1%) | 10 (7.9%) |
| 10 to 14 Year Olds | 61 (100.0%) | 0 (0.0%) |
| 15 to 17 Year Olds | 89 (85.6%) | 15 (14.4%) |
| 18 to 19 Year Olds | 36 (67.9%) | 17 (32.1%) |
| 20 to 24 Year Olds | 16 (23.2%) | 53 (76.8%) |
| 25 to 34 Year Olds | 0 (0.0%) | 15 (100.0%) |
| 35 Years and over | 0 (0.0%) | 0 (0.0%) |
| Total | 326 (74.8%) | 110 (25.2%) |
Educational Attainment by Field of Study in San Jose
Education (45 | 30.0%), business (32 | 21.3%), science & technology (20 | 13.3%), social sciences (18 | 12.0%), and arts & humanities (15 | 10.0%) are the most common fields of study among 150 individuals in San Jose who have obtained a bachelor's degree or higher.
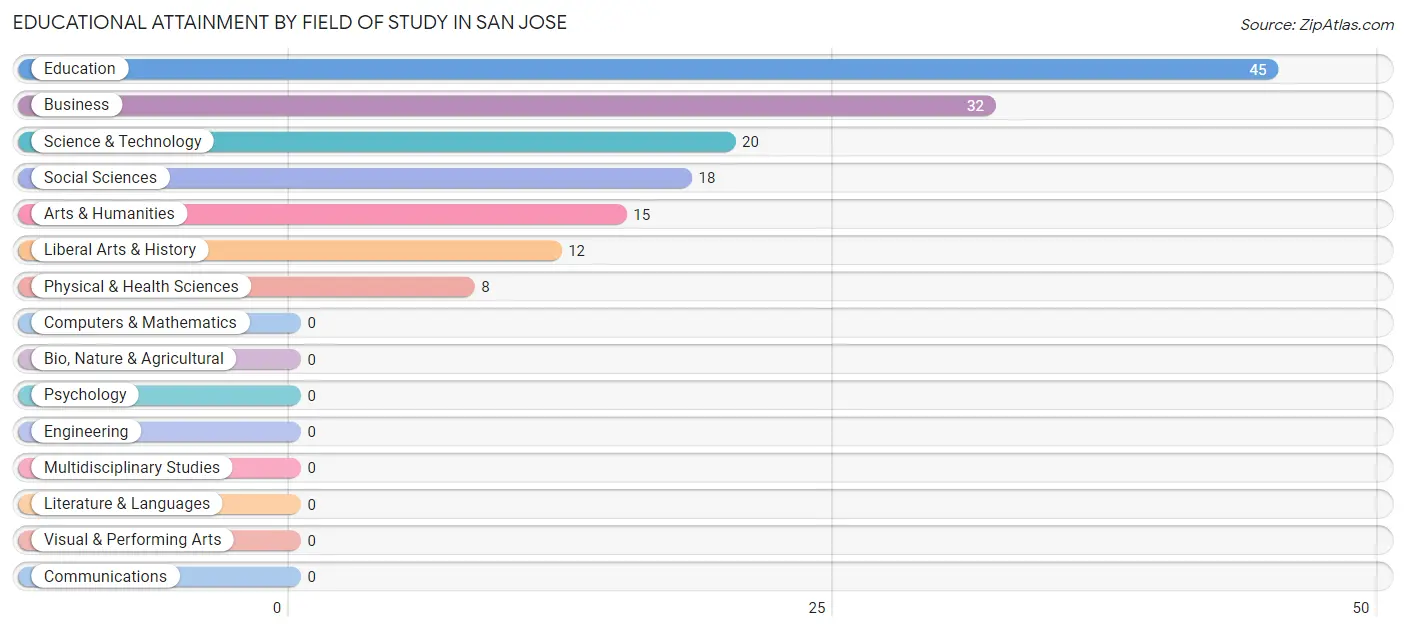
| Field of Study | # Graduates | % Graduates |
| Computers & Mathematics | 0 | 0.0% |
| Bio, Nature & Agricultural | 0 | 0.0% |
| Physical & Health Sciences | 8 | 5.3% |
| Psychology | 0 | 0.0% |
| Social Sciences | 18 | 12.0% |
| Engineering | 0 | 0.0% |
| Multidisciplinary Studies | 0 | 0.0% |
| Science & Technology | 20 | 13.3% |
| Business | 32 | 21.3% |
| Education | 45 | 30.0% |
| Literature & Languages | 0 | 0.0% |
| Liberal Arts & History | 12 | 8.0% |
| Visual & Performing Arts | 0 | 0.0% |
| Communications | 0 | 0.0% |
| Arts & Humanities | 15 | 10.0% |
| Total | 150 | 100.0% |
Transportation & Commute in San Jose
Vehicle Availability by Sex in San Jose
The most prevalent vehicle ownership categories in San Jose are males with 2 vehicles (124, accounting for 38.8%) and females with 2 vehicles (106, making up 43.5%).
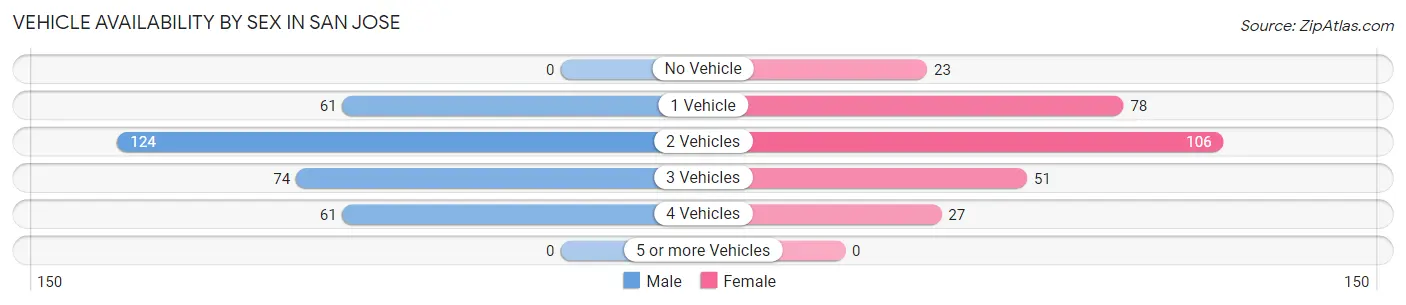
| Vehicles Available | Male | Female |
| No Vehicle | 0 (0.0%) | 23 (8.1%) |
| 1 Vehicle | 61 (19.1%) | 78 (27.4%) |
| 2 Vehicles | 124 (38.8%) | 106 (37.2%) |
| 3 Vehicles | 74 (23.1%) | 51 (17.9%) |
| 4 Vehicles | 61 (19.1%) | 27 (9.5%) |
| 5 or more Vehicles | 0 (0.0%) | 0 (0.0%) |
| Total | 320 (100.0%) | 285 (100.0%) |
Commute Time in San Jose
The most frequently occuring commute durations in San Jose are 20 to 24 minutes (149 commuters, 27.4%), 30 to 34 minutes (76 commuters, 14.0%), and 15 to 19 minutes (70 commuters, 12.9%).
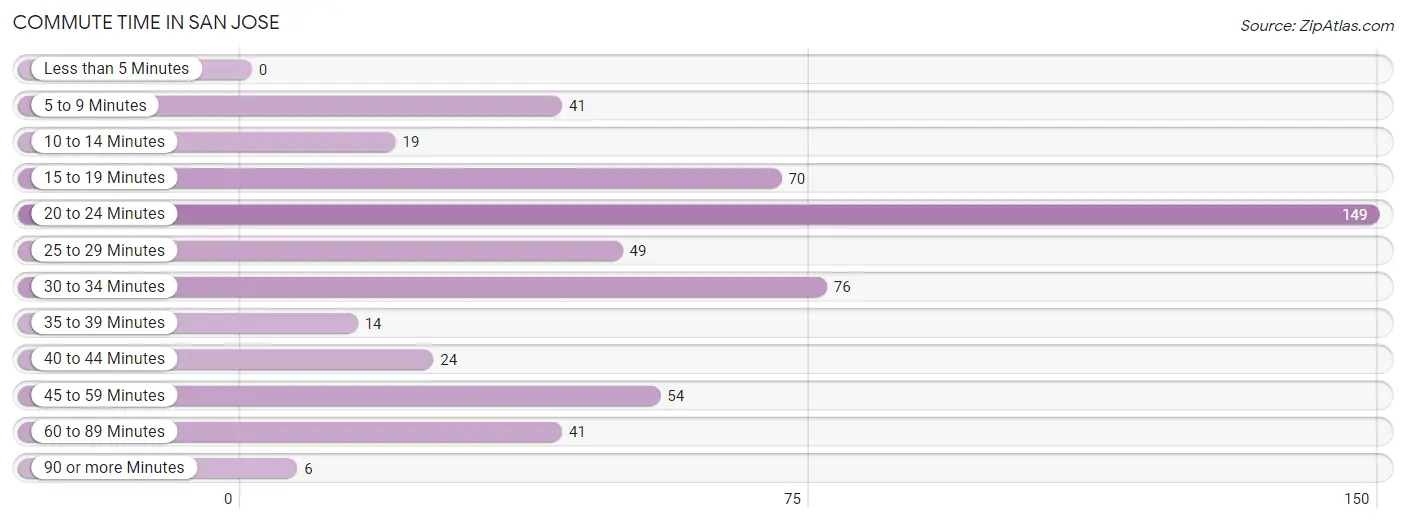
| Commute Time | # Commuters | % Commuters |
| Less than 5 Minutes | 0 | 0.0% |
| 5 to 9 Minutes | 41 | 7.5% |
| 10 to 14 Minutes | 19 | 3.5% |
| 15 to 19 Minutes | 70 | 12.9% |
| 20 to 24 Minutes | 149 | 27.4% |
| 25 to 29 Minutes | 49 | 9.0% |
| 30 to 34 Minutes | 76 | 14.0% |
| 35 to 39 Minutes | 14 | 2.6% |
| 40 to 44 Minutes | 24 | 4.4% |
| 45 to 59 Minutes | 54 | 9.9% |
| 60 to 89 Minutes | 41 | 7.5% |
| 90 or more Minutes | 6 | 1.1% |
Commute Time by Sex in San Jose
The most common commute times in San Jose are 20 to 24 minutes (92 commuters, 32.6%) for males and 20 to 24 minutes (57 commuters, 21.8%) for females.
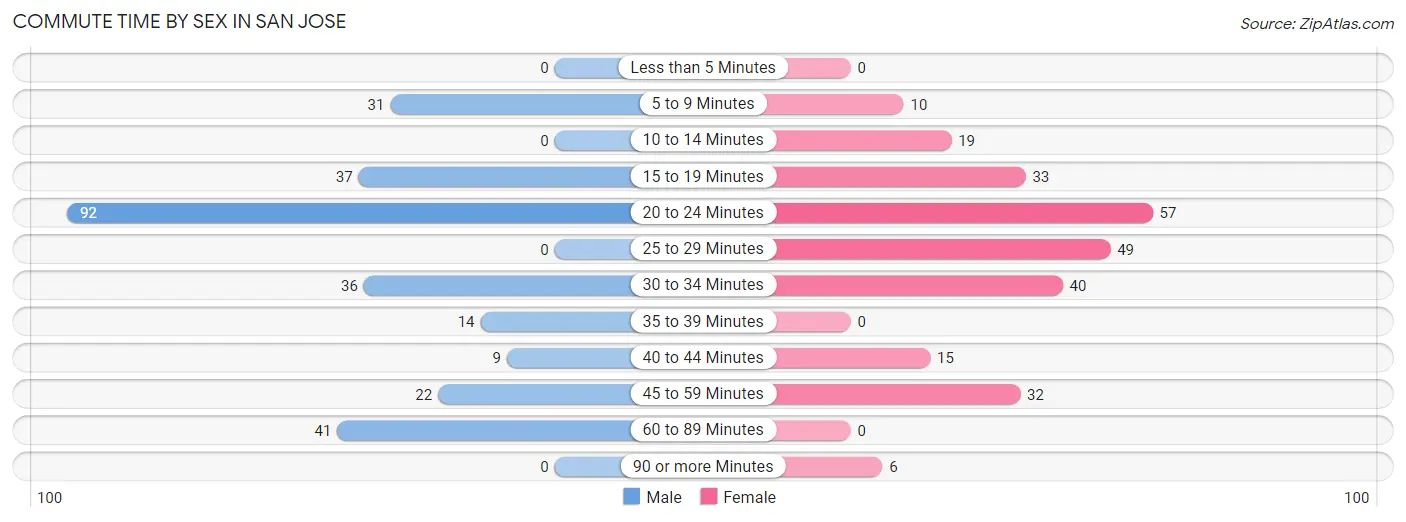
| Commute Time | Male | Female |
| Less than 5 Minutes | 0 (0.0%) | 0 (0.0%) |
| 5 to 9 Minutes | 31 (11.0%) | 10 (3.8%) |
| 10 to 14 Minutes | 0 (0.0%) | 19 (7.3%) |
| 15 to 19 Minutes | 37 (13.1%) | 33 (12.6%) |
| 20 to 24 Minutes | 92 (32.6%) | 57 (21.8%) |
| 25 to 29 Minutes | 0 (0.0%) | 49 (18.8%) |
| 30 to 34 Minutes | 36 (12.8%) | 40 (15.3%) |
| 35 to 39 Minutes | 14 (5.0%) | 0 (0.0%) |
| 40 to 44 Minutes | 9 (3.2%) | 15 (5.8%) |
| 45 to 59 Minutes | 22 (7.8%) | 32 (12.3%) |
| 60 to 89 Minutes | 41 (14.5%) | 0 (0.0%) |
| 90 or more Minutes | 0 (0.0%) | 6 (2.3%) |
Time of Departure to Work by Sex in San Jose
The most frequent times of departure to work in San Jose are 6:00 AM to 6:29 AM (52, 18.4%) for males and 4:00 PM to 11:59 PM (60, 23.0%) for females.
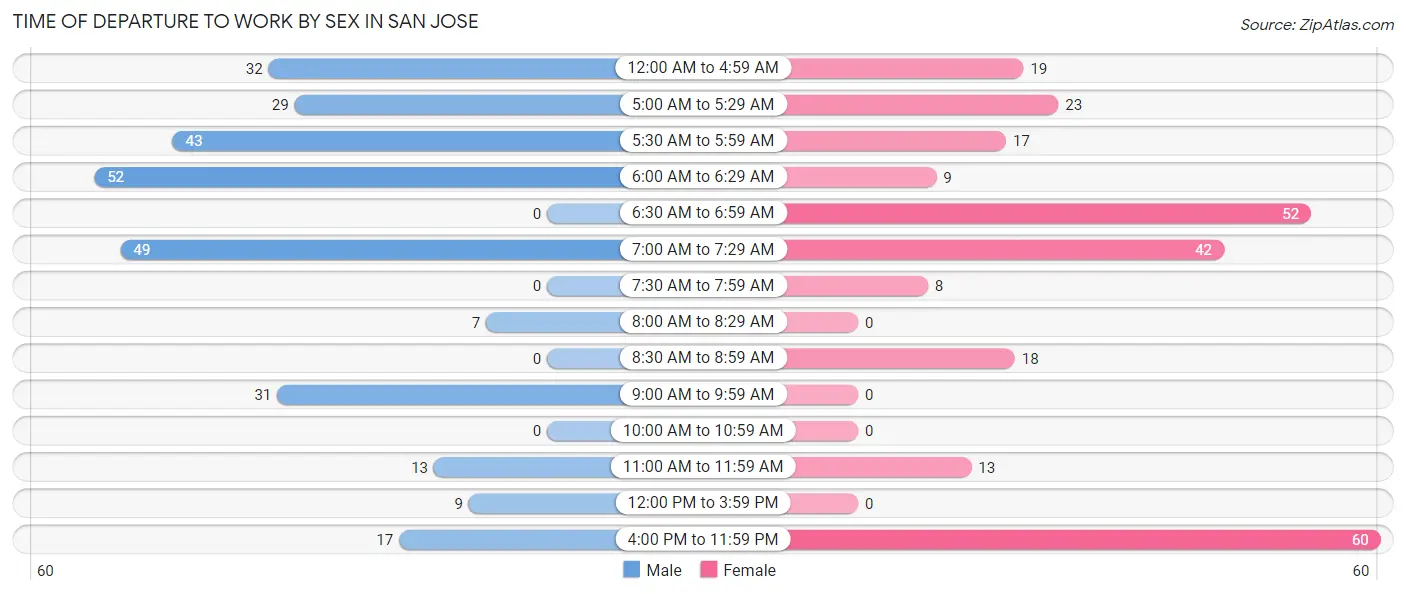
| Time of Departure | Male | Female |
| 12:00 AM to 4:59 AM | 32 (11.4%) | 19 (7.3%) |
| 5:00 AM to 5:29 AM | 29 (10.3%) | 23 (8.8%) |
| 5:30 AM to 5:59 AM | 43 (15.2%) | 17 (6.5%) |
| 6:00 AM to 6:29 AM | 52 (18.4%) | 9 (3.5%) |
| 6:30 AM to 6:59 AM | 0 (0.0%) | 52 (19.9%) |
| 7:00 AM to 7:29 AM | 49 (17.4%) | 42 (16.1%) |
| 7:30 AM to 7:59 AM | 0 (0.0%) | 8 (3.1%) |
| 8:00 AM to 8:29 AM | 7 (2.5%) | 0 (0.0%) |
| 8:30 AM to 8:59 AM | 0 (0.0%) | 18 (6.9%) |
| 9:00 AM to 9:59 AM | 31 (11.0%) | 0 (0.0%) |
| 10:00 AM to 10:59 AM | 0 (0.0%) | 0 (0.0%) |
| 11:00 AM to 11:59 AM | 13 (4.6%) | 13 (5.0%) |
| 12:00 PM to 3:59 PM | 9 (3.2%) | 0 (0.0%) |
| 4:00 PM to 11:59 PM | 17 (6.0%) | 60 (23.0%) |
| Total | 282 (100.0%) | 261 (100.0%) |
Housing Occupancy in San Jose
Occupancy by Ownership in San Jose
Of the total 808 dwellings in San Jose, owner-occupied units account for 579 (71.7%), while renter-occupied units make up 229 (28.3%).
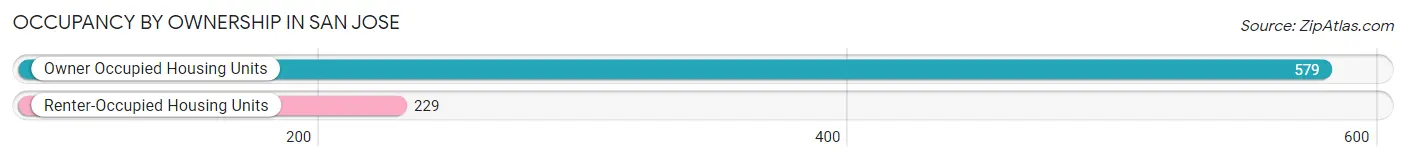
| Occupancy | # Housing Units | % Housing Units |
| Owner Occupied Housing Units | 579 | 71.7% |
| Renter-Occupied Housing Units | 229 | 28.3% |
| Total Occupied Housing Units | 808 | 100.0% |
Occupancy by Household Size in San Jose
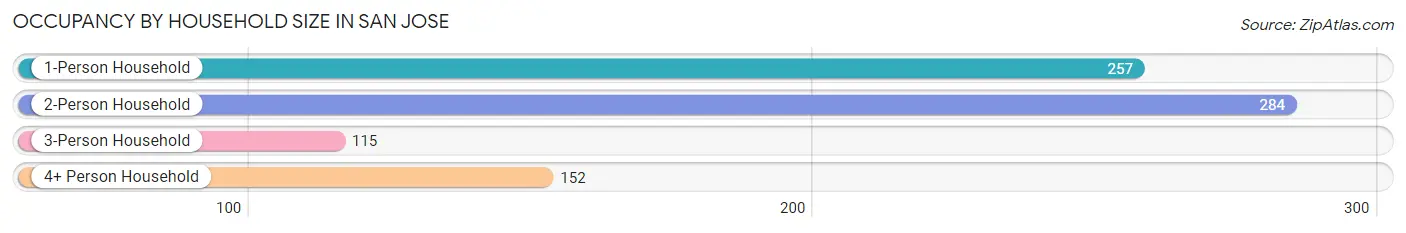
| Household Size | # Housing Units | % Housing Units |
| 1-Person Household | 257 | 31.8% |
| 2-Person Household | 284 | 35.1% |
| 3-Person Household | 115 | 14.2% |
| 4+ Person Household | 152 | 18.8% |
| Total Housing Units | 808 | 100.0% |
Occupancy by Ownership by Household Size in San Jose
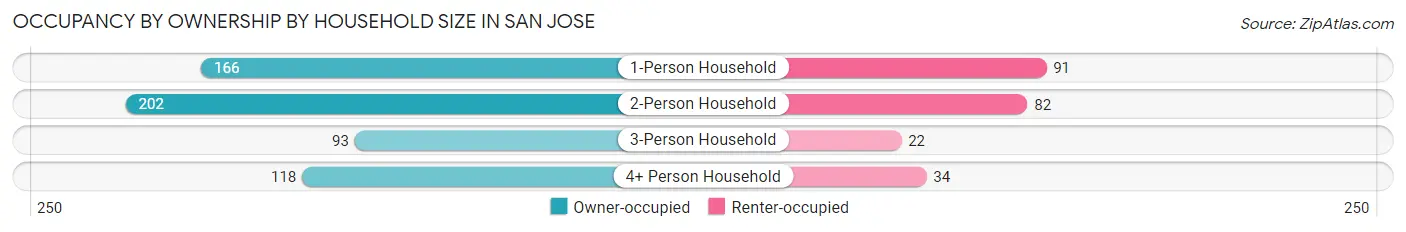
| Household Size | Owner-occupied | Renter-occupied |
| 1-Person Household | 166 (64.6%) | 91 (35.4%) |
| 2-Person Household | 202 (71.1%) | 82 (28.9%) |
| 3-Person Household | 93 (80.9%) | 22 (19.1%) |
| 4+ Person Household | 118 (77.6%) | 34 (22.4%) |
| Total Housing Units | 579 (71.7%) | 229 (28.3%) |
Occupancy by Educational Attainment in San Jose
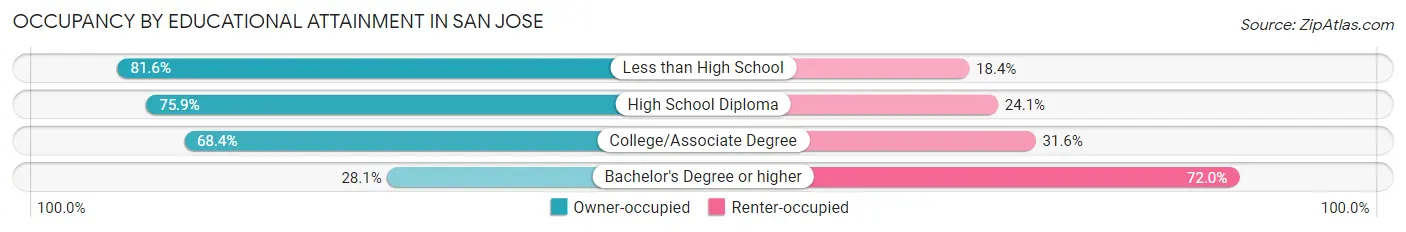
| Household Size | Owner-occupied | Renter-occupied |
| Less than High School | 261 (81.6%) | 59 (18.4%) |
| High School Diploma | 176 (75.9%) | 56 (24.1%) |
| College/Associate Degree | 119 (68.4%) | 55 (31.6%) |
| Bachelor's Degree or higher | 23 (28.1%) | 59 (72.0%) |
Occupancy by Age of Householder in San Jose
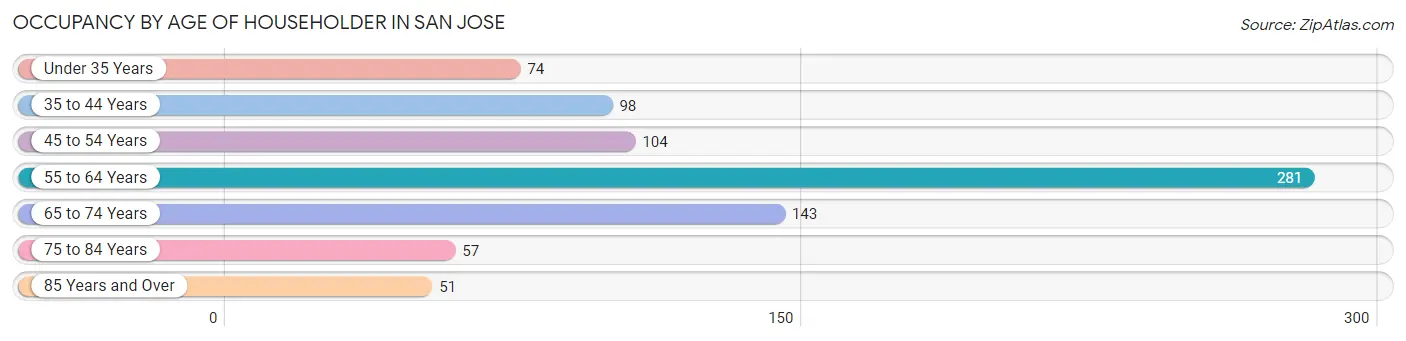
| Age Bracket | # Households | % Households |
| Under 35 Years | 74 | 9.2% |
| 35 to 44 Years | 98 | 12.1% |
| 45 to 54 Years | 104 | 12.9% |
| 55 to 64 Years | 281 | 34.8% |
| 65 to 74 Years | 143 | 17.7% |
| 75 to 84 Years | 57 | 7.0% |
| 85 Years and Over | 51 | 6.3% |
| Total | 808 | 100.0% |
Housing Finances in San Jose
Median Income by Occupancy in San Jose
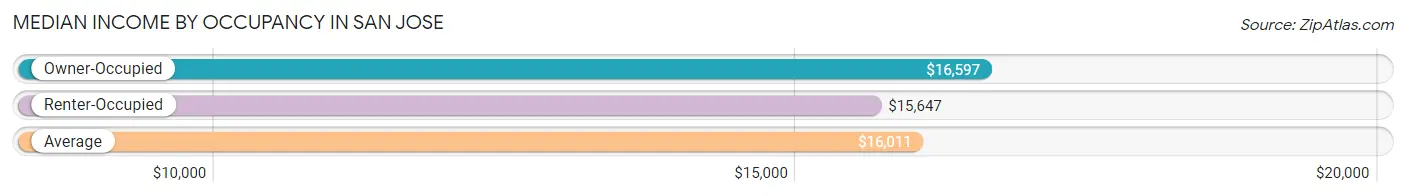
| Occupancy Type | # Households | Median Income |
| Owner-Occupied | 579 (71.7%) | $16,597 |
| Renter-Occupied | 229 (28.3%) | $15,647 |
| Average | 808 (100.0%) | $16,011 |
Occupancy by Householder Income Bracket in San Jose
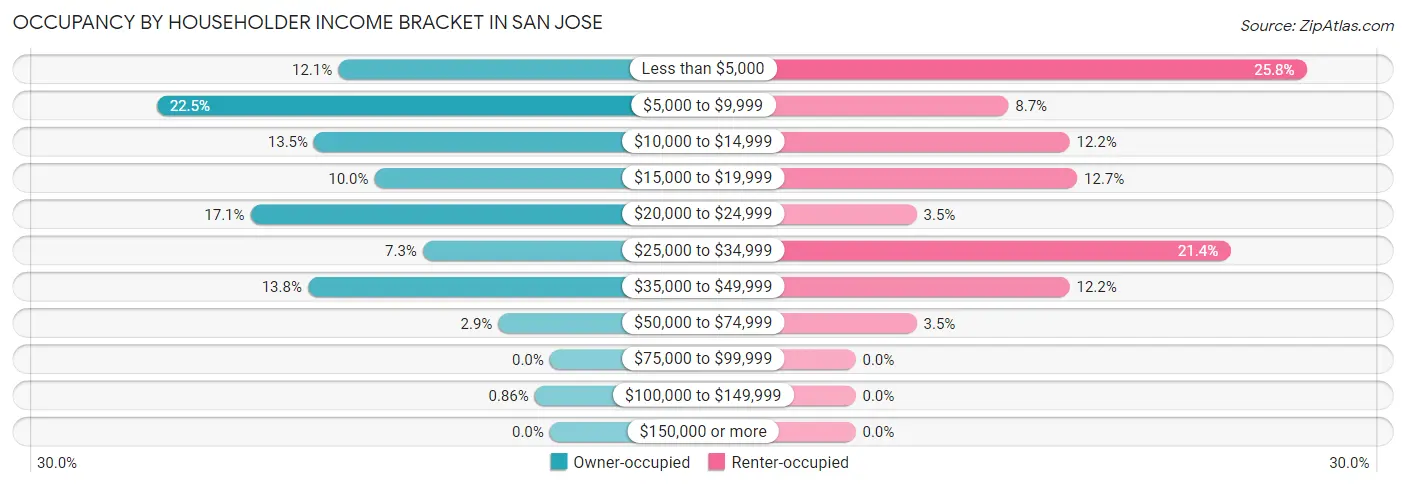
| Income Bracket | Owner-occupied | Renter-occupied |
| Less than $5,000 | 70 (12.1%) | 59 (25.8%) |
| $5,000 to $9,999 | 130 (22.5%) | 20 (8.7%) |
| $10,000 to $14,999 | 78 (13.5%) | 28 (12.2%) |
| $15,000 to $19,999 | 58 (10.0%) | 29 (12.7%) |
| $20,000 to $24,999 | 99 (17.1%) | 8 (3.5%) |
| $25,000 to $34,999 | 42 (7.2%) | 49 (21.4%) |
| $35,000 to $49,999 | 80 (13.8%) | 28 (12.2%) |
| $50,000 to $74,999 | 17 (2.9%) | 8 (3.5%) |
| $75,000 to $99,999 | 0 (0.0%) | 0 (0.0%) |
| $100,000 to $149,999 | 5 (0.9%) | 0 (0.0%) |
| $150,000 or more | 0 (0.0%) | 0 (0.0%) |
| Total | 579 (100.0%) | 229 (100.0%) |
Monthly Housing Cost Tiers in San Jose
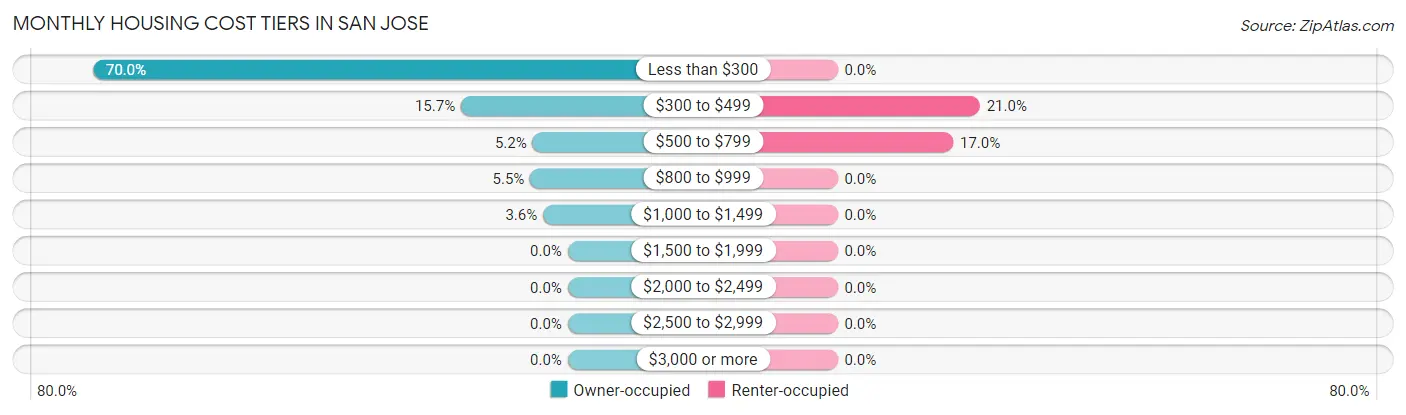
| Monthly Cost | Owner-occupied | Renter-occupied |
| Less than $300 | 405 (70.0%) | 0 (0.0%) |
| $300 to $499 | 91 (15.7%) | 48 (21.0%) |
| $500 to $799 | 30 (5.2%) | 39 (17.0%) |
| $800 to $999 | 32 (5.5%) | 0 (0.0%) |
| $1,000 to $1,499 | 21 (3.6%) | 0 (0.0%) |
| $1,500 to $1,999 | 0 (0.0%) | 0 (0.0%) |
| $2,000 to $2,499 | 0 (0.0%) | 0 (0.0%) |
| $2,500 to $2,999 | 0 (0.0%) | 0 (0.0%) |
| $3,000 or more | 0 (0.0%) | 0 (0.0%) |
| Total | 579 (100.0%) | 229 (100.0%) |
Physical Housing Characteristics in San Jose
Housing Structures in San Jose
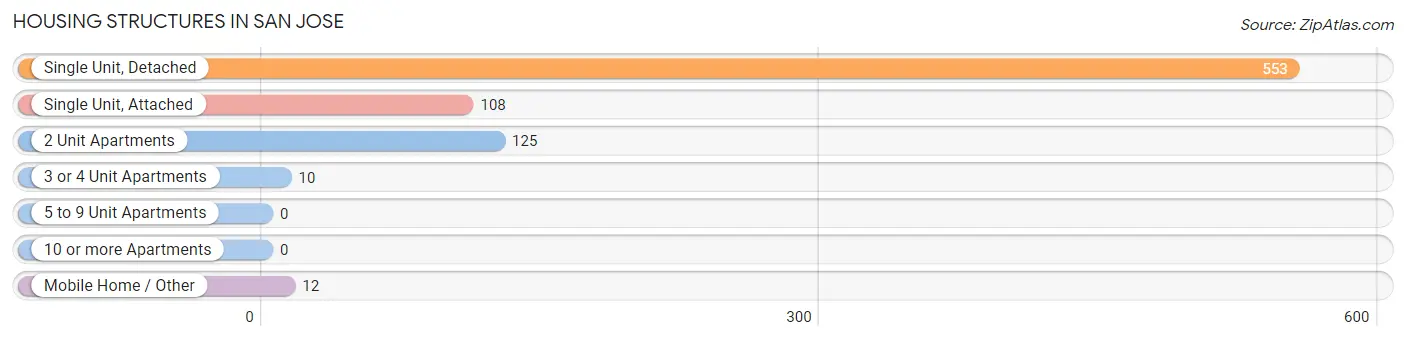
| Structure Type | # Housing Units | % Housing Units |
| Single Unit, Detached | 553 | 68.4% |
| Single Unit, Attached | 108 | 13.4% |
| 2 Unit Apartments | 125 | 15.5% |
| 3 or 4 Unit Apartments | 10 | 1.2% |
| 5 to 9 Unit Apartments | 0 | 0.0% |
| 10 or more Apartments | 0 | 0.0% |
| Mobile Home / Other | 12 | 1.5% |
| Total | 808 | 100.0% |
Housing Structures by Occupancy in San Jose
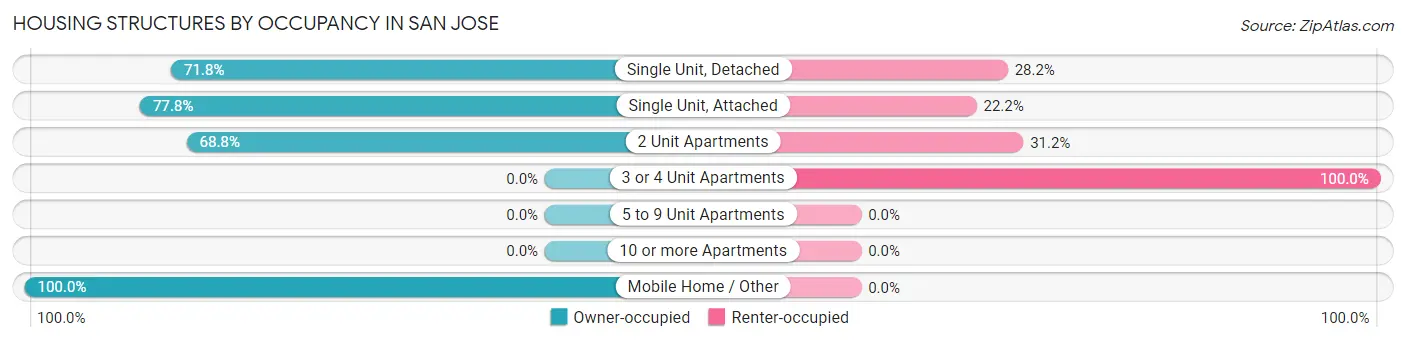
| Structure Type | Owner-occupied | Renter-occupied |
| Single Unit, Detached | 397 (71.8%) | 156 (28.2%) |
| Single Unit, Attached | 84 (77.8%) | 24 (22.2%) |
| 2 Unit Apartments | 86 (68.8%) | 39 (31.2%) |
| 3 or 4 Unit Apartments | 0 (0.0%) | 10 (100.0%) |
| 5 to 9 Unit Apartments | 0 (0.0%) | 0 (0.0%) |
| 10 or more Apartments | 0 (0.0%) | 0 (0.0%) |
| Mobile Home / Other | 12 (100.0%) | 0 (0.0%) |
| Total | 579 (71.7%) | 229 (28.3%) |
Housing Structures by Number of Rooms in San Jose
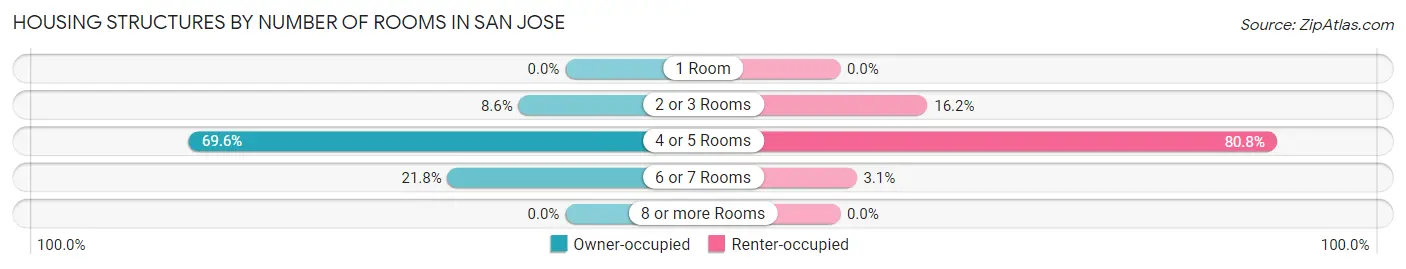
| Number of Rooms | Owner-occupied | Renter-occupied |
| 1 Room | 0 (0.0%) | 0 (0.0%) |
| 2 or 3 Rooms | 50 (8.6%) | 37 (16.2%) |
| 4 or 5 Rooms | 403 (69.6%) | 185 (80.8%) |
| 6 or 7 Rooms | 126 (21.8%) | 7 (3.1%) |
| 8 or more Rooms | 0 (0.0%) | 0 (0.0%) |
| Total | 579 (100.0%) | 229 (100.0%) |
Housing Structure by Heating Type in San Jose
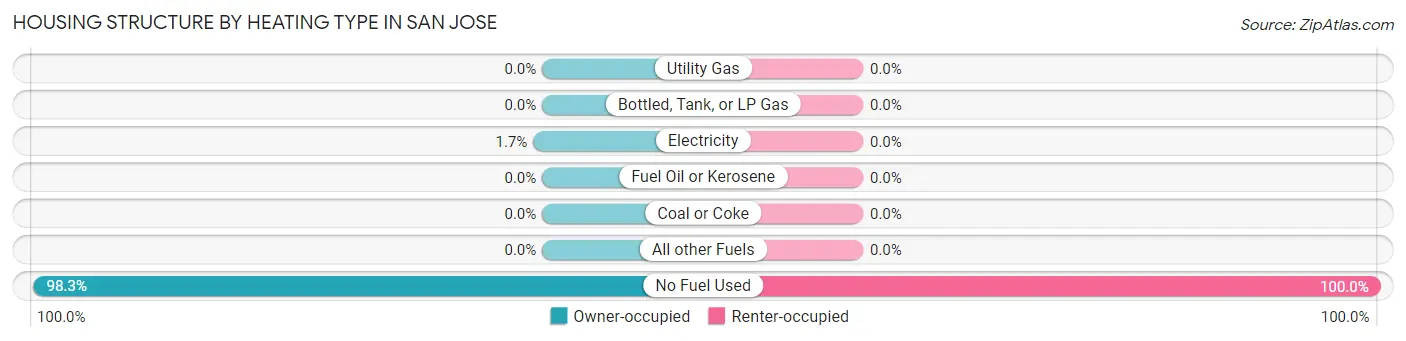
| Heating Type | Owner-occupied | Renter-occupied |
| Utility Gas | 0 (0.0%) | 0 (0.0%) |
| Bottled, Tank, or LP Gas | 0 (0.0%) | 0 (0.0%) |
| Electricity | 10 (1.7%) | 0 (0.0%) |
| Fuel Oil or Kerosene | 0 (0.0%) | 0 (0.0%) |
| Coal or Coke | 0 (0.0%) | 0 (0.0%) |
| All other Fuels | 0 (0.0%) | 0 (0.0%) |
| No Fuel Used | 569 (98.3%) | 229 (100.0%) |
| Total | 579 (100.0%) | 229 (100.0%) |
Household Vehicle Usage in San Jose
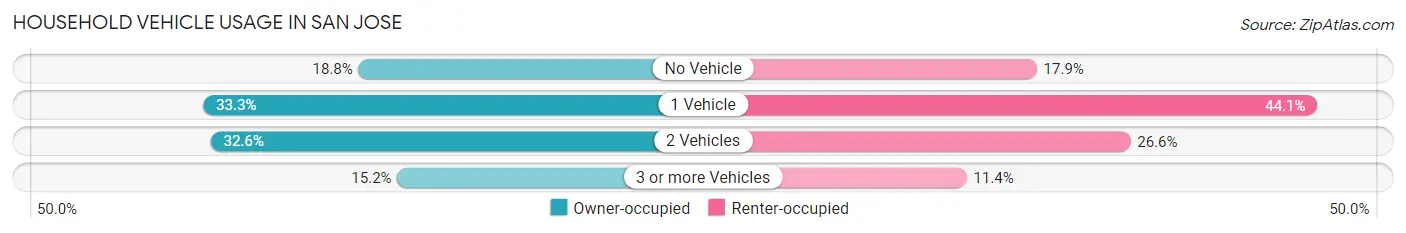
| Vehicles per Household | Owner-occupied | Renter-occupied |
| No Vehicle | 109 (18.8%) | 41 (17.9%) |
| 1 Vehicle | 193 (33.3%) | 101 (44.1%) |
| 2 Vehicles | 189 (32.6%) | 61 (26.6%) |
| 3 or more Vehicles | 88 (15.2%) | 26 (11.4%) |
| Total | 579 (100.0%) | 229 (100.0%) |
Real Estate & Mortgages in San Jose
Real Estate and Mortgage Overview in San Jose
| Characteristic | Without Mortgage | With Mortgage |
| Housing Units | 467 | 112 |
| Median Property Value | $57,600 | $88,000 |
| Median Household Income | $12,092 | $0 |
| Monthly Housing Costs | $143 | $0 |
| Real Estate Taxes | - | - |
Property Value by Mortgage Status in San Jose
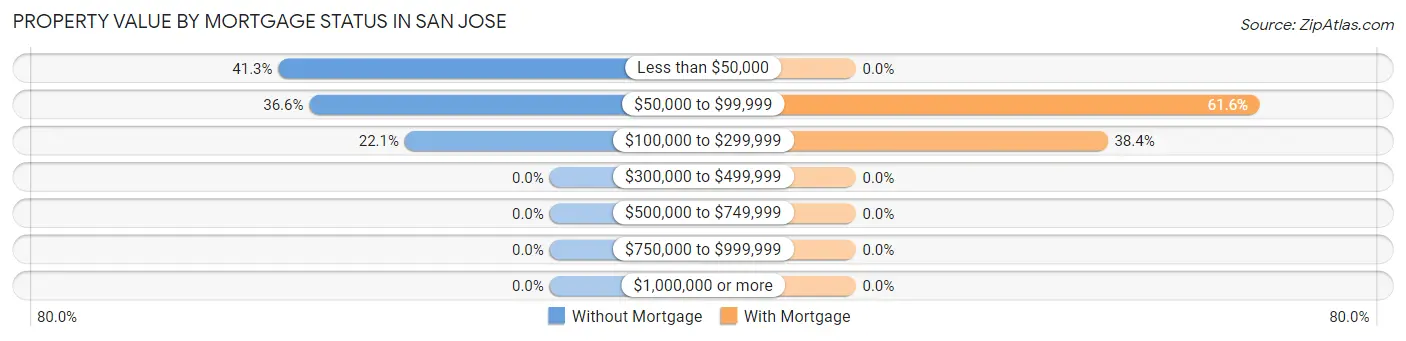
| Property Value | Without Mortgage | With Mortgage |
| Less than $50,000 | 193 (41.3%) | 0 (0.0%) |
| $50,000 to $99,999 | 171 (36.6%) | 69 (61.6%) |
| $100,000 to $299,999 | 103 (22.1%) | 43 (38.4%) |
| $300,000 to $499,999 | 0 (0.0%) | 0 (0.0%) |
| $500,000 to $749,999 | 0 (0.0%) | 0 (0.0%) |
| $750,000 to $999,999 | 0 (0.0%) | 0 (0.0%) |
| $1,000,000 or more | 0 (0.0%) | 0 (0.0%) |
| Total | 467 (100.0%) | 112 (100.0%) |
Household Income by Mortgage Status in San Jose
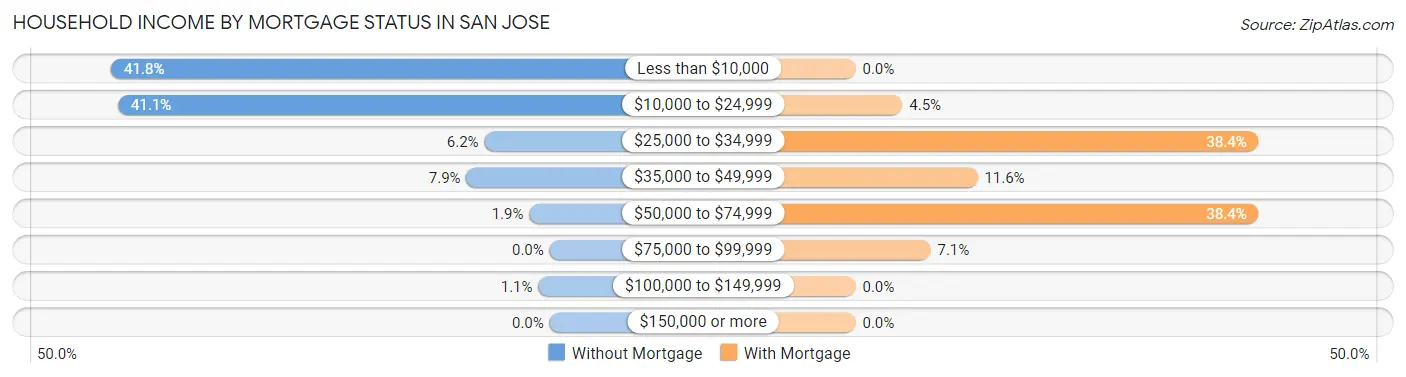
| Household Income | Without Mortgage | With Mortgage |
| Less than $10,000 | 195 (41.8%) | 0 (0.0%) |
| $10,000 to $24,999 | 192 (41.1%) | 5 (4.5%) |
| $25,000 to $34,999 | 29 (6.2%) | 43 (38.4%) |
| $35,000 to $49,999 | 37 (7.9%) | 13 (11.6%) |
| $50,000 to $74,999 | 9 (1.9%) | 43 (38.4%) |
| $75,000 to $99,999 | 0 (0.0%) | 8 (7.1%) |
| $100,000 to $149,999 | 5 (1.1%) | 0 (0.0%) |
| $150,000 or more | 0 (0.0%) | 0 (0.0%) |
| Total | 467 (100.0%) | 112 (100.0%) |
Property Value to Household Income Ratio in San Jose
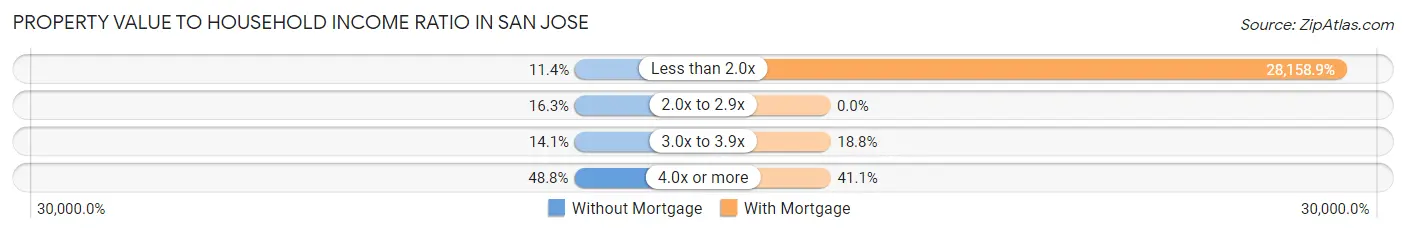
| Value-to-Income Ratio | Without Mortgage | With Mortgage |
| Less than 2.0x | 53 (11.4%) | 31,538 (28,158.9%) |
| 2.0x to 2.9x | 76 (16.3%) | 0 (0.0%) |
| 3.0x to 3.9x | 66 (14.1%) | 21 (18.8%) |
| 4.0x or more | 228 (48.8%) | 46 (41.1%) |
| Total | 467 (100.0%) | 112 (100.0%) |
Real Estate Taxes by Mortgage Status in San Jose
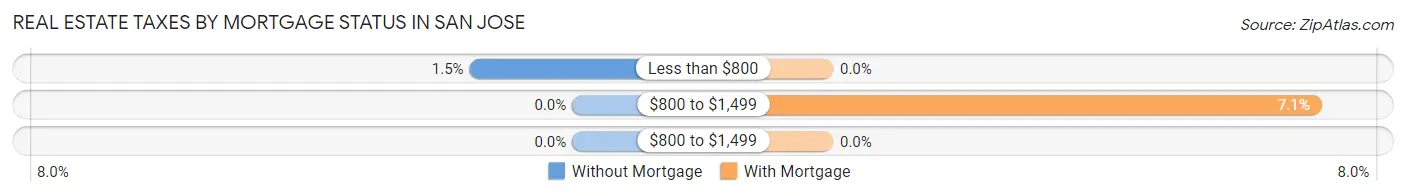
| Property Taxes | Without Mortgage | With Mortgage |
| Less than $800 | 7 (1.5%) | 0 (0.0%) |
| $800 to $1,499 | 0 (0.0%) | 8 (7.1%) |
| $800 to $1,499 | 0 (0.0%) | 0 (0.0%) |
| Total | 467 (100.0%) | 112 (100.0%) |
Health & Disability in San Jose
Health Insurance Coverage by Age in San Jose
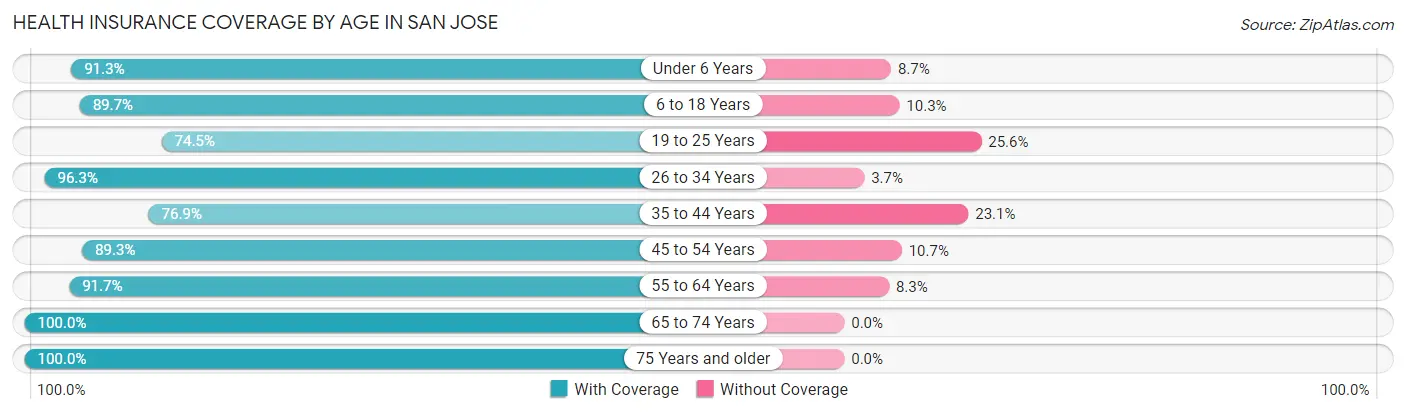
| Age Bracket | With Coverage | Without Coverage |
| Under 6 Years | 105 (91.3%) | 10 (8.7%) |
| 6 to 18 Years | 288 (89.7%) | 33 (10.3%) |
| 19 to 25 Years | 102 (74.5%) | 35 (25.6%) |
| 26 to 34 Years | 259 (96.3%) | 10 (3.7%) |
| 35 to 44 Years | 226 (76.9%) | 68 (23.1%) |
| 45 to 54 Years | 175 (89.3%) | 21 (10.7%) |
| 55 to 64 Years | 352 (91.7%) | 32 (8.3%) |
| 65 to 74 Years | 249 (100.0%) | 0 (0.0%) |
| 75 Years and older | 188 (100.0%) | 0 (0.0%) |
| Total | 1,944 (90.3%) | 209 (9.7%) |
Health Insurance Coverage by Citizenship Status in San Jose
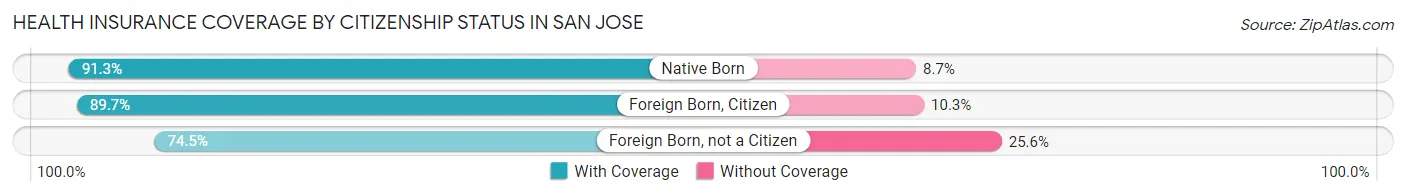
| Citizenship Status | With Coverage | Without Coverage |
| Native Born | 105 (91.3%) | 10 (8.7%) |
| Foreign Born, Citizen | 288 (89.7%) | 33 (10.3%) |
| Foreign Born, not a Citizen | 102 (74.5%) | 35 (25.6%) |
Health Insurance Coverage by Household Income in San Jose
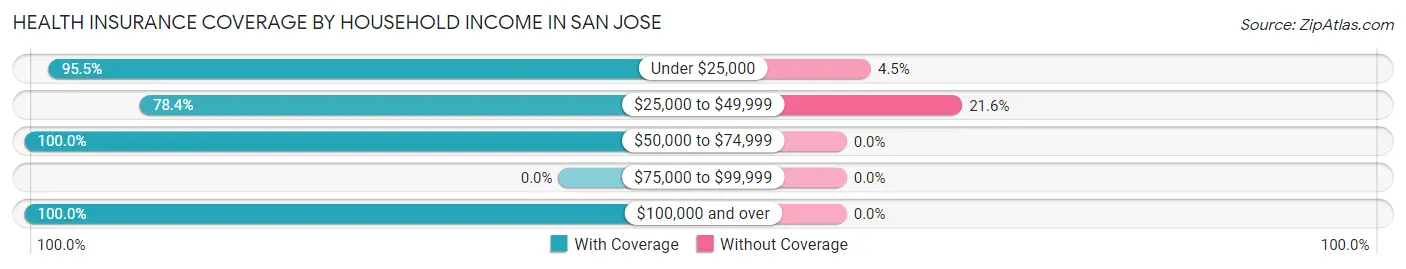
| Household Income | With Coverage | Without Coverage |
| Under $25,000 | 1,326 (95.5%) | 63 (4.5%) |
| $25,000 to $49,999 | 529 (78.4%) | 146 (21.6%) |
| $50,000 to $74,999 | 84 (100.0%) | 0 (0.0%) |
| $75,000 to $99,999 | 0 (0.0%) | 0 (0.0%) |
| $100,000 and over | 5 (100.0%) | 0 (0.0%) |
Public vs Private Health Insurance Coverage by Age in San Jose
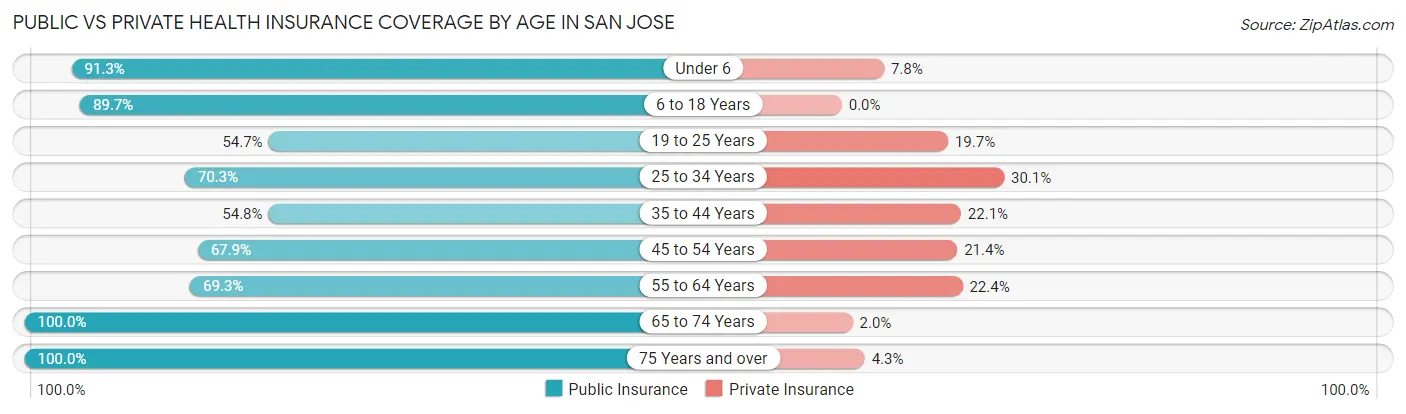
| Age Bracket | Public Insurance | Private Insurance |
| Under 6 | 105 (91.3%) | 9 (7.8%) |
| 6 to 18 Years | 288 (89.7%) | 0 (0.0%) |
| 19 to 25 Years | 75 (54.7%) | 27 (19.7%) |
| 25 to 34 Years | 189 (70.3%) | 81 (30.1%) |
| 35 to 44 Years | 161 (54.8%) | 65 (22.1%) |
| 45 to 54 Years | 133 (67.9%) | 42 (21.4%) |
| 55 to 64 Years | 266 (69.3%) | 86 (22.4%) |
| 65 to 74 Years | 249 (100.0%) | 5 (2.0%) |
| 75 Years and over | 188 (100.0%) | 8 (4.3%) |
| Total | 1,654 (76.8%) | 323 (15.0%) |
Disability Status by Sex by Age in San Jose
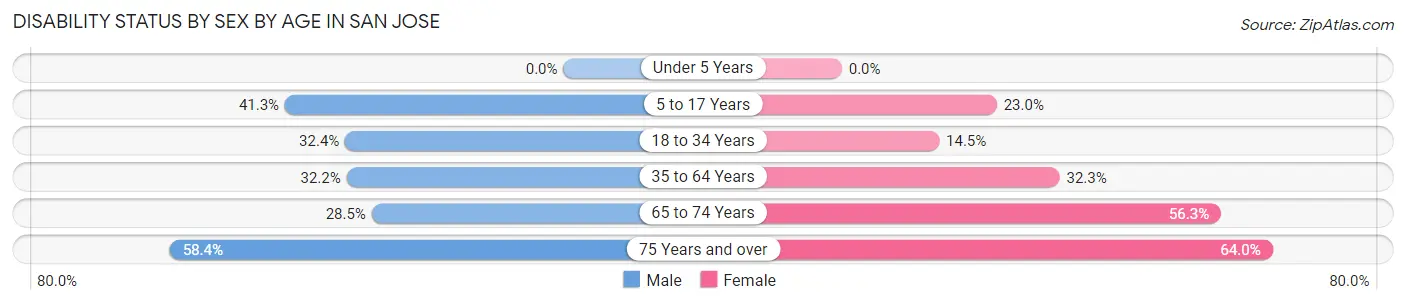
| Age Bracket | Male | Female |
| Under 5 Years | 0 (0.0%) | 0 (0.0%) |
| 5 to 17 Years | 74 (41.3%) | 26 (23.0%) |
| 18 to 34 Years | 58 (32.4%) | 38 (14.4%) |
| 35 to 64 Years | 131 (32.2%) | 151 (32.3%) |
| 65 to 74 Years | 37 (28.5%) | 67 (56.3%) |
| 75 Years and over | 45 (58.4%) | 71 (64.0%) |
Disability Class by Sex by Age in San Jose
Disability Class: Hearing Difficulty
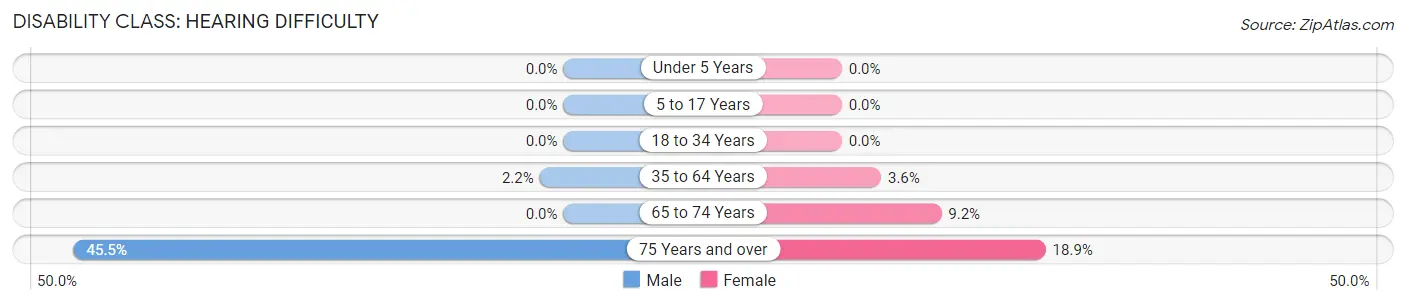
| Age Bracket | Male | Female |
| Under 5 Years | 0 (0.0%) | 0 (0.0%) |
| 5 to 17 Years | 0 (0.0%) | 0 (0.0%) |
| 18 to 34 Years | 0 (0.0%) | 0 (0.0%) |
| 35 to 64 Years | 9 (2.2%) | 17 (3.6%) |
| 65 to 74 Years | 0 (0.0%) | 11 (9.2%) |
| 75 Years and over | 35 (45.5%) | 21 (18.9%) |
Disability Class: Vision Difficulty
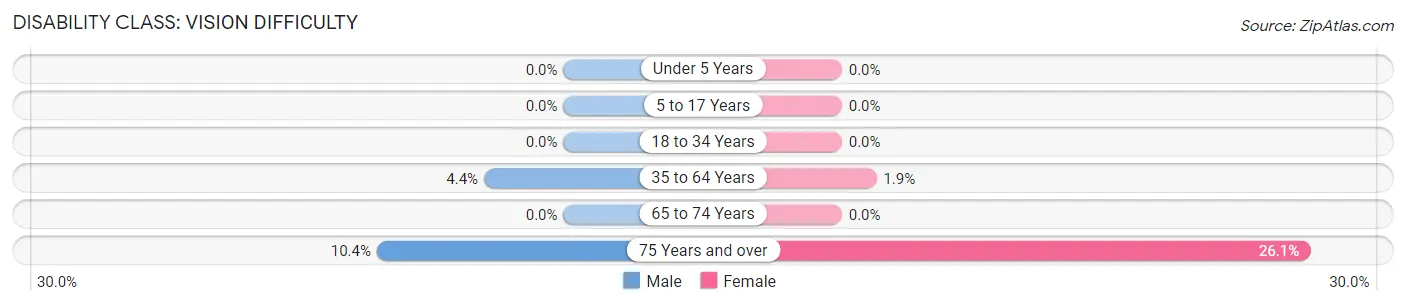
| Age Bracket | Male | Female |
| Under 5 Years | 0 (0.0%) | 0 (0.0%) |
| 5 to 17 Years | 0 (0.0%) | 0 (0.0%) |
| 18 to 34 Years | 0 (0.0%) | 0 (0.0%) |
| 35 to 64 Years | 18 (4.4%) | 9 (1.9%) |
| 65 to 74 Years | 0 (0.0%) | 0 (0.0%) |
| 75 Years and over | 8 (10.4%) | 29 (26.1%) |
Disability Class: Cognitive Difficulty
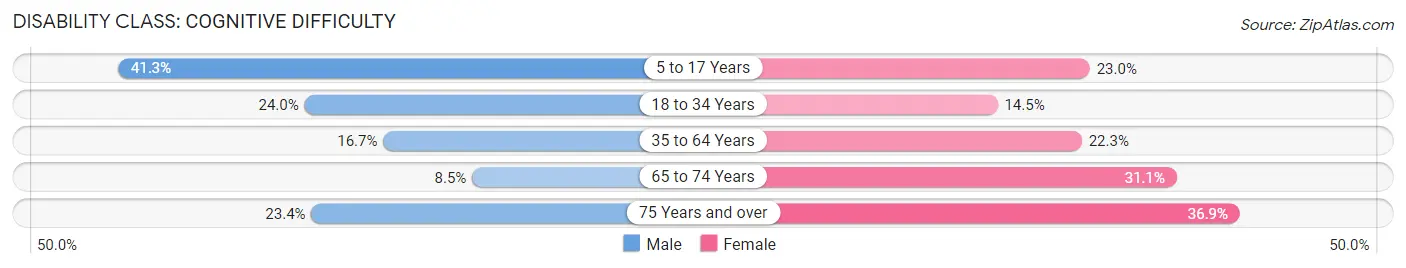
| Age Bracket | Male | Female |
| 5 to 17 Years | 74 (41.3%) | 26 (23.0%) |
| 18 to 34 Years | 43 (24.0%) | 38 (14.4%) |
| 35 to 64 Years | 68 (16.7%) | 104 (22.3%) |
| 65 to 74 Years | 11 (8.5%) | 37 (31.1%) |
| 75 Years and over | 18 (23.4%) | 41 (36.9%) |
Disability Class: Ambulatory Difficulty
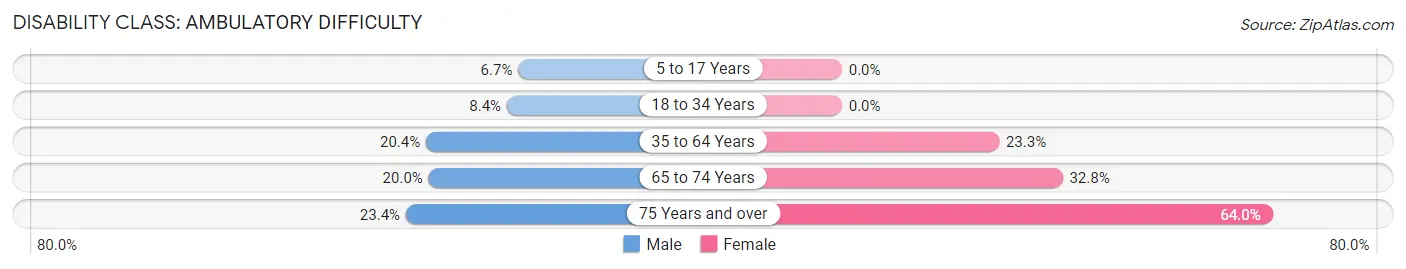
| Age Bracket | Male | Female |
| 5 to 17 Years | 12 (6.7%) | 0 (0.0%) |
| 18 to 34 Years | 15 (8.4%) | 0 (0.0%) |
| 35 to 64 Years | 83 (20.4%) | 109 (23.3%) |
| 65 to 74 Years | 26 (20.0%) | 39 (32.8%) |
| 75 Years and over | 18 (23.4%) | 71 (64.0%) |
Disability Class: Self-Care Difficulty
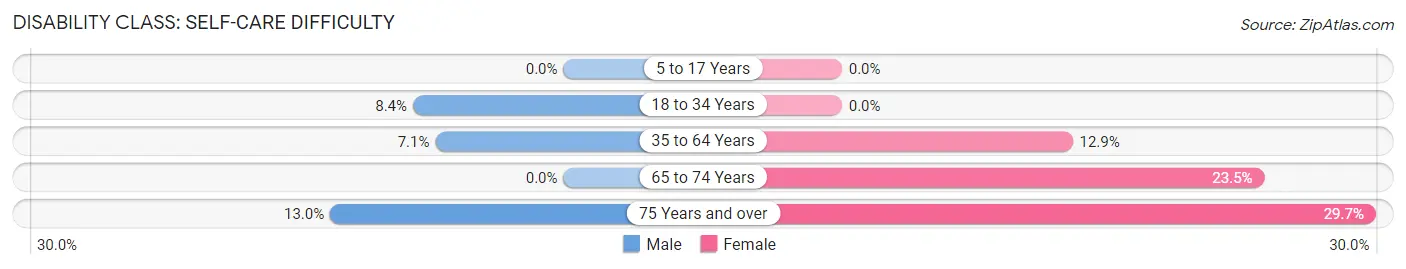
| Age Bracket | Male | Female |
| 5 to 17 Years | 0 (0.0%) | 0 (0.0%) |
| 18 to 34 Years | 15 (8.4%) | 0 (0.0%) |
| 35 to 64 Years | 29 (7.1%) | 60 (12.9%) |
| 65 to 74 Years | 0 (0.0%) | 28 (23.5%) |
| 75 Years and over | 10 (13.0%) | 33 (29.7%) |
Technology Access in San Jose
Computing Device Access in San Jose
| Device Type | # Households | % Households |
| Desktop or Laptop | 220 | 27.2% |
| Smartphone | 666 | 82.4% |
| Tablet | 213 | 26.4% |
| No Computing Device | 136 | 16.8% |
| Total | 808 | 100.0% |
Internet Access in San Jose
| Internet Type | # Households | % Households |
| Dial-Up Internet | 5 | 0.6% |
| Broadband Home | 283 | 35.0% |
| Cellular Data Only | 170 | 21.0% |
| Satellite Internet | 27 | 3.3% |
| No Internet | 331 | 41.0% |
| Total | 808 | 100.0% |
San Jose Summary
San Jose, Puerto Rico is a municipality located in the central region of the island of Puerto Rico. It is the capital of the island and the seat of the government of Puerto Rico. San Jose is the second most populous municipality in Puerto Rico, with a population of approximately 140,000 people as of the 2010 census.
History
San Jose was founded in 1775 by Spanish settlers, who named it after Saint Joseph. It was the first capital of Puerto Rico and served as the seat of government until 1815, when the capital was moved to San Juan. During the 19th century, San Jose was an important center of commerce and industry, and it was the site of the first sugar mill in Puerto Rico.
In 1898, San Jose was occupied by the United States during the Spanish-American War. After the war, the city became a major center of commerce and industry, and it was the site of the first electric power plant in Puerto Rico.
Geography
San Jose is located in the central region of Puerto Rico, in the Caguas Valley. It is bordered by the municipalities of Caguas, Gurabo, and San Lorenzo. The city is situated at an elevation of approximately 1,000 feet (305 meters) above sea level.
The municipality covers an area of approximately 24 square miles (62 square kilometers). The terrain is mostly flat, with some hills in the northern part of the municipality. The climate is tropical, with temperatures ranging from the mid-70s to the mid-80s Fahrenheit (21-30 Celsius).
Economy
San Jose is an important center of commerce and industry in Puerto Rico. The city is home to several large manufacturing plants, including a pharmaceutical plant, a food processing plant, and a paper mill. The city is also home to several banks and financial institutions.
The city is a major tourist destination, with several attractions, including the San Jose Cathedral, the San Jose Museum of Art, and the San Jose Municipal Theater. The city is also home to several universities, including the University of Puerto Rico at San Jose.
Demographics
As of the 2010 census, San Jose had a population of approximately 140,000 people. The population is predominantly of Puerto Rican descent, with a small minority of other ethnicities, including African, Asian, and European. The median age of the population is 33.5 years, and the median household income is $20,000. The city has a high rate of poverty, with approximately 40% of the population living below the poverty line.
Common Questions
What is Per Capita Income in San Jose?
Per Capita income in San Jose is $8,113.
What is the Median Family Income in San Jose?
Median Family Income in San Jose is $17,440.
What is the Median Household income in San Jose?
Median Household Income in San Jose is $16,011.
What is Income or Wage Gap in San Jose?
Income or Wage Gap in San Jose is 0.9%.
Women in San Jose earn 99.1 cents for every dollar earned by a man.
What is Inequality or Gini Index in San Jose?
Inequality or Gini Index in San Jose is 0.45.
What is the Total Population of San Jose?
Total Population of San Jose is 2,153.
What is the Total Male Population of San Jose?
Total Male Population of San Jose is 1,013.
What is the Total Female Population of San Jose?
Total Female Population of San Jose is 1,140.
What is the Ratio of Males per 100 Females in San Jose?
There are 88.86 Males per 100 Females in San Jose.
What is the Ratio of Females per 100 Males in San Jose?
There are 112.54 Females per 100 Males in San Jose.
What is the Median Population Age in San Jose?
Median Population Age in San Jose is 42.8 Years.
What is the Average Family Size in San Jose
Average Family Size in San Jose is 3.4 People.
What is the Average Household Size in San Jose
Average Household Size in San Jose is 2.7 People.
How Large is the Labor Force in San Jose?
There are 760 People in the Labor Forcein in San Jose.
What is the Percentage of People in the Labor Force in San Jose?
40.9% of People are in the Labor Force in San Jose.
What is the Unemployment Rate in San Jose?
Unemployment Rate in San Jose is 12.4%.