Vazquez, PR Map & Demographics
Vazquez Overview
$11,009
PER CAPITA INCOME
$21,949
AVG FAMILY INCOME
$13,750
AVG HOUSEHOLD INCOME
0.55
INEQUALITY / GINI INDEX
1,692
TOTAL POPULATION
893
MALE POPULATION
799
FEMALE POPULATION
111.76
MALES / 100 FEMALES
89.47
FEMALES / 100 MALES
50.9
MEDIAN AGE
3.1
AVG FAMILY SIZE
2.3
AVG HOUSEHOLD SIZE
563
LABOR FORCE [ PEOPLE ]
35.0%
PERCENT IN LABOR FORCE
11.7%
UNEMPLOYMENT RATE
Income in Vazquez
Income Overview in Vazquez
Per Capita Income in Vazquez is $11,009, while median incomes of families and households are $21,949 and $13,750 respectively.
| Characteristic | Number | Measure |
| Per Capita Income | 1,692 | $11,009 |
| Median Family Income | 405 | $21,949 |
| Mean Family Income | 405 | $34,499 |
| Median Household Income | 734 | $13,750 |
| Mean Household Income | 734 | $22,870 |
| Income Deficit | 405 | $0 |
| Wage / Income Gap (%) | 1,692 | 0.00% |
| Wage / Income Gap ($) | 1,692 | 100.00¢ per $1 |
| Gini / Inequality Index | 1,692 | 0.55 |
Earnings by Sex in Vazquez
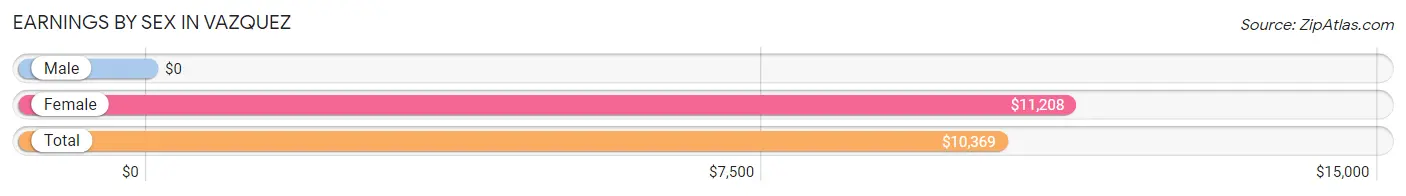
| Sex | Number | Average Earnings |
| Male | 346 (59.6%) | $0 |
| Female | 235 (40.5%) | $11,208 |
| Total | 581 (100.0%) | $10,369 |
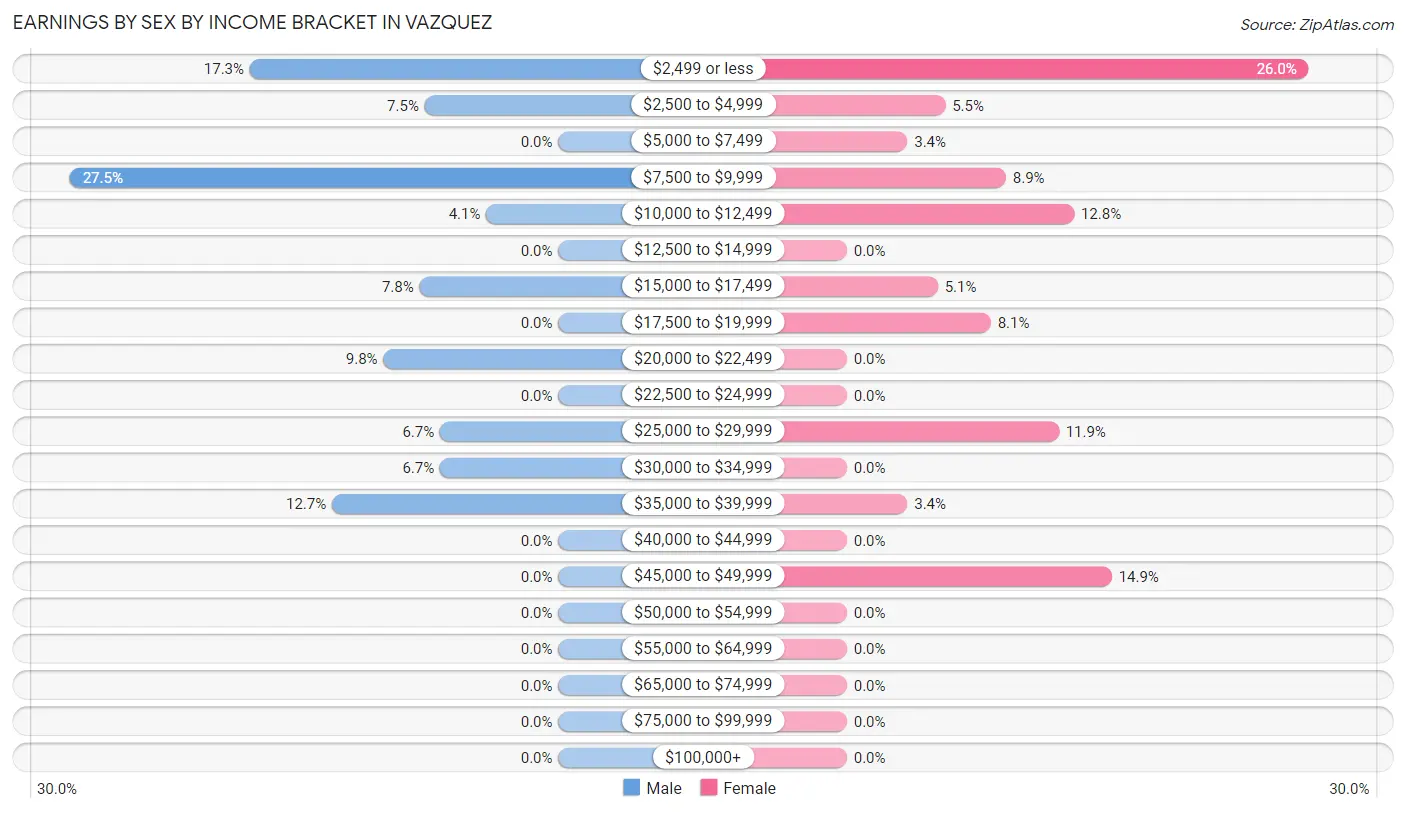
Earnings by Sex by Income Bracket in Vazquez
The most common earnings brackets in Vazquez are $7,500 to $9,999 for men (95 | 27.5%) and $2,499 or less for women (61 | 26.0%).
| Income | Male | Female |
| $2,499 or less | 60 (17.3%) | 61 (26.0%) |
| $2,500 to $4,999 | 26 (7.5%) | 13 (5.5%) |
| $5,000 to $7,499 | 0 (0.0%) | 8 (3.4%) |
| $7,500 to $9,999 | 95 (27.5%) | 21 (8.9%) |
| $10,000 to $12,499 | 14 (4.1%) | 30 (12.8%) |
| $12,500 to $14,999 | 0 (0.0%) | 0 (0.0%) |
| $15,000 to $17,499 | 27 (7.8%) | 12 (5.1%) |
| $17,500 to $19,999 | 0 (0.0%) | 19 (8.1%) |
| $20,000 to $22,499 | 34 (9.8%) | 0 (0.0%) |
| $22,500 to $24,999 | 0 (0.0%) | 0 (0.0%) |
| $25,000 to $29,999 | 23 (6.7%) | 28 (11.9%) |
| $30,000 to $34,999 | 23 (6.7%) | 0 (0.0%) |
| $35,000 to $39,999 | 44 (12.7%) | 8 (3.4%) |
| $40,000 to $44,999 | 0 (0.0%) | 0 (0.0%) |
| $45,000 to $49,999 | 0 (0.0%) | 35 (14.9%) |
| $50,000 to $54,999 | 0 (0.0%) | 0 (0.0%) |
| $55,000 to $64,999 | 0 (0.0%) | 0 (0.0%) |
| $65,000 to $74,999 | 0 (0.0%) | 0 (0.0%) |
| $75,000 to $99,999 | 0 (0.0%) | 0 (0.0%) |
| $100,000+ | 0 (0.0%) | 0 (0.0%) |
| Total | 346 (100.0%) | 235 (100.0%) |
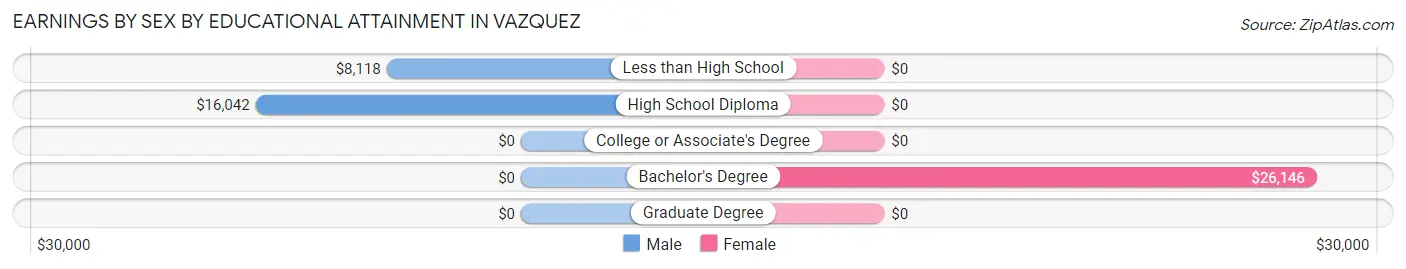
Earnings by Sex by Educational Attainment in Vazquez
Average earnings in Vazquez are $9,487 for men and $11,750 for women, a difference of 19.3%. Men with an educational attainment of high school diploma enjoy the highest average annual earnings of $16,042, while those with less than high school education earn the least with $8,118. Women with an educational attainment of bachelor's degree earn the most with the average annual earnings of $26,146, while those with bachelor's degree education have the smallest earnings of $26,146.
| Educational Attainment | Male Income | Female Income |
| Less than High School | $8,118 | $0 |
| High School Diploma | $16,042 | $0 |
| College or Associate's Degree | - | - |
| Bachelor's Degree | - | - |
| Graduate Degree | - | - |
| Total | $9,487 | $11,750 |
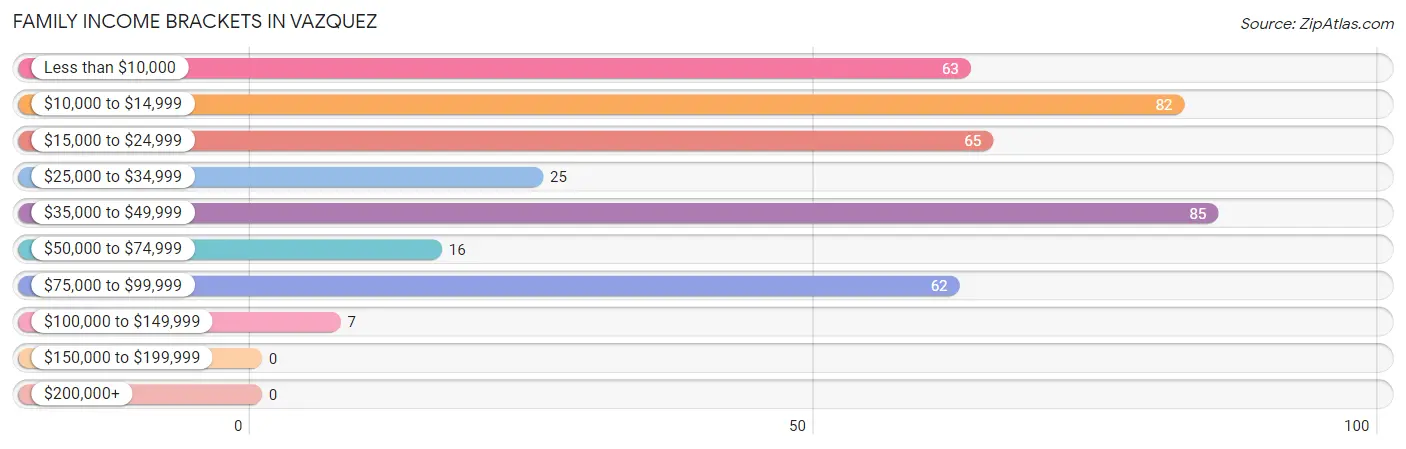
Family Income in Vazquez
Family Income Brackets in Vazquez
According to the Vazquez family income data, there are 85 families falling into the $35,000 to $49,999 income range, which is the most common income bracket and makes up 21.0% of all families.
| Income Bracket | # Families | % Families |
| Less than $10,000 | 63 | 15.6% |
| $10,000 to $14,999 | 82 | 20.2% |
| $15,000 to $24,999 | 65 | 16.0% |
| $25,000 to $34,999 | 25 | 6.2% |
| $35,000 to $49,999 | 85 | 21.0% |
| $50,000 to $74,999 | 16 | 4.0% |
| $75,000 to $99,999 | 62 | 15.3% |
| $100,000 to $149,999 | 7 | 1.7% |
| $150,000 to $199,999 | 0 | 0.0% |
| $200,000+ | 0 | 0.0% |
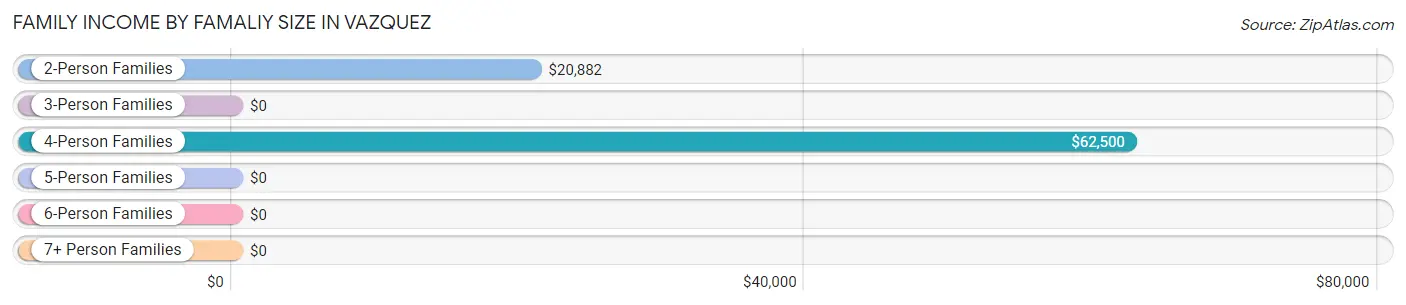
Family Income by Famaliy Size in Vazquez
4-person families (50 | 12.3%) account for the highest median family income in Vazquez with $62,500 per family, while 4-person families (50 | 12.3%) have the highest median income of $15,625 per family member.
| Income Bracket | # Families | Median Income |
| 2-Person Families | 284 (70.1%) | $20,882 |
| 3-Person Families | 71 (17.5%) | $0 |
| 4-Person Families | 50 (12.3%) | $62,500 |
| 5-Person Families | 0 (0.0%) | $0 |
| 6-Person Families | 0 (0.0%) | $0 |
| 7+ Person Families | 0 (0.0%) | $0 |
| Total | 405 (100.0%) | $21,949 |
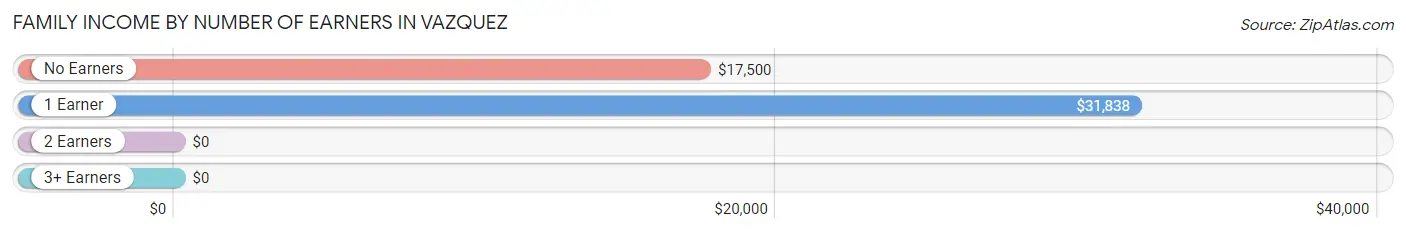
Family Income by Number of Earners in Vazquez
| Number of Earners | # Families | Median Income |
| No Earners | 162 (40.0%) | $17,500 |
| 1 Earner | 127 (31.4%) | $31,838 |
| 2 Earners | 116 (28.6%) | $0 |
| 3+ Earners | 0 (0.0%) | $0 |
| Total | 405 (100.0%) | $21,949 |
Household Income in Vazquez
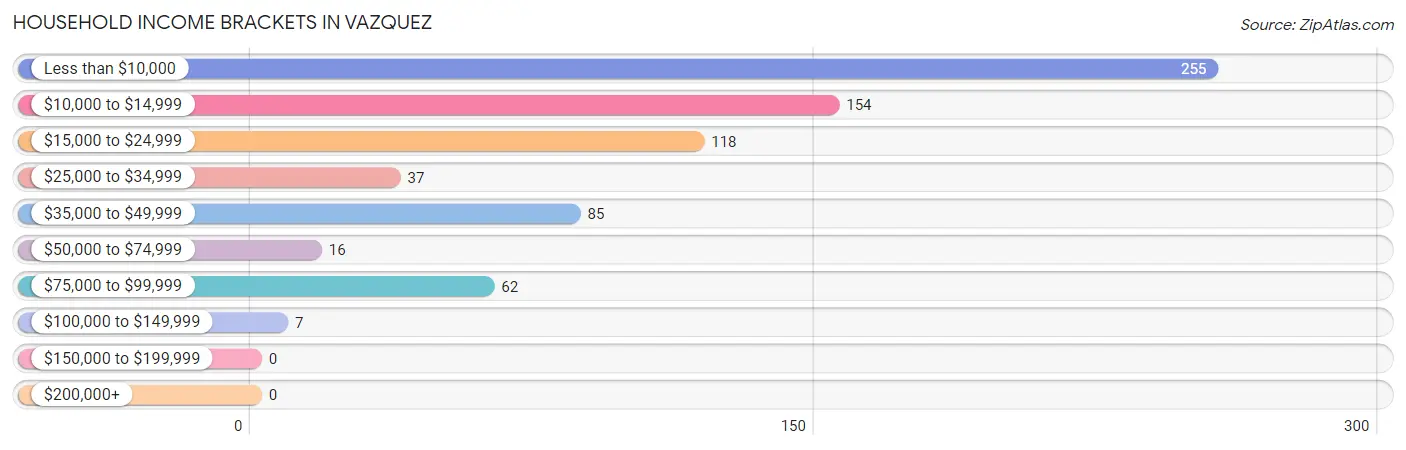
Household Income Brackets in Vazquez
With 255 households falling in the category, the less than $10,000 income range is the most frequent in Vazquez, accounting for 34.7% of all households.
| Income Bracket | # Households | % Households |
| Less than $10,000 | 255 | 34.7% |
| $10,000 to $14,999 | 154 | 21.0% |
| $15,000 to $24,999 | 118 | 16.1% |
| $25,000 to $34,999 | 37 | 5.0% |
| $35,000 to $49,999 | 85 | 11.6% |
| $50,000 to $74,999 | 16 | 2.2% |
| $75,000 to $99,999 | 62 | 8.4% |
| $100,000 to $149,999 | 7 | 1.0% |
| $150,000 to $199,999 | 0 | 0.0% |
| $200,000+ | 0 | 0.0% |
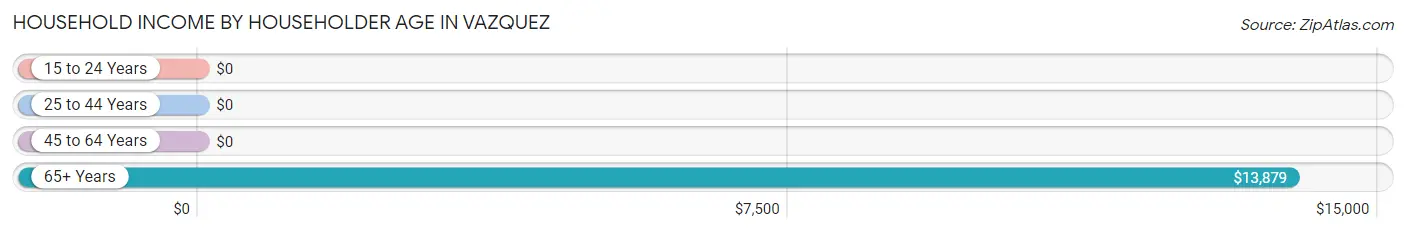
Household Income by Householder Age in Vazquez
The median household income in Vazquez is $13,750, with the highest median household income of $13,879 found in the 65+ years age bracket for the primary householder. A total of 346 households (47.1%) fall into this category.
| Income Bracket | # Households | Median Income |
| 15 to 24 Years | 0 (0.0%) | $0 |
| 25 to 44 Years | 198 (27.0%) | $0 |
| 45 to 64 Years | 190 (25.9%) | $0 |
| 65+ Years | 346 (47.1%) | $13,879 |
| Total | 734 (100.0%) | $13,750 |
Poverty in Vazquez
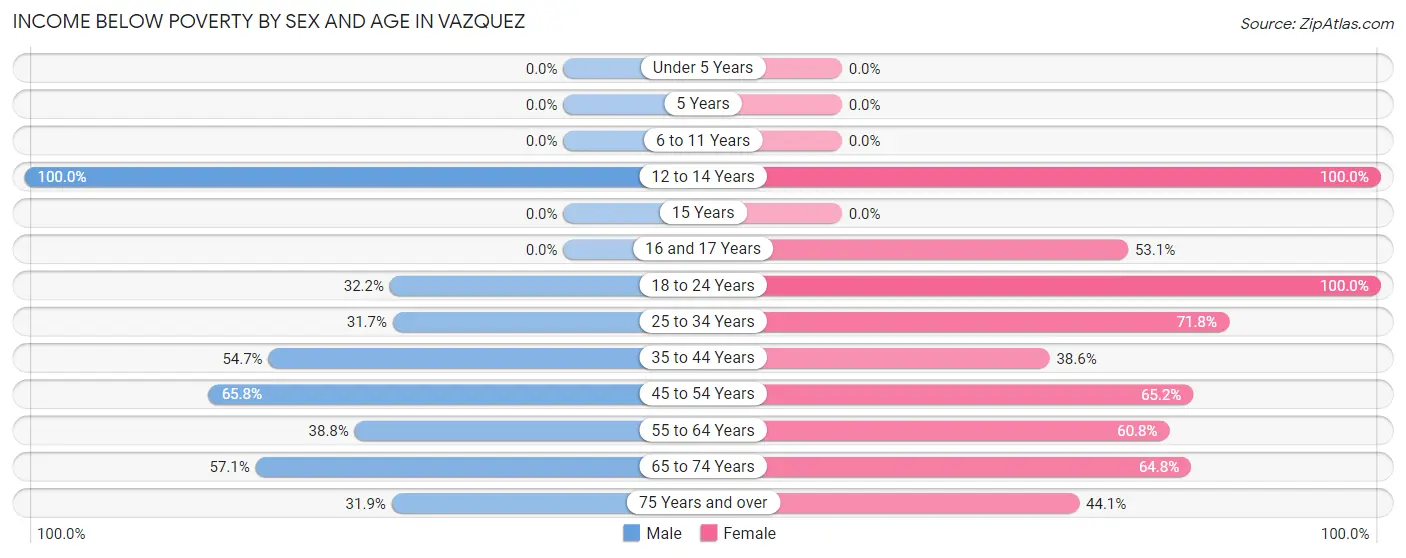
Income Below Poverty by Sex and Age in Vazquez
With 45.6% poverty level for males and 60.0% for females among the residents of Vazquez, 12 to 14 year old males and 12 to 14 year old females are the most vulnerable to poverty, with 17 males (100.0%) and 23 females (100.0%) in their respective age groups living below the poverty level.
| Age Bracket | Male | Female |
| Under 5 Years | 0 (0.0%) | 0 (0.0%) |
| 5 Years | 0 (0.0%) | 0 (0.0%) |
| 6 to 11 Years | 0 (0.0%) | 0 (0.0%) |
| 12 to 14 Years | 17 (100.0%) | 23 (100.0%) |
| 15 Years | 0 (0.0%) | 0 (0.0%) |
| 16 and 17 Years | 0 (0.0%) | 17 (53.1%) |
| 18 to 24 Years | 29 (32.2%) | 27 (100.0%) |
| 25 to 34 Years | 44 (31.7%) | 79 (71.8%) |
| 35 to 44 Years | 75 (54.7%) | 32 (38.6%) |
| 45 to 54 Years | 102 (65.8%) | 60 (65.2%) |
| 55 to 64 Years | 31 (38.8%) | 62 (60.8%) |
| 65 to 74 Years | 80 (57.1%) | 105 (64.8%) |
| 75 Years and over | 29 (31.9%) | 74 (44.1%) |
| Total | 407 (45.6%) | 479 (60.0%) |
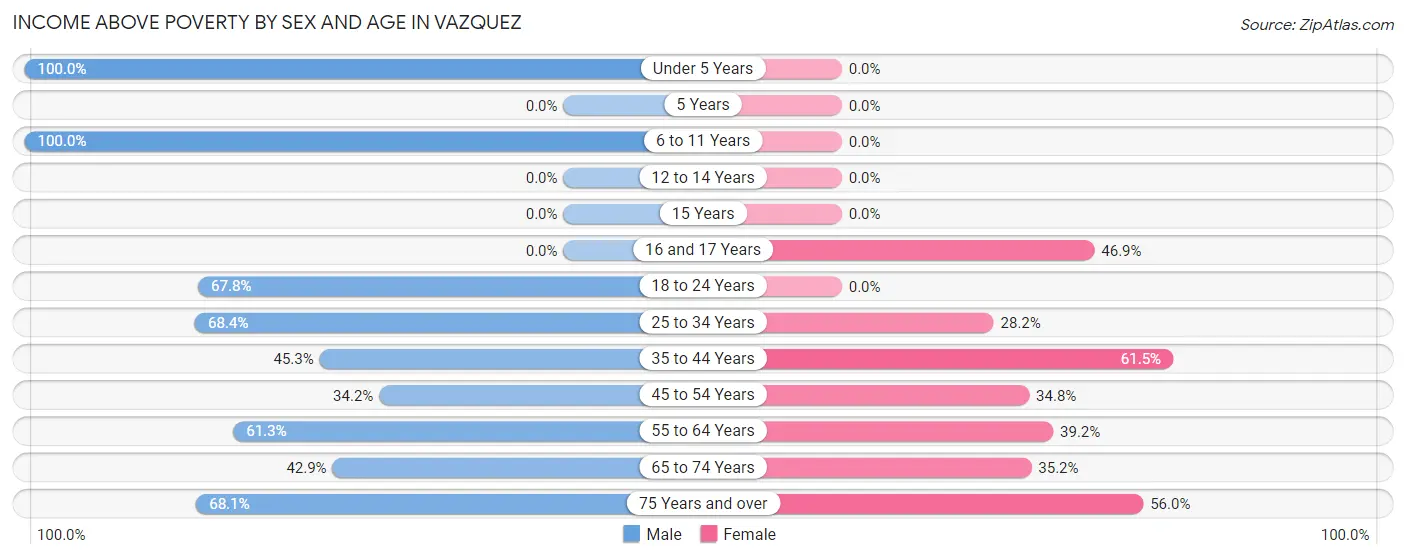
Income Above Poverty by Sex and Age in Vazquez
According to the poverty statistics in Vazquez, males aged under 5 years and females aged 35 to 44 years are the age groups that are most secure financially, with 100.0% of males and 61.5% of females in these age groups living above the poverty line.
| Age Bracket | Male | Female |
| Under 5 Years | 25 (100.0%) | 0 (0.0%) |
| 5 Years | 0 (0.0%) | 0 (0.0%) |
| 6 to 11 Years | 19 (100.0%) | 0 (0.0%) |
| 12 to 14 Years | 0 (0.0%) | 0 (0.0%) |
| 15 Years | 0 (0.0%) | 0 (0.0%) |
| 16 and 17 Years | 0 (0.0%) | 15 (46.9%) |
| 18 to 24 Years | 61 (67.8%) | 0 (0.0%) |
| 25 to 34 Years | 95 (68.3%) | 31 (28.2%) |
| 35 to 44 Years | 62 (45.3%) | 51 (61.5%) |
| 45 to 54 Years | 53 (34.2%) | 32 (34.8%) |
| 55 to 64 Years | 49 (61.3%) | 40 (39.2%) |
| 65 to 74 Years | 60 (42.9%) | 57 (35.2%) |
| 75 Years and over | 62 (68.1%) | 94 (55.9%) |
| Total | 486 (54.4%) | 320 (40.1%) |
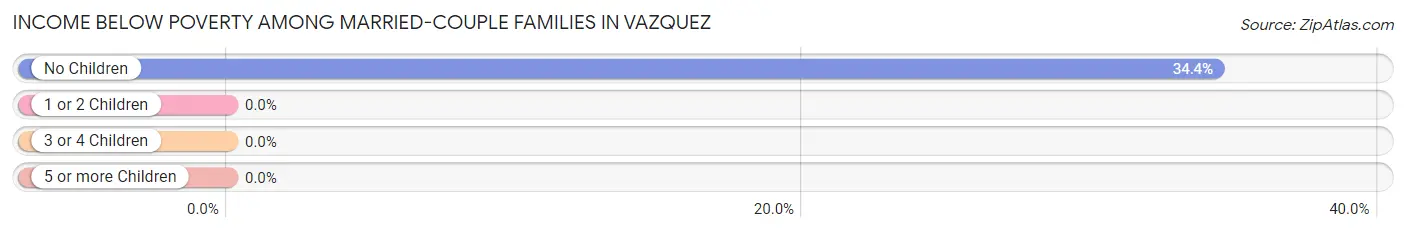
Income Below Poverty Among Married-Couple Families in Vazquez
The poverty statistics for married-couple families in Vazquez show that 32.7% or 67 of the total 205 families live below the poverty line. Families with no children have the highest poverty rate of 34.4%, comprising of 67 families. On the other hand, families with 1 or 2 children have the lowest poverty rate of 0.0%, which includes 0 families.
| Children | Above Poverty | Below Poverty |
| No Children | 128 (65.6%) | 67 (34.4%) |
| 1 or 2 Children | 10 (100.0%) | 0 (0.0%) |
| 3 or 4 Children | 0 (0.0%) | 0 (0.0%) |
| 5 or more Children | 0 (0.0%) | 0 (0.0%) |
| Total | 138 (67.3%) | 67 (32.7%) |
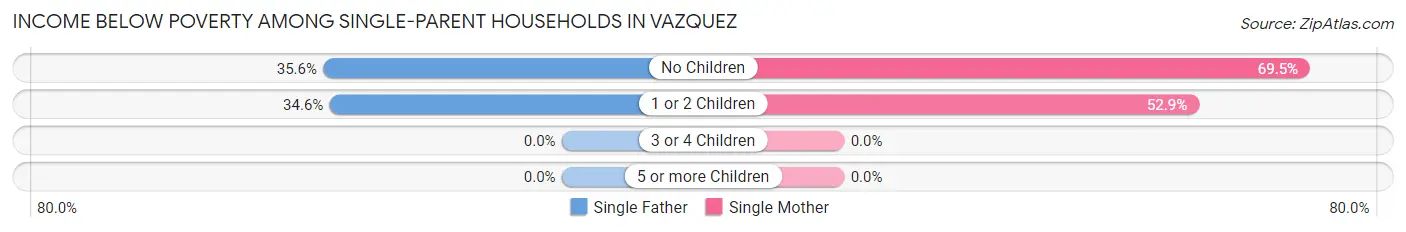
Income Below Poverty Among Single-Parent Households in Vazquez
According to the poverty data in Vazquez, 35.2% or 25 single-father households and 65.1% or 84 single-mother households are living below the poverty line. Among single-father households, those with no children have the highest poverty rate, with 16 households (35.6%) experiencing poverty. Likewise, among single-mother households, those with no children have the highest poverty rate, with 66 households (69.5%) falling below the poverty line.
| Children | Single Father | Single Mother |
| No Children | 16 (35.6%) | 66 (69.5%) |
| 1 or 2 Children | 9 (34.6%) | 18 (52.9%) |
| 3 or 4 Children | 0 (0.0%) | 0 (0.0%) |
| 5 or more Children | 0 (0.0%) | 0 (0.0%) |
| Total | 25 (35.2%) | 84 (65.1%) |
Income Below Poverty Among Married-Couple vs Single-Parent Households in Vazquez
The poverty data for Vazquez shows that 67 of the married-couple family households (32.7%) and 109 of the single-parent households (54.5%) are living below the poverty level. Within the married-couple family households, those with no children have the highest poverty rate, with 67 households (34.4%) falling below the poverty line. Among the single-parent households, those with no children have the highest poverty rate, with 82 household (58.6%) living below poverty.
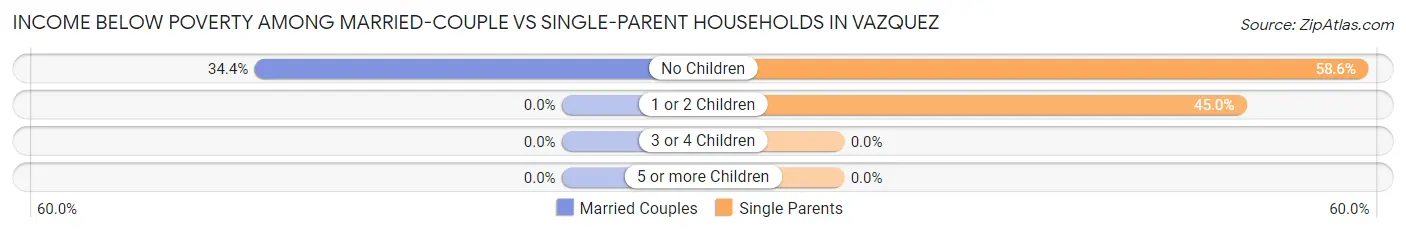
| Children | Married-Couple Families | Single-Parent Households |
| No Children | 67 (34.4%) | 82 (58.6%) |
| 1 or 2 Children | 0 (0.0%) | 27 (45.0%) |
| 3 or 4 Children | 0 (0.0%) | 0 (0.0%) |
| 5 or more Children | 0 (0.0%) | 0 (0.0%) |
| Total | 67 (32.7%) | 109 (54.5%) |
Race in Vazquez
The most populous races in Vazquez are Hispanic or Latino (1,692 | 100.0%), Two or more Races (871 | 51.5%), and White / Caucasian (574 | 33.9%).
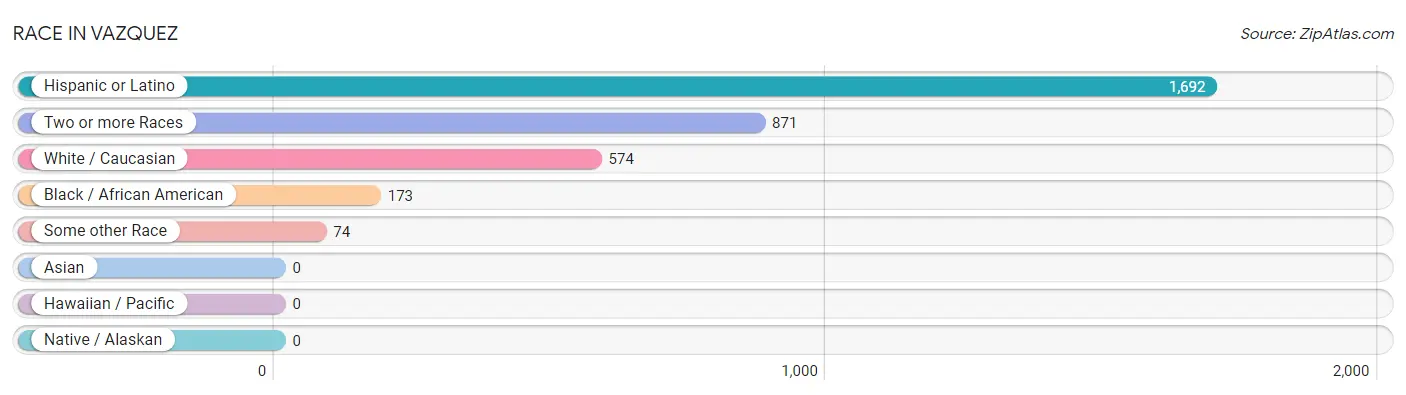
| Race | # Population | % Population |
| Asian | 0 | 0.0% |
| Black / African American | 173 | 10.2% |
| Hawaiian / Pacific | 0 | 0.0% |
| Hispanic or Latino | 1,692 | 100.0% |
| Native / Alaskan | 0 | 0.0% |
| White / Caucasian | 574 | 33.9% |
| Two or more Races | 871 | 51.5% |
| Some other Race | 74 | 4.4% |
| Total | 1,692 | 100.0% |
Ancestry in Vazquez
The most populous ancestries reported in Vazquez are Puerto Rican (1,677 | 99.1%), Mexican (15 | 0.9%), Central American Indian (13 | 0.8%), and American (9 | 0.5%), together accounting for 101.3% of all Vazquez residents.
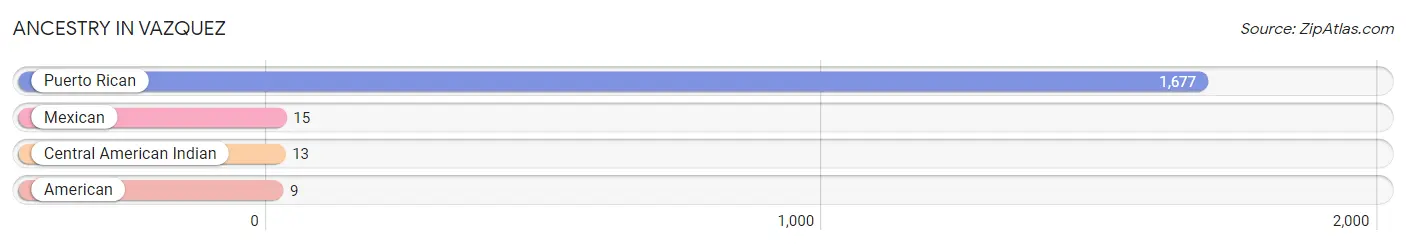
| Ancestry | # Population | % Population |
| American | 9 | 0.5% |
| Central American Indian | 13 | 0.8% |
| Mexican | 15 | 0.9% |
| Puerto Rican | 1,677 | 99.1% | View All 4 Rows |
Immigrants in Vazquez

| Immigration Origin | # Population | % Population | View All 0 Rows |
Sex and Age in Vazquez
Sex and Age in Vazquez
The most populous age groups in Vazquez are 40 to 44 Years (119 | 13.3%) for men and 60 to 64 Years (93 | 11.6%) for women.
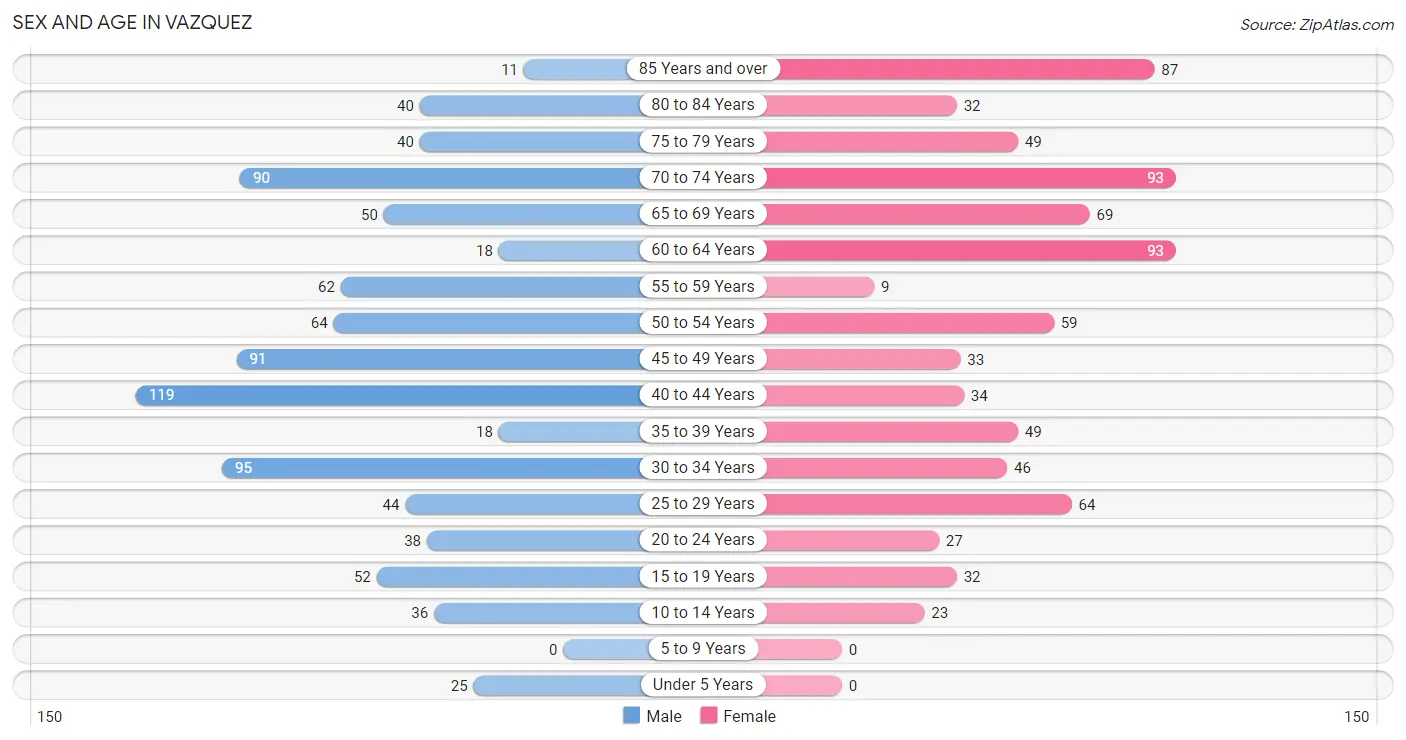
| Age Bracket | Male | Female |
| Under 5 Years | 25 (2.8%) | 0 (0.0%) |
| 5 to 9 Years | 0 (0.0%) | 0 (0.0%) |
| 10 to 14 Years | 36 (4.0%) | 23 (2.9%) |
| 15 to 19 Years | 52 (5.8%) | 32 (4.0%) |
| 20 to 24 Years | 38 (4.3%) | 27 (3.4%) |
| 25 to 29 Years | 44 (4.9%) | 64 (8.0%) |
| 30 to 34 Years | 95 (10.6%) | 46 (5.8%) |
| 35 to 39 Years | 18 (2.0%) | 49 (6.1%) |
| 40 to 44 Years | 119 (13.3%) | 34 (4.3%) |
| 45 to 49 Years | 91 (10.2%) | 33 (4.1%) |
| 50 to 54 Years | 64 (7.2%) | 59 (7.4%) |
| 55 to 59 Years | 62 (6.9%) | 9 (1.1%) |
| 60 to 64 Years | 18 (2.0%) | 93 (11.6%) |
| 65 to 69 Years | 50 (5.6%) | 69 (8.6%) |
| 70 to 74 Years | 90 (10.1%) | 93 (11.6%) |
| 75 to 79 Years | 40 (4.5%) | 49 (6.1%) |
| 80 to 84 Years | 40 (4.5%) | 32 (4.0%) |
| 85 Years and over | 11 (1.2%) | 87 (10.9%) |
| Total | 893 (100.0%) | 799 (100.0%) |
Families and Households in Vazquez
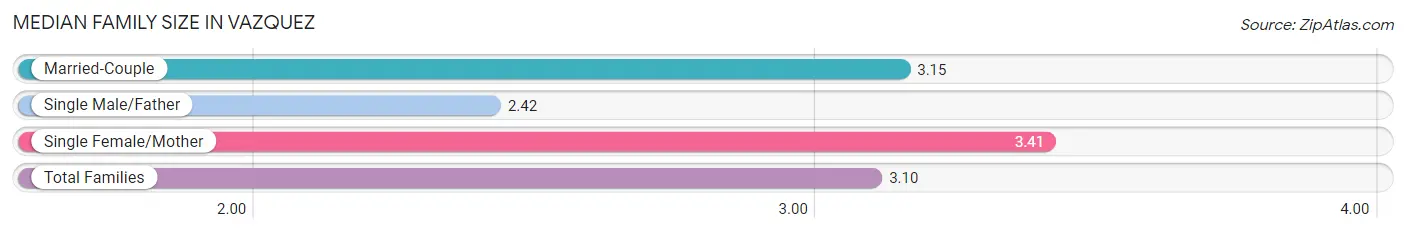
Median Family Size in Vazquez
The median family size in Vazquez is 3.10 persons per family, with single female/mother families (129 | 31.9%) accounting for the largest median family size of 3.41 persons per family. On the other hand, single male/father families (71 | 17.5%) represent the smallest median family size with 2.42 persons per family.
| Family Type | # Families | Family Size |
| Married-Couple | 205 (50.6%) | 3.15 |
| Single Male/Father | 71 (17.5%) | 2.42 |
| Single Female/Mother | 129 (31.9%) | 3.41 |
| Total Families | 405 (100.0%) | 3.10 |
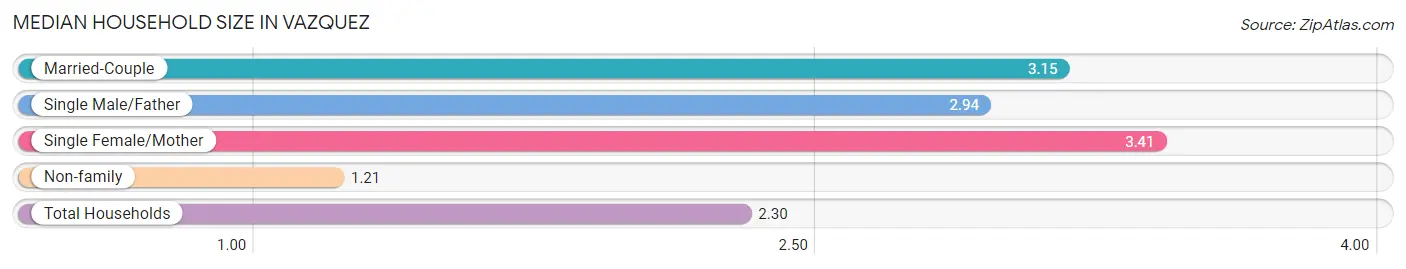
Median Household Size in Vazquez
The median household size in Vazquez is 2.30 persons per household, with single female/mother households (129 | 17.6%) accounting for the largest median household size of 3.41 persons per household. non-family households (329 | 44.8%) represent the smallest median household size with 1.21 persons per household.
| Household Type | # Households | Household Size |
| Married-Couple | 205 (27.9%) | 3.15 |
| Single Male/Father | 71 (9.7%) | 2.94 |
| Single Female/Mother | 129 (17.6%) | 3.41 |
| Non-family | 329 (44.8%) | 1.21 |
| Total Households | 734 (100.0%) | 2.30 |
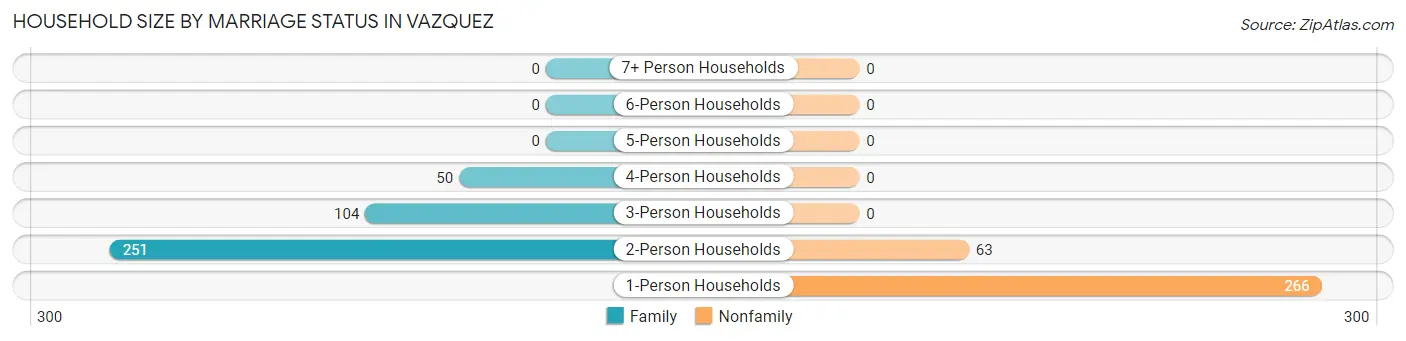
Household Size by Marriage Status in Vazquez
Out of a total of 734 households in Vazquez, 405 (55.2%) are family households, while 329 (44.8%) are nonfamily households. The most numerous type of family households are 2-person households, comprising 251, and the most common type of nonfamily households are 1-person households, comprising 266.
| Household Size | Family Households | Nonfamily Households |
| 1-Person Households | - | 266 (36.2%) |
| 2-Person Households | 251 (34.2%) | 63 (8.6%) |
| 3-Person Households | 104 (14.2%) | 0 (0.0%) |
| 4-Person Households | 50 (6.8%) | 0 (0.0%) |
| 5-Person Households | 0 (0.0%) | 0 (0.0%) |
| 6-Person Households | 0 (0.0%) | 0 (0.0%) |
| 7+ Person Households | 0 (0.0%) | 0 (0.0%) |
| Total | 405 (55.2%) | 329 (44.8%) |
Female Fertility in Vazquez
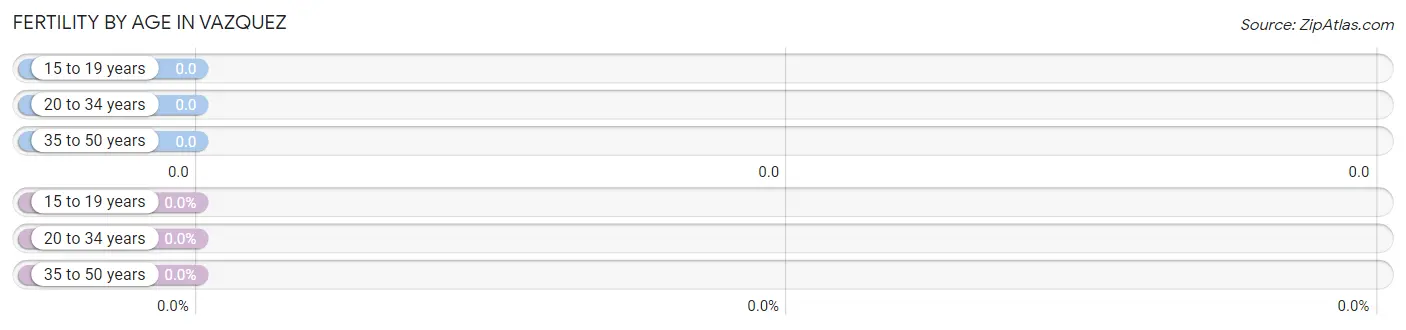
Fertility by Age in Vazquez
| Age Bracket | Women with Births | Births / 1,000 Women |
| 15 to 19 years | 0 (0.0%) | 0.0 |
| 20 to 34 years | 0 (0.0%) | 0.0 |
| 35 to 50 years | 0 (0.0%) | 0.0 |
| Total | 0 (0.0%) | 0.0 |
Fertility by Age by Marriage Status in Vazquez
| Age Bracket | Married | Unmarried |
| 15 to 19 years | 0 (0.0%) | 0 (0.0%) |
| 20 to 34 years | 0 (0.0%) | 0 (0.0%) |
| 35 to 50 years | 0 (0.0%) | 0 (0.0%) |
| Total | 0 (0.0%) | 0 (0.0%) |
Fertility by Education in Vazquez
| Educational Attainment | Women with Births | Births / 1,000 Women |
| Less than High School | 0 (0.0%) | 0.0 |
| High School Diploma | 0 (0.0%) | 0.0 |
| College or Associate's Degree | 0 (0.0%) | 0.0 |
| Bachelor's Degree | 0 (0.0%) | 0.0 |
| Graduate Degree | 0 (0.0%) | 0.0 |
| Total | 0 (0.0%) | 0.0 |
Fertility by Education by Marriage Status in Vazquez
| Educational Attainment | Married | Unmarried |
| Less than High School | 0 (0.0%) | 0 (0.0%) |
| High School Diploma | 0 (0.0%) | 0 (0.0%) |
| College or Associate's Degree | 0 (0.0%) | 0 (0.0%) |
| Bachelor's Degree | 0 (0.0%) | 0 (0.0%) |
| Graduate Degree | 0 (0.0%) | 0 (0.0%) |
| Total | 0 (0.0%) | 0 (0.0%) |
Employment Characteristics in Vazquez
Employment by Class of Employer in Vazquez
Among the 451 employed individuals in Vazquez, private company employees (254 | 56.3%), self-employed (not incorporated) (78 | 17.3%), and state government employees (68 | 15.1%) make up the most common classes of employment.
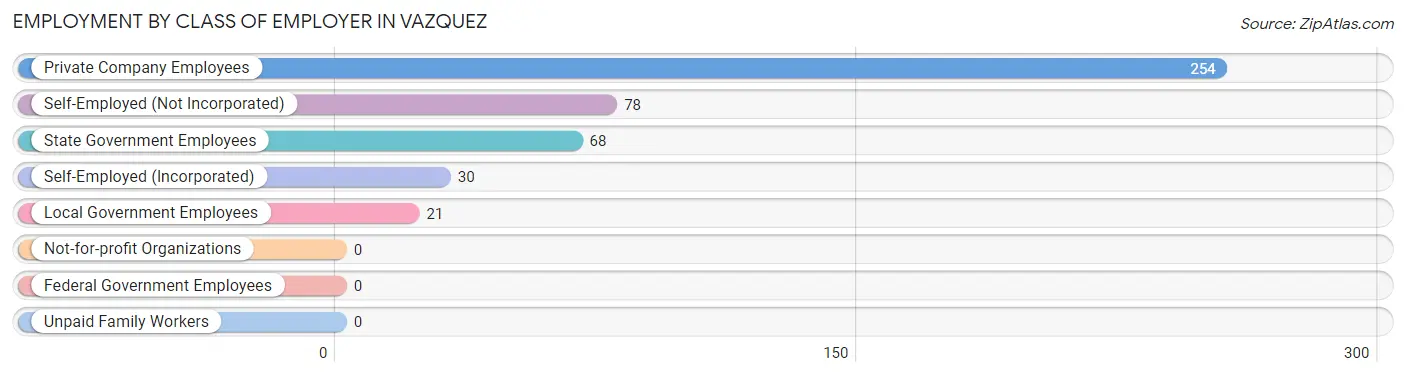
| Employer Class | # Employees | % Employees |
| Private Company Employees | 254 | 56.3% |
| Self-Employed (Incorporated) | 30 | 6.7% |
| Self-Employed (Not Incorporated) | 78 | 17.3% |
| Not-for-profit Organizations | 0 | 0.0% |
| Local Government Employees | 21 | 4.7% |
| State Government Employees | 68 | 15.1% |
| Federal Government Employees | 0 | 0.0% |
| Unpaid Family Workers | 0 | 0.0% |
| Total | 451 | 100.0% |
Employment Status by Age in Vazquez
According to the labor force statistics for Vazquez, out of the total population over 16 years of age (1,608), 35.0% or 563 individuals are in the labor force, with 11.7% or 66 of them unemployed. The age group with the highest labor force participation rate is 30 to 34 years, with 88.7% or 125 individuals in the labor force. Within the labor force, the 16 to 19 years age range has the highest percentage of unemployed individuals, with 100.0% or 52 of them being unemployed.
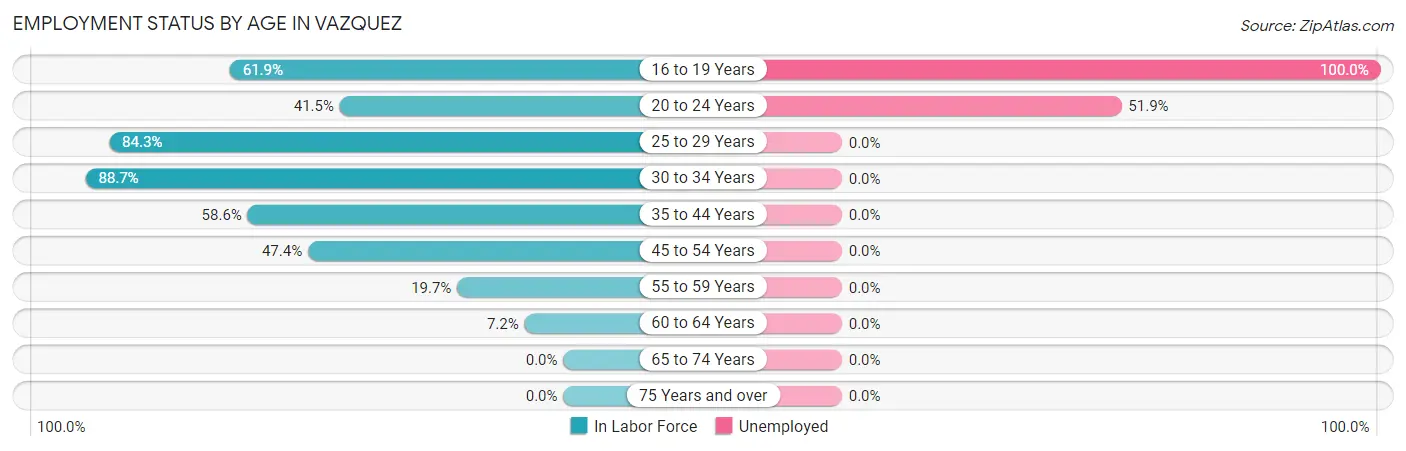
| Age Bracket | In Labor Force | Unemployed |
| 16 to 19 Years | 52 (61.9%) | 52 (100.0%) |
| 20 to 24 Years | 27 (41.5%) | 14 (51.9%) |
| 25 to 29 Years | 91 (84.3%) | 0 (0.0%) |
| 30 to 34 Years | 125 (88.7%) | 0 (0.0%) |
| 35 to 44 Years | 129 (58.6%) | 0 (0.0%) |
| 45 to 54 Years | 117 (47.4%) | 0 (0.0%) |
| 55 to 59 Years | 14 (19.7%) | 0 (0.0%) |
| 60 to 64 Years | 8 (7.2%) | 0 (0.0%) |
| 65 to 74 Years | 0 (0.0%) | 0 (0.0%) |
| 75 Years and over | 0 (0.0%) | 0 (0.0%) |
| Total | 563 (35.0%) | 66 (11.7%) |
Employment Status by Educational Attainment in Vazquez
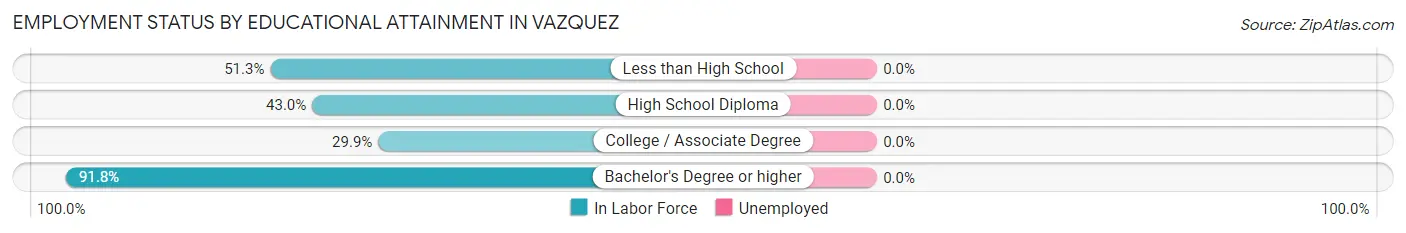
| Educational Attainment | In Labor Force | Unemployed |
| Less than High School | 159 (51.3%) | 0 (0.0%) |
| High School Diploma | 120 (43.0%) | 0 (0.0%) |
| College / Associate Degree | 38 (29.9%) | 0 (0.0%) |
| Bachelor's Degree or higher | 167 (91.8%) | 0 (0.0%) |
| Total | 484 (53.9%) | 0 (0.0%) |
Employment Occupations by Sex in Vazquez
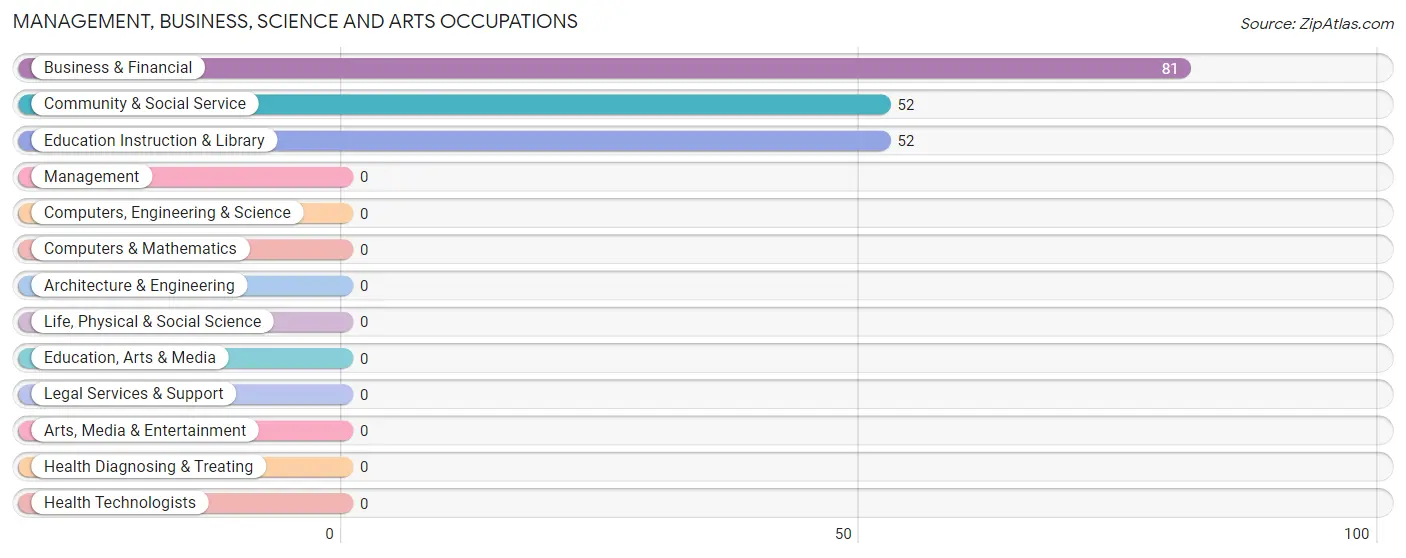
Management, Business, Science and Arts Occupations
The most common Management, Business, Science and Arts occupations in Vazquez are Business & Financial (81 | 16.3%), Community & Social Service (52 | 10.5%), and Education Instruction & Library (52 | 10.5%).
Management, Business, Science and Arts Occupations by Sex
Within the Management, Business, Science and Arts occupations in Vazquez, the most male-oriented occupations are Community & Social Service (84.6%), and Education Instruction & Library (84.6%), while the most female-oriented occupations are Business & Financial (100.0%), Community & Social Service (15.4%), and Education Instruction & Library (15.4%).
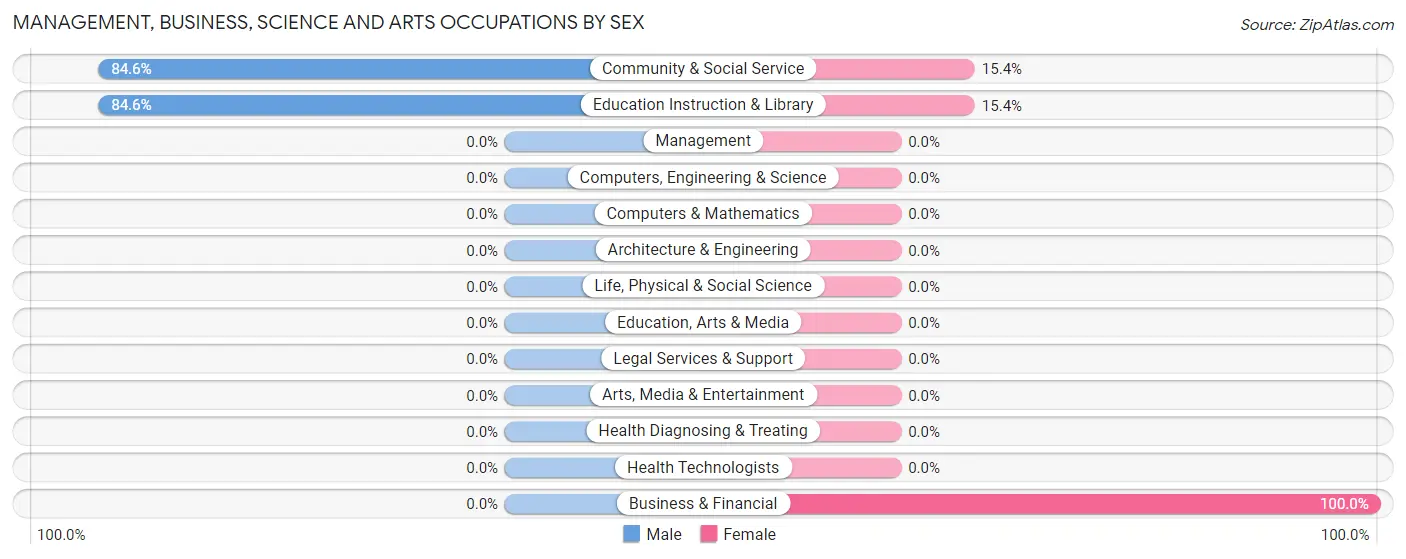
| Occupation | Male | Female |
| Management | 0 (0.0%) | 0 (0.0%) |
| Business & Financial | 0 (0.0%) | 81 (100.0%) |
| Computers, Engineering & Science | 0 (0.0%) | 0 (0.0%) |
| Computers & Mathematics | 0 (0.0%) | 0 (0.0%) |
| Architecture & Engineering | 0 (0.0%) | 0 (0.0%) |
| Life, Physical & Social Science | 0 (0.0%) | 0 (0.0%) |
| Community & Social Service | 44 (84.6%) | 8 (15.4%) |
| Education, Arts & Media | 0 (0.0%) | 0 (0.0%) |
| Legal Services & Support | 0 (0.0%) | 0 (0.0%) |
| Education Instruction & Library | 44 (84.6%) | 8 (15.4%) |
| Arts, Media & Entertainment | 0 (0.0%) | 0 (0.0%) |
| Health Diagnosing & Treating | 0 (0.0%) | 0 (0.0%) |
| Health Technologists | 0 (0.0%) | 0 (0.0%) |
| Total (Category) | 44 (33.1%) | 89 (66.9%) |
| Total (Overall) | 278 (55.9%) | 219 (44.1%) |
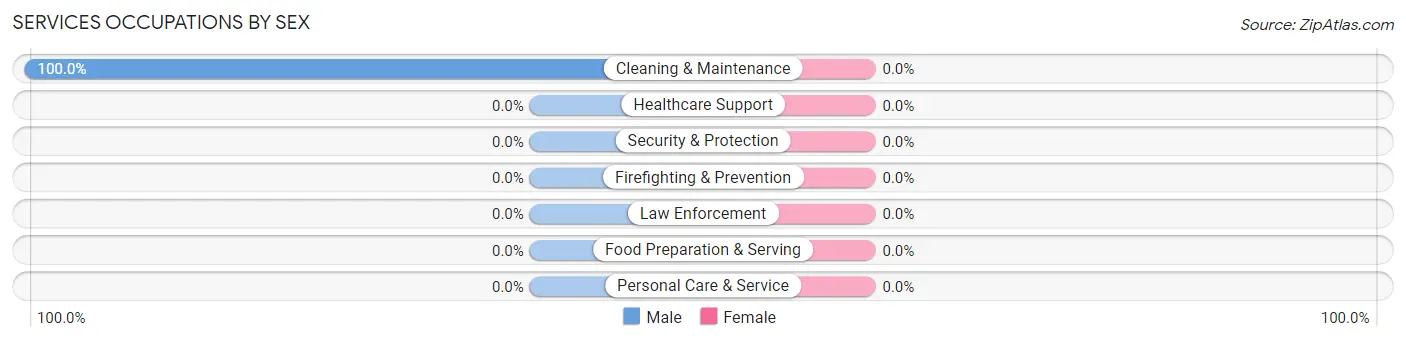
Services Occupations
The most common Services occupations in Vazquez are , and Cleaning & Maintenance (114 | 22.9%).
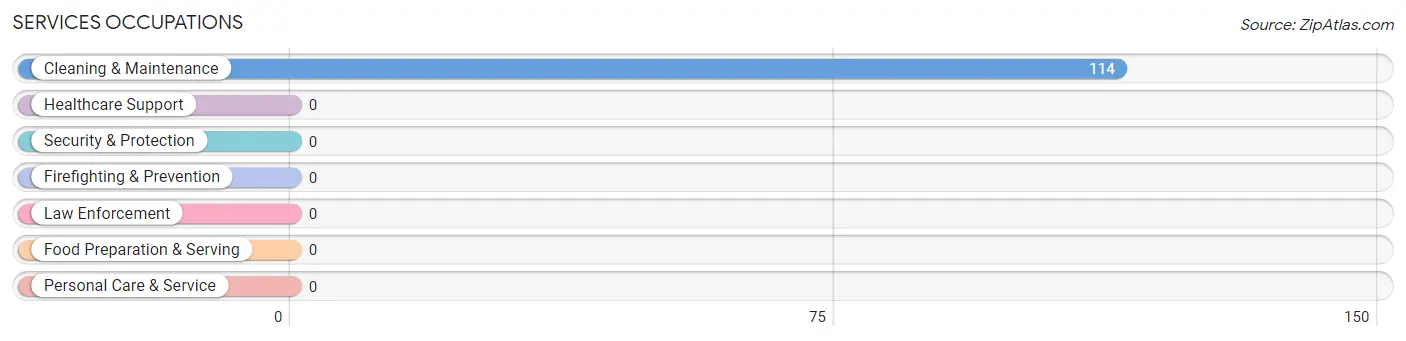
Services Occupations by Sex
| Occupation | Male | Female |
| Healthcare Support | 0 (0.0%) | 0 (0.0%) |
| Security & Protection | 0 (0.0%) | 0 (0.0%) |
| Firefighting & Prevention | 0 (0.0%) | 0 (0.0%) |
| Law Enforcement | 0 (0.0%) | 0 (0.0%) |
| Food Preparation & Serving | 0 (0.0%) | 0 (0.0%) |
| Cleaning & Maintenance | 114 (100.0%) | 0 (0.0%) |
| Personal Care & Service | 0 (0.0%) | 0 (0.0%) |
| Total (Category) | 114 (100.0%) | 0 (0.0%) |
| Total (Overall) | 278 (55.9%) | 219 (44.1%) |
Sales and Office Occupations
The most common Sales and Office occupations in Vazquez are Sales & Related (66 | 13.3%), and Office & Administration (33 | 6.6%).
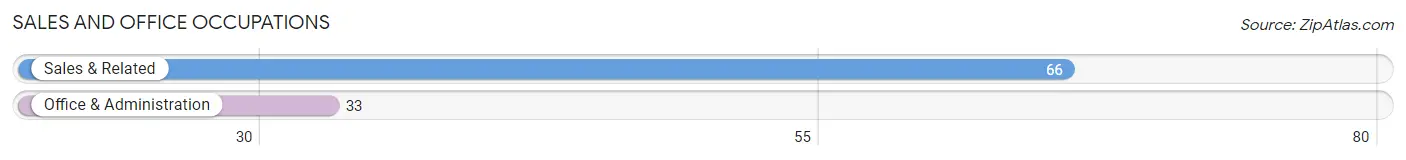
Sales and Office Occupations by Sex

| Occupation | Male | Female |
| Sales & Related | 0 (0.0%) | 66 (100.0%) |
| Office & Administration | 0 (0.0%) | 33 (100.0%) |
| Total (Category) | 0 (0.0%) | 99 (100.0%) |
| Total (Overall) | 278 (55.9%) | 219 (44.1%) |
Natural Resources, Construction and Maintenance Occupations
The most common Natural Resources, Construction and Maintenance occupations in Vazquez are Construction & Extraction (49 | 9.9%), and Installation, Maintenance & Repair (44 | 8.8%).
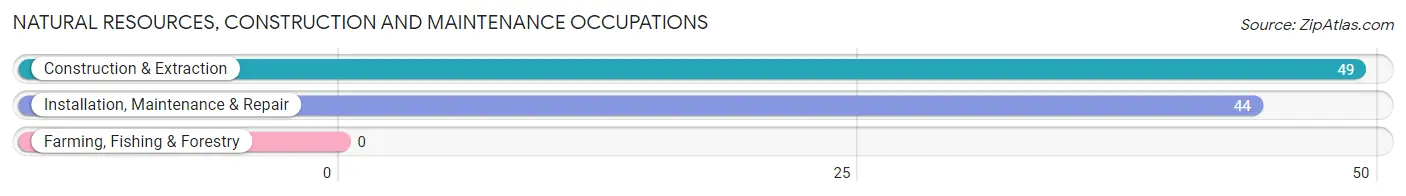
Natural Resources, Construction and Maintenance Occupations by Sex

| Occupation | Male | Female |
| Farming, Fishing & Forestry | 0 (0.0%) | 0 (0.0%) |
| Construction & Extraction | 49 (100.0%) | 0 (0.0%) |
| Installation, Maintenance & Repair | 44 (100.0%) | 0 (0.0%) |
| Total (Category) | 93 (100.0%) | 0 (0.0%) |
| Total (Overall) | 278 (55.9%) | 219 (44.1%) |
Production, Transportation and Moving Occupations
The most common Production, Transportation and Moving occupations in Vazquez are , and Production (58 | 11.7%).
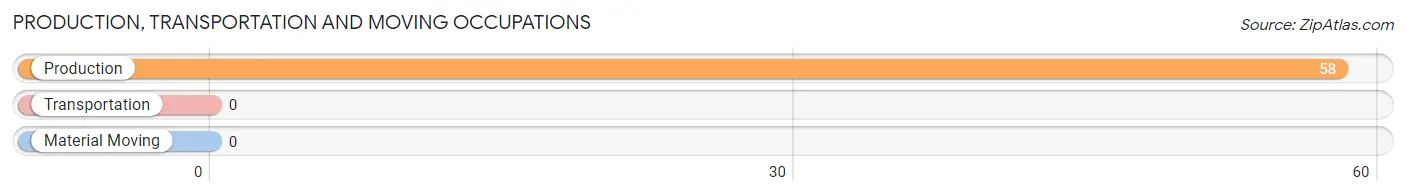
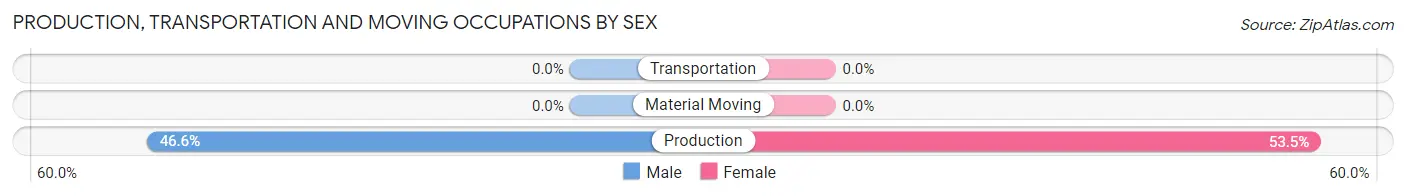
Production, Transportation and Moving Occupations by Sex
| Occupation | Male | Female |
| Production | 27 (46.6%) | 31 (53.4%) |
| Transportation | 0 (0.0%) | 0 (0.0%) |
| Material Moving | 0 (0.0%) | 0 (0.0%) |
| Total (Category) | 27 (46.6%) | 31 (53.4%) |
| Total (Overall) | 278 (55.9%) | 219 (44.1%) |
Employment Industries by Sex in Vazquez
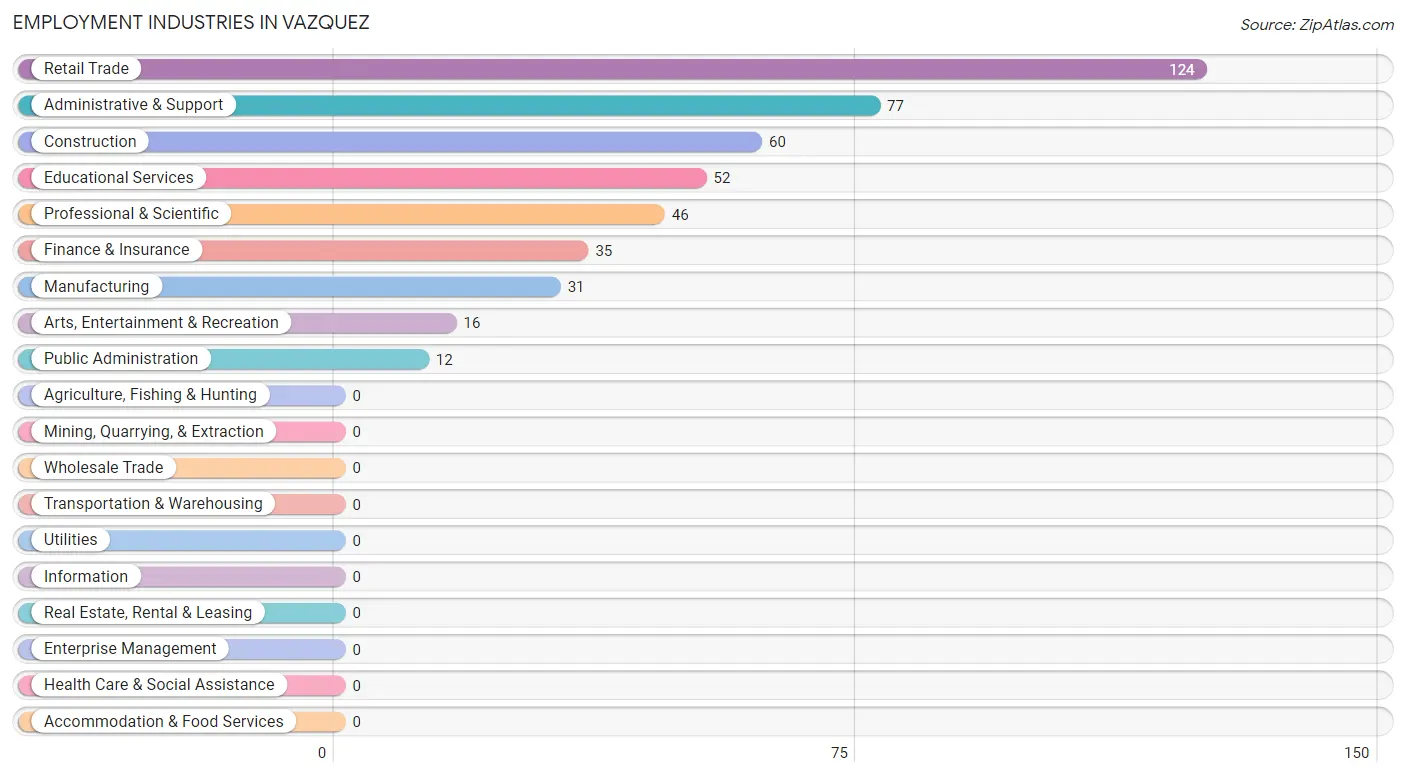
Employment Industries in Vazquez
The major employment industries in Vazquez include Retail Trade (124 | 24.9%), Administrative & Support (77 | 15.5%), Construction (60 | 12.1%), Educational Services (52 | 10.5%), and Professional & Scientific (46 | 9.3%).
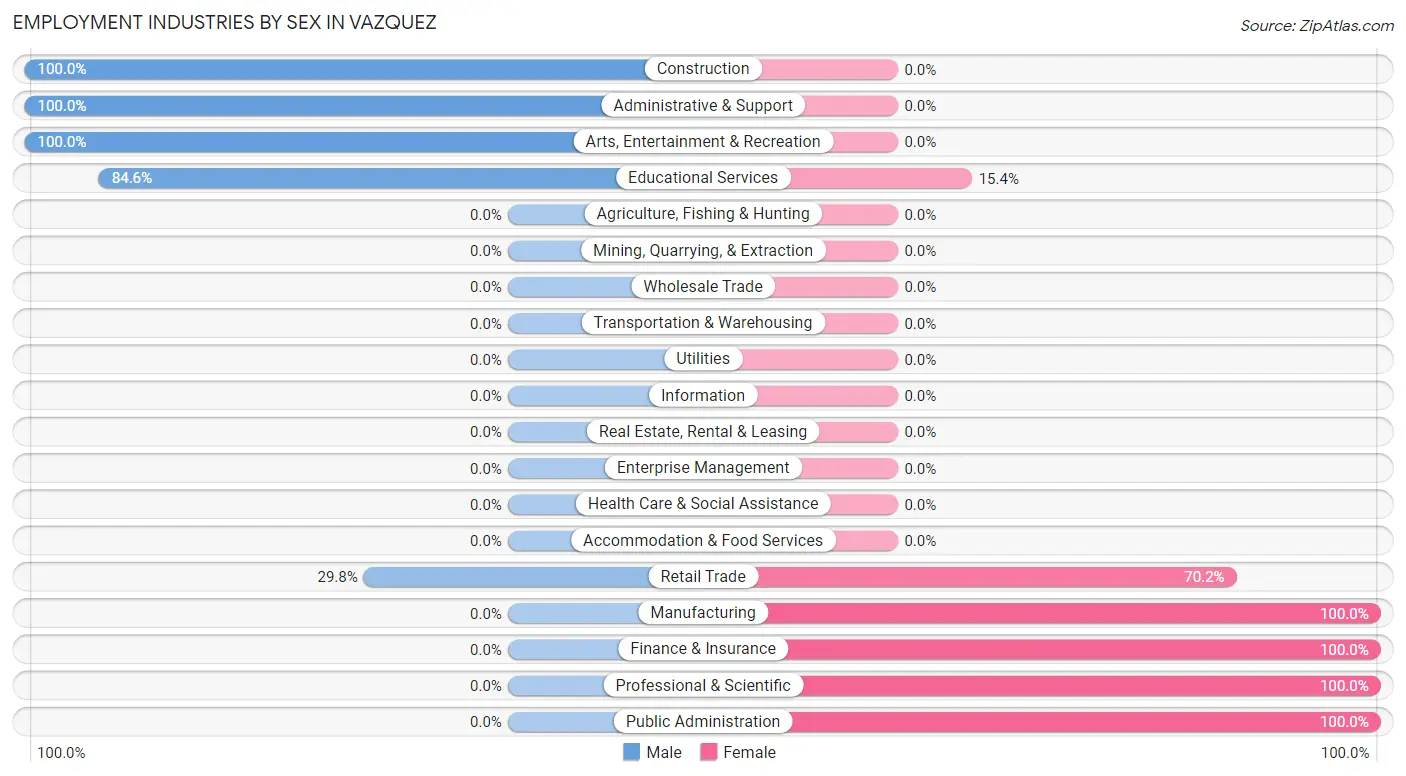
Employment Industries by Sex in Vazquez
The Vazquez industries that see more men than women are Construction (100.0%), Administrative & Support (100.0%), and Arts, Entertainment & Recreation (100.0%), whereas the industries that tend to have a higher number of women are Manufacturing (100.0%), Finance & Insurance (100.0%), and Professional & Scientific (100.0%).
| Industry | Male | Female |
| Agriculture, Fishing & Hunting | 0 (0.0%) | 0 (0.0%) |
| Mining, Quarrying, & Extraction | 0 (0.0%) | 0 (0.0%) |
| Construction | 60 (100.0%) | 0 (0.0%) |
| Manufacturing | 0 (0.0%) | 31 (100.0%) |
| Wholesale Trade | 0 (0.0%) | 0 (0.0%) |
| Retail Trade | 37 (29.8%) | 87 (70.2%) |
| Transportation & Warehousing | 0 (0.0%) | 0 (0.0%) |
| Utilities | 0 (0.0%) | 0 (0.0%) |
| Information | 0 (0.0%) | 0 (0.0%) |
| Finance & Insurance | 0 (0.0%) | 35 (100.0%) |
| Real Estate, Rental & Leasing | 0 (0.0%) | 0 (0.0%) |
| Professional & Scientific | 0 (0.0%) | 46 (100.0%) |
| Enterprise Management | 0 (0.0%) | 0 (0.0%) |
| Administrative & Support | 77 (100.0%) | 0 (0.0%) |
| Educational Services | 44 (84.6%) | 8 (15.4%) |
| Health Care & Social Assistance | 0 (0.0%) | 0 (0.0%) |
| Arts, Entertainment & Recreation | 16 (100.0%) | 0 (0.0%) |
| Accommodation & Food Services | 0 (0.0%) | 0 (0.0%) |
| Public Administration | 0 (0.0%) | 12 (100.0%) |
| Total | 278 (55.9%) | 219 (44.1%) |
Education in Vazquez
School Enrollment in Vazquez
The most common levels of schooling among the 147 students in Vazquez are middle school (68 | 46.3%), college / undergraduate (47 | 32.0%), and high school (32 | 21.8%).
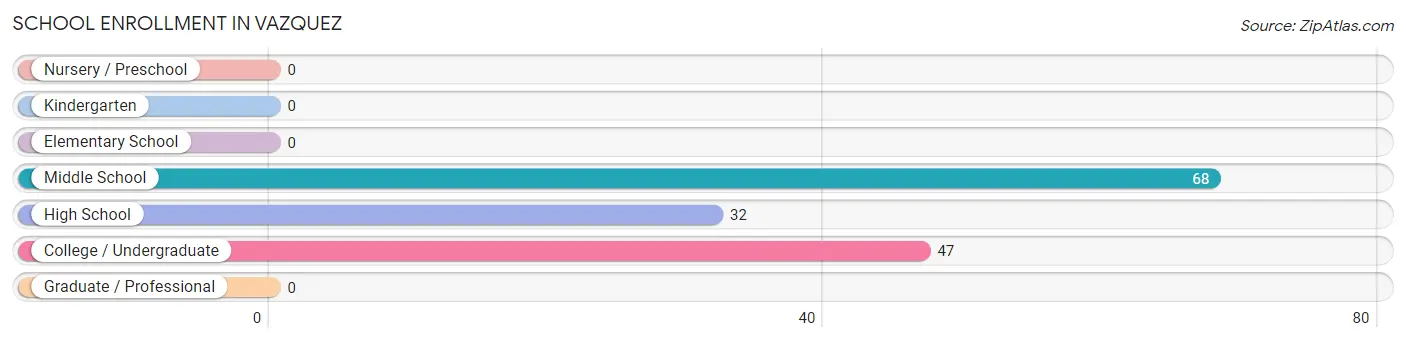
| School Level | # Students | % Students |
| Nursery / Preschool | 0 | 0.0% |
| Kindergarten | 0 | 0.0% |
| Elementary School | 0 | 0.0% |
| Middle School | 68 | 46.3% |
| High School | 32 | 21.8% |
| College / Undergraduate | 47 | 32.0% |
| Graduate / Professional | 0 | 0.0% |
| Total | 147 | 100.0% |
School Enrollment by Age by Funding Source in Vazquez
Out of a total of 147 students who are enrolled in schools in Vazquez, 47 (32.0%) attend a private institution, while the remaining 100 (68.0%) are enrolled in public schools. The age group of 18 to 19 year olds has the highest likelihood of being enrolled in private schools, with 23 (100.0% in the age bracket) enrolled. Conversely, the age group of 10 to 14 year olds has the lowest likelihood of being enrolled in a private school, with 59 (100.0% in the age bracket) attending a public institution.

| Age Bracket | Public School | Private School |
| 3 to 4 Year Olds | 0 (0.0%) | 0 (0.0%) |
| 5 to 9 Year Old | 0 (0.0%) | 0 (0.0%) |
| 10 to 14 Year Olds | 59 (100.0%) | 0 (0.0%) |
| 15 to 17 Year Olds | 32 (100.0%) | 0 (0.0%) |
| 18 to 19 Year Olds | 0 (0.0%) | 23 (100.0%) |
| 20 to 24 Year Olds | 0 (0.0%) | 24 (100.0%) |
| 25 to 34 Year Olds | 0 (0.0%) | 0 (0.0%) |
| 35 Years and over | 9 (100.0%) | 0 (0.0%) |
| Total | 100 (68.0%) | 47 (32.0%) |
Educational Attainment by Field of Study in Vazquez
Education (93 | 40.3%), business (68 | 29.4%), science & technology (27 | 11.7%), bio, nature & agricultural (19 | 8.2%), and computers & mathematics (16 | 6.9%) are the most common fields of study among 231 individuals in Vazquez who have obtained a bachelor's degree or higher.
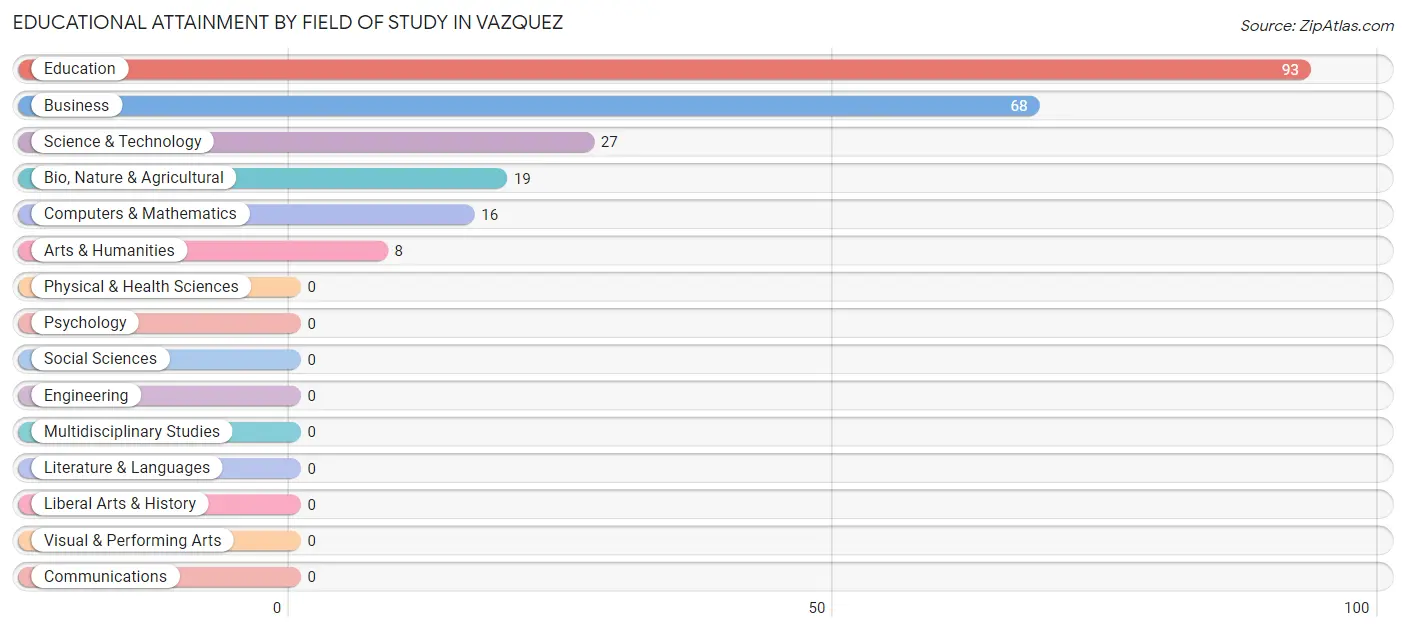
| Field of Study | # Graduates | % Graduates |
| Computers & Mathematics | 16 | 6.9% |
| Bio, Nature & Agricultural | 19 | 8.2% |
| Physical & Health Sciences | 0 | 0.0% |
| Psychology | 0 | 0.0% |
| Social Sciences | 0 | 0.0% |
| Engineering | 0 | 0.0% |
| Multidisciplinary Studies | 0 | 0.0% |
| Science & Technology | 27 | 11.7% |
| Business | 68 | 29.4% |
| Education | 93 | 40.3% |
| Literature & Languages | 0 | 0.0% |
| Liberal Arts & History | 0 | 0.0% |
| Visual & Performing Arts | 0 | 0.0% |
| Communications | 0 | 0.0% |
| Arts & Humanities | 8 | 3.5% |
| Total | 231 | 100.0% |
Transportation & Commute in Vazquez
Vehicle Availability by Sex in Vazquez
The most prevalent vehicle ownership categories in Vazquez are males with 3 vehicles (125, accounting for 49.8%) and females with 3 vehicles (48, making up 62.5%).
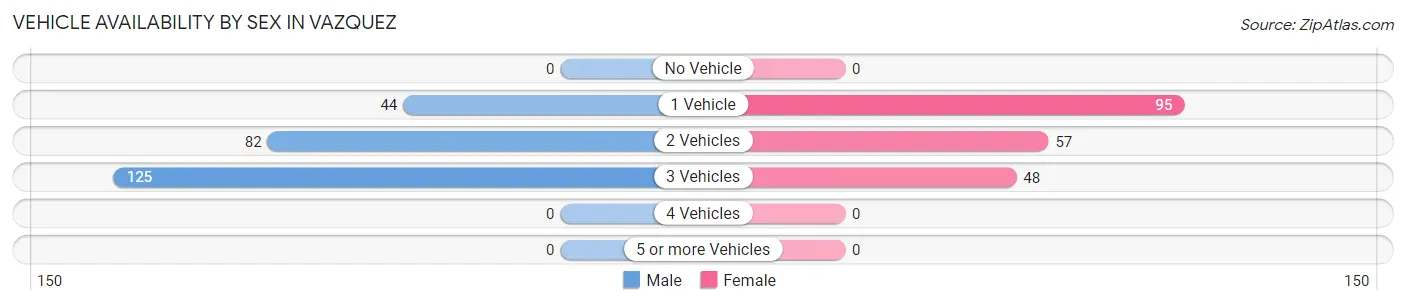
| Vehicles Available | Male | Female |
| No Vehicle | 0 (0.0%) | 0 (0.0%) |
| 1 Vehicle | 44 (17.5%) | 95 (47.5%) |
| 2 Vehicles | 82 (32.7%) | 57 (28.5%) |
| 3 Vehicles | 125 (49.8%) | 48 (24.0%) |
| 4 Vehicles | 0 (0.0%) | 0 (0.0%) |
| 5 or more Vehicles | 0 (0.0%) | 0 (0.0%) |
| Total | 251 (100.0%) | 200 (100.0%) |
Commute Time in Vazquez
The most frequently occuring commute durations in Vazquez are 5 to 9 minutes (144 commuters, 42.1%), 20 to 24 minutes (64 commuters, 18.7%), and 15 to 19 minutes (33 commuters, 9.7%).
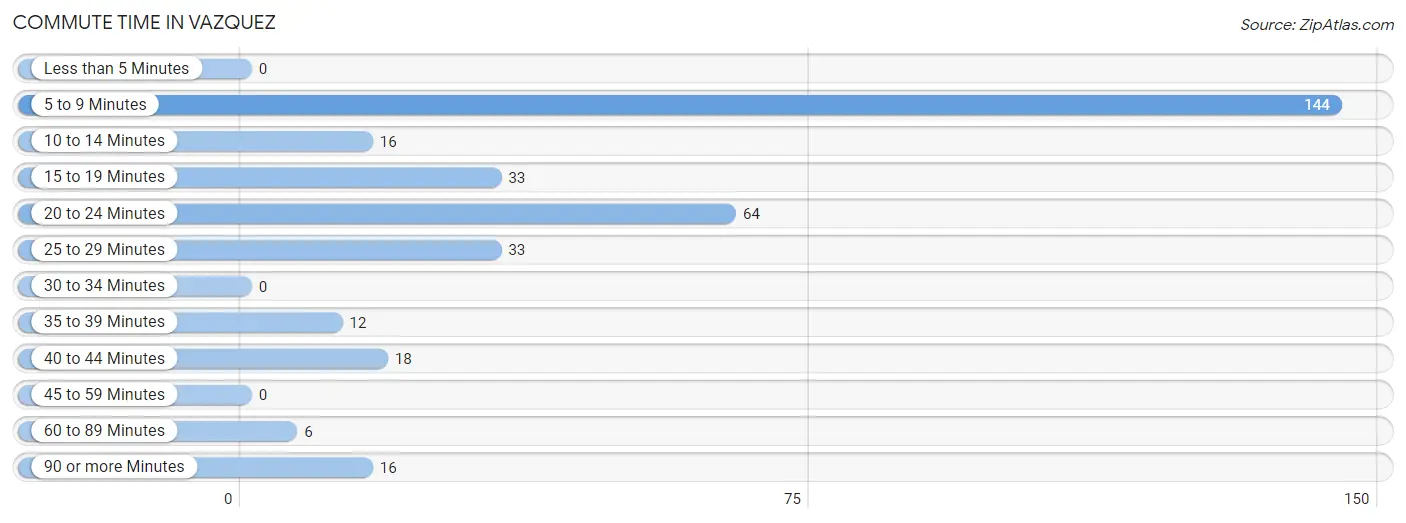
| Commute Time | # Commuters | % Commuters |
| Less than 5 Minutes | 0 | 0.0% |
| 5 to 9 Minutes | 144 | 42.1% |
| 10 to 14 Minutes | 16 | 4.7% |
| 15 to 19 Minutes | 33 | 9.7% |
| 20 to 24 Minutes | 64 | 18.7% |
| 25 to 29 Minutes | 33 | 9.7% |
| 30 to 34 Minutes | 0 | 0.0% |
| 35 to 39 Minutes | 12 | 3.5% |
| 40 to 44 Minutes | 18 | 5.3% |
| 45 to 59 Minutes | 0 | 0.0% |
| 60 to 89 Minutes | 6 | 1.8% |
| 90 or more Minutes | 16 | 4.7% |
Commute Time by Sex in Vazquez
The most common commute times in Vazquez are 5 to 9 minutes (144 commuters, 69.6%) for males and 20 to 24 minutes (50 commuters, 37.0%) for females.
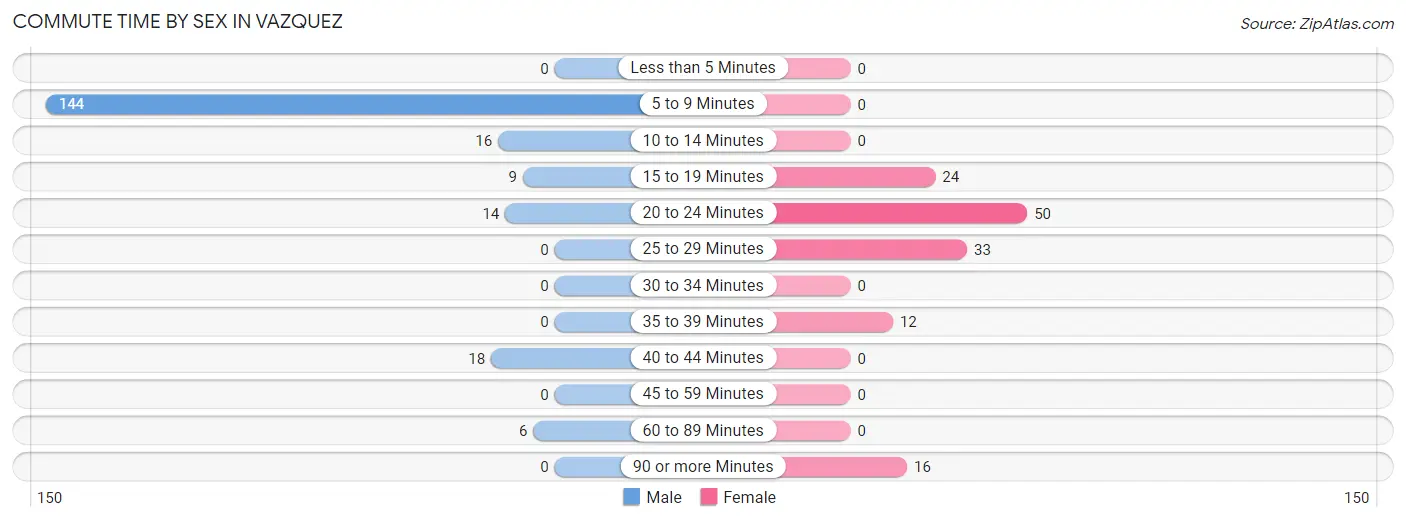
| Commute Time | Male | Female |
| Less than 5 Minutes | 0 (0.0%) | 0 (0.0%) |
| 5 to 9 Minutes | 144 (69.6%) | 0 (0.0%) |
| 10 to 14 Minutes | 16 (7.7%) | 0 (0.0%) |
| 15 to 19 Minutes | 9 (4.3%) | 24 (17.8%) |
| 20 to 24 Minutes | 14 (6.8%) | 50 (37.0%) |
| 25 to 29 Minutes | 0 (0.0%) | 33 (24.4%) |
| 30 to 34 Minutes | 0 (0.0%) | 0 (0.0%) |
| 35 to 39 Minutes | 0 (0.0%) | 12 (8.9%) |
| 40 to 44 Minutes | 18 (8.7%) | 0 (0.0%) |
| 45 to 59 Minutes | 0 (0.0%) | 0 (0.0%) |
| 60 to 89 Minutes | 6 (2.9%) | 0 (0.0%) |
| 90 or more Minutes | 0 (0.0%) | 16 (11.8%) |
Time of Departure to Work by Sex in Vazquez
The most frequent times of departure to work in Vazquez are 7:30 AM to 7:59 AM (51, 24.6%) for males and 7:00 AM to 7:29 AM (87, 64.4%) for females.
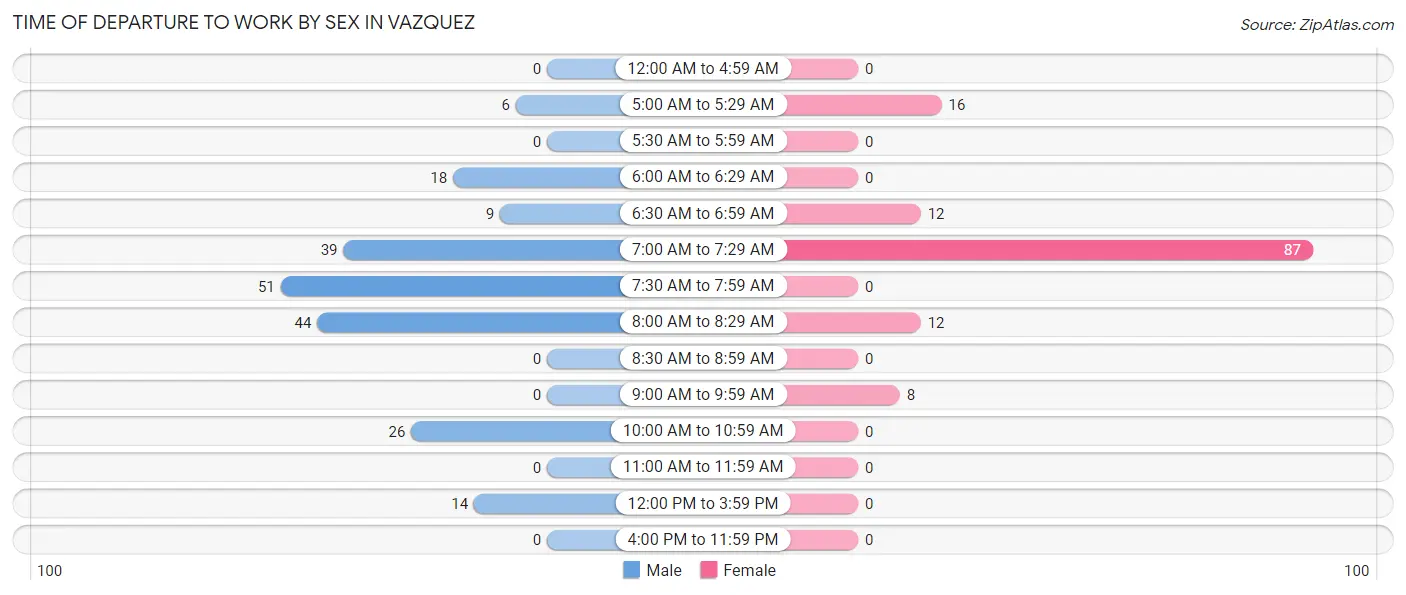
| Time of Departure | Male | Female |
| 12:00 AM to 4:59 AM | 0 (0.0%) | 0 (0.0%) |
| 5:00 AM to 5:29 AM | 6 (2.9%) | 16 (11.8%) |
| 5:30 AM to 5:59 AM | 0 (0.0%) | 0 (0.0%) |
| 6:00 AM to 6:29 AM | 18 (8.7%) | 0 (0.0%) |
| 6:30 AM to 6:59 AM | 9 (4.3%) | 12 (8.9%) |
| 7:00 AM to 7:29 AM | 39 (18.8%) | 87 (64.4%) |
| 7:30 AM to 7:59 AM | 51 (24.6%) | 0 (0.0%) |
| 8:00 AM to 8:29 AM | 44 (21.3%) | 12 (8.9%) |
| 8:30 AM to 8:59 AM | 0 (0.0%) | 0 (0.0%) |
| 9:00 AM to 9:59 AM | 0 (0.0%) | 8 (5.9%) |
| 10:00 AM to 10:59 AM | 26 (12.6%) | 0 (0.0%) |
| 11:00 AM to 11:59 AM | 0 (0.0%) | 0 (0.0%) |
| 12:00 PM to 3:59 PM | 14 (6.8%) | 0 (0.0%) |
| 4:00 PM to 11:59 PM | 0 (0.0%) | 0 (0.0%) |
| Total | 207 (100.0%) | 135 (100.0%) |
Housing Occupancy in Vazquez
Occupancy by Ownership in Vazquez
Of the total 734 dwellings in Vazquez, owner-occupied units account for 634 (86.4%), while renter-occupied units make up 100 (13.6%).
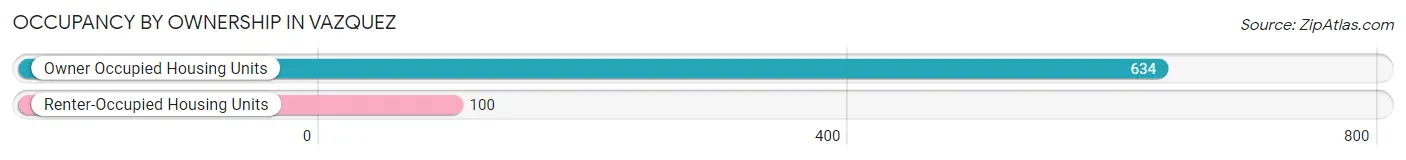
| Occupancy | # Housing Units | % Housing Units |
| Owner Occupied Housing Units | 634 | 86.4% |
| Renter-Occupied Housing Units | 100 | 13.6% |
| Total Occupied Housing Units | 734 | 100.0% |
Occupancy by Household Size in Vazquez
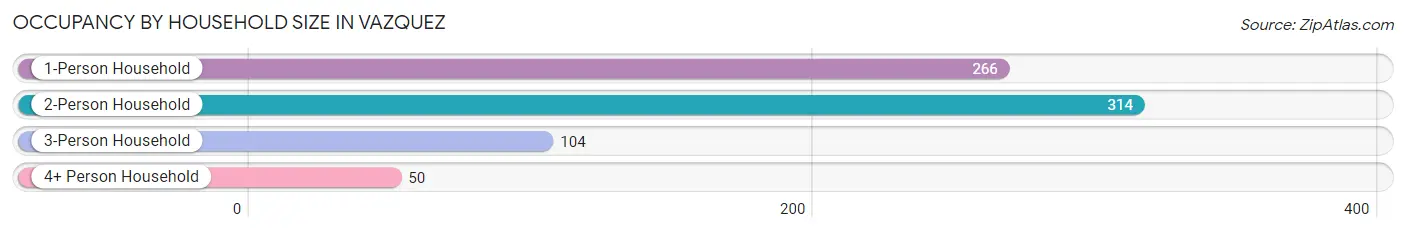
| Household Size | # Housing Units | % Housing Units |
| 1-Person Household | 266 | 36.2% |
| 2-Person Household | 314 | 42.8% |
| 3-Person Household | 104 | 14.2% |
| 4+ Person Household | 50 | 6.8% |
| Total Housing Units | 734 | 100.0% |
Occupancy by Ownership by Household Size in Vazquez
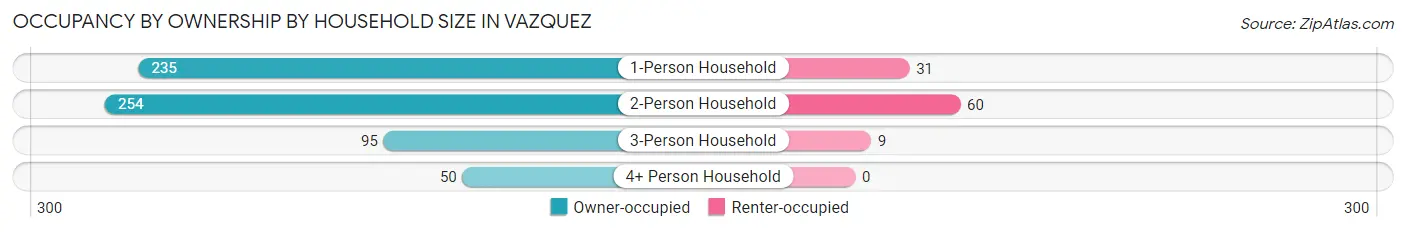
| Household Size | Owner-occupied | Renter-occupied |
| 1-Person Household | 235 (88.3%) | 31 (11.7%) |
| 2-Person Household | 254 (80.9%) | 60 (19.1%) |
| 3-Person Household | 95 (91.3%) | 9 (8.6%) |
| 4+ Person Household | 50 (100.0%) | 0 (0.0%) |
| Total Housing Units | 634 (86.4%) | 100 (13.6%) |
Occupancy by Educational Attainment in Vazquez
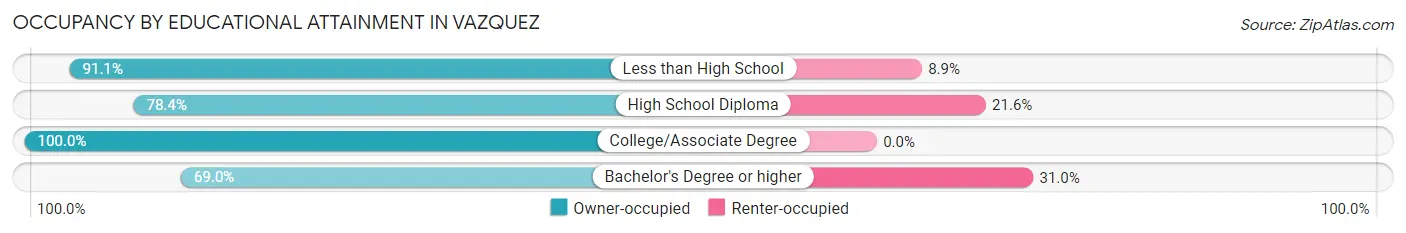
| Household Size | Owner-occupied | Renter-occupied |
| Less than High School | 265 (91.1%) | 26 (8.9%) |
| High School Diploma | 156 (78.4%) | 43 (21.6%) |
| College/Associate Degree | 144 (100.0%) | 0 (0.0%) |
| Bachelor's Degree or higher | 69 (69.0%) | 31 (31.0%) |
Occupancy by Age of Householder in Vazquez
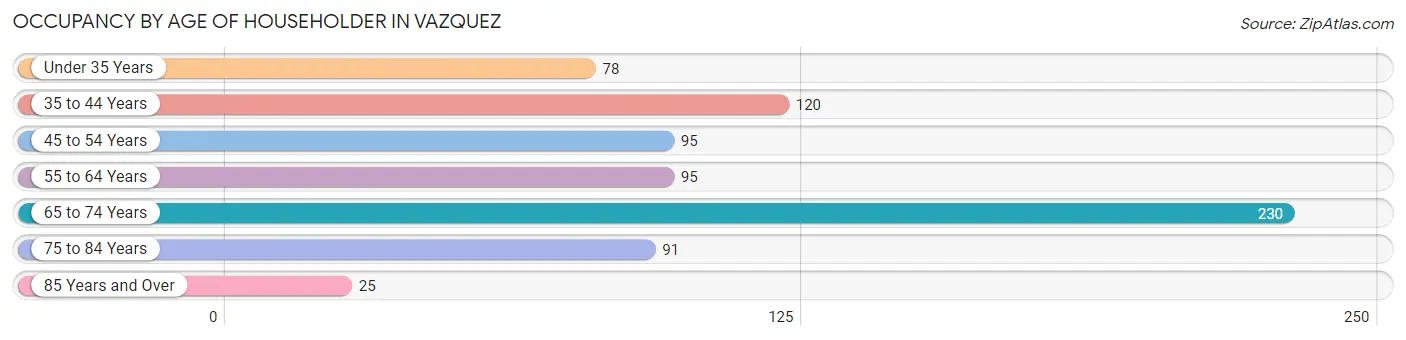
| Age Bracket | # Households | % Households |
| Under 35 Years | 78 | 10.6% |
| 35 to 44 Years | 120 | 16.4% |
| 45 to 54 Years | 95 | 12.9% |
| 55 to 64 Years | 95 | 12.9% |
| 65 to 74 Years | 230 | 31.3% |
| 75 to 84 Years | 91 | 12.4% |
| 85 Years and Over | 25 | 3.4% |
| Total | 734 | 100.0% |
Housing Finances in Vazquez
Median Income by Occupancy in Vazquez
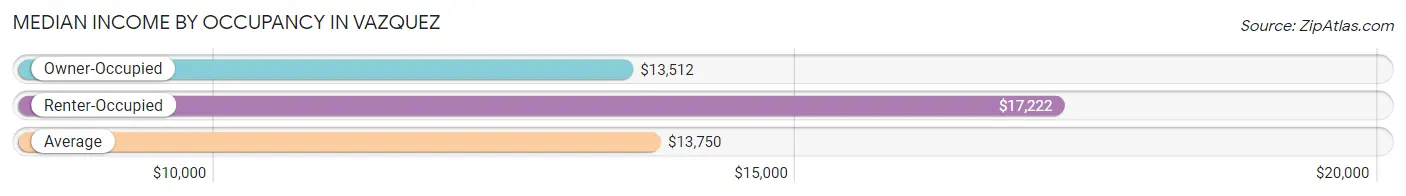
| Occupancy Type | # Households | Median Income |
| Owner-Occupied | 634 (86.4%) | $13,512 |
| Renter-Occupied | 100 (13.6%) | $17,222 |
| Average | 734 (100.0%) | $13,750 |
Occupancy by Householder Income Bracket in Vazquez
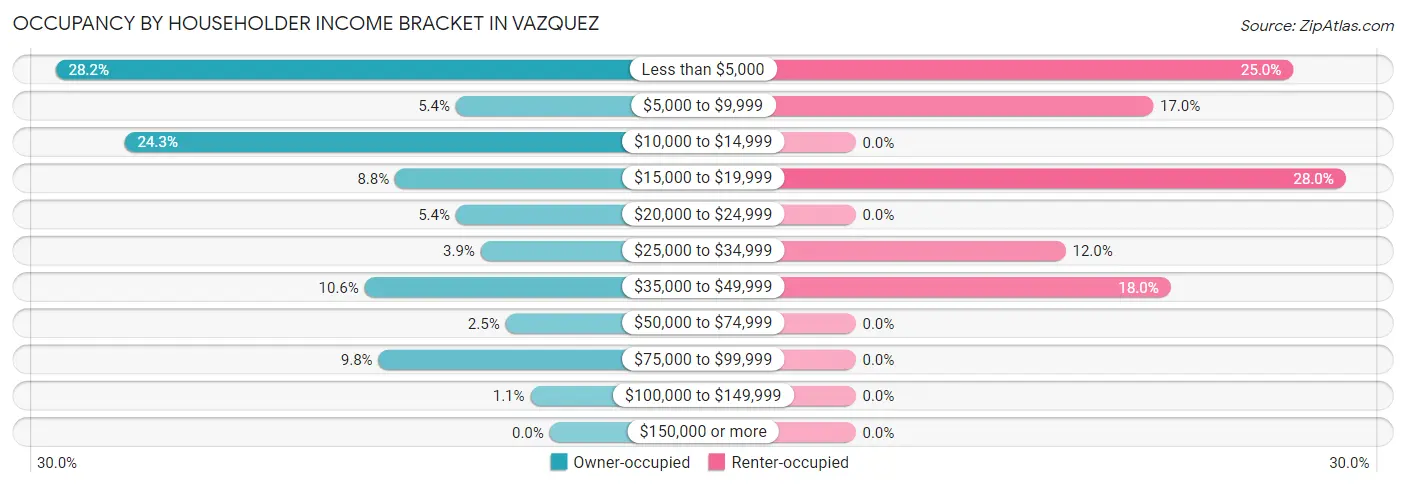
| Income Bracket | Owner-occupied | Renter-occupied |
| Less than $5,000 | 179 (28.2%) | 25 (25.0%) |
| $5,000 to $9,999 | 34 (5.4%) | 17 (17.0%) |
| $10,000 to $14,999 | 154 (24.3%) | 0 (0.0%) |
| $15,000 to $19,999 | 56 (8.8%) | 28 (28.0%) |
| $20,000 to $24,999 | 34 (5.4%) | 0 (0.0%) |
| $25,000 to $34,999 | 25 (3.9%) | 12 (12.0%) |
| $35,000 to $49,999 | 67 (10.6%) | 18 (18.0%) |
| $50,000 to $74,999 | 16 (2.5%) | 0 (0.0%) |
| $75,000 to $99,999 | 62 (9.8%) | 0 (0.0%) |
| $100,000 to $149,999 | 7 (1.1%) | 0 (0.0%) |
| $150,000 or more | 0 (0.0%) | 0 (0.0%) |
| Total | 634 (100.0%) | 100 (100.0%) |
Monthly Housing Cost Tiers in Vazquez
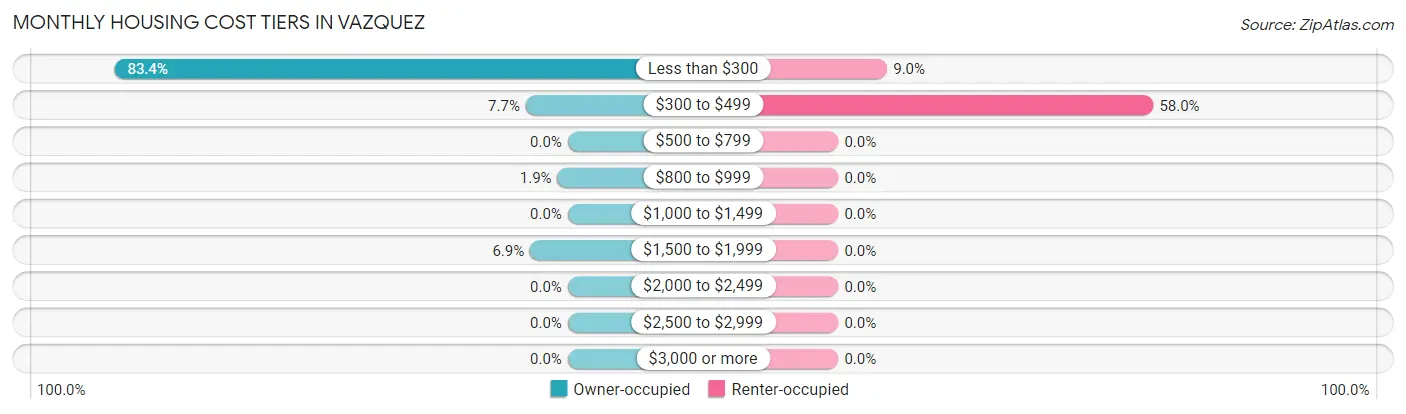
| Monthly Cost | Owner-occupied | Renter-occupied |
| Less than $300 | 529 (83.4%) | 9 (9.0%) |
| $300 to $499 | 49 (7.7%) | 58 (58.0%) |
| $500 to $799 | 0 (0.0%) | 0 (0.0%) |
| $800 to $999 | 12 (1.9%) | 0 (0.0%) |
| $1,000 to $1,499 | 0 (0.0%) | 0 (0.0%) |
| $1,500 to $1,999 | 44 (6.9%) | 0 (0.0%) |
| $2,000 to $2,499 | 0 (0.0%) | 0 (0.0%) |
| $2,500 to $2,999 | 0 (0.0%) | 0 (0.0%) |
| $3,000 or more | 0 (0.0%) | 0 (0.0%) |
| Total | 634 (100.0%) | 100 (100.0%) |
Physical Housing Characteristics in Vazquez
Housing Structures in Vazquez
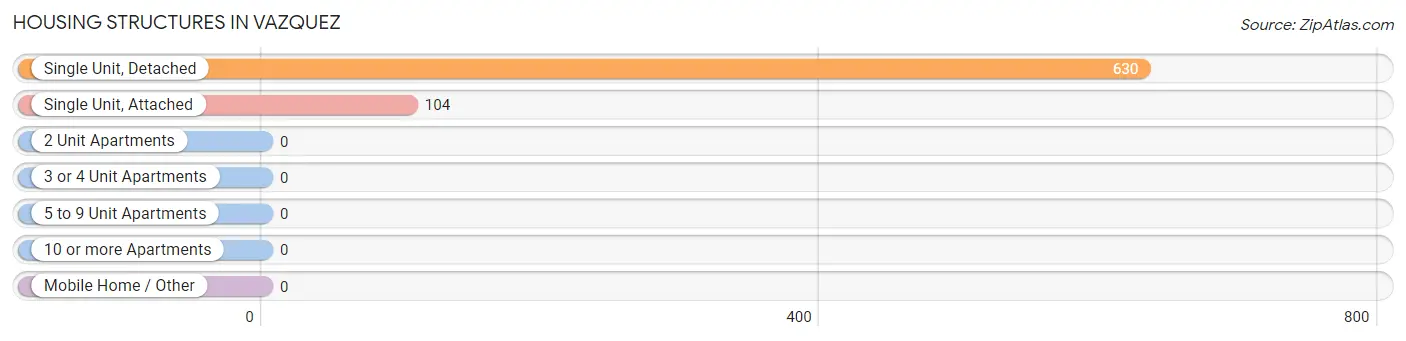
| Structure Type | # Housing Units | % Housing Units |
| Single Unit, Detached | 630 | 85.8% |
| Single Unit, Attached | 104 | 14.2% |
| 2 Unit Apartments | 0 | 0.0% |
| 3 or 4 Unit Apartments | 0 | 0.0% |
| 5 to 9 Unit Apartments | 0 | 0.0% |
| 10 or more Apartments | 0 | 0.0% |
| Mobile Home / Other | 0 | 0.0% |
| Total | 734 | 100.0% |
Housing Structures by Occupancy in Vazquez
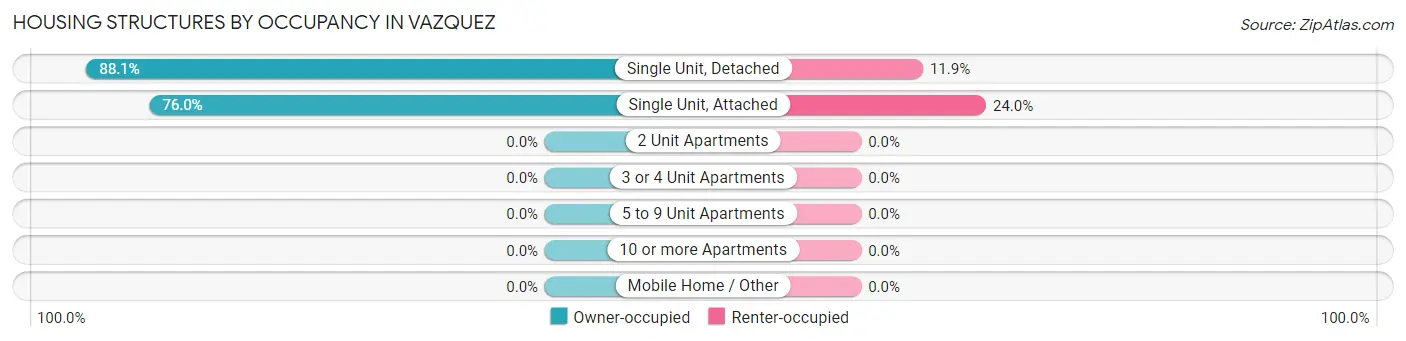
| Structure Type | Owner-occupied | Renter-occupied |
| Single Unit, Detached | 555 (88.1%) | 75 (11.9%) |
| Single Unit, Attached | 79 (76.0%) | 25 (24.0%) |
| 2 Unit Apartments | 0 (0.0%) | 0 (0.0%) |
| 3 or 4 Unit Apartments | 0 (0.0%) | 0 (0.0%) |
| 5 to 9 Unit Apartments | 0 (0.0%) | 0 (0.0%) |
| 10 or more Apartments | 0 (0.0%) | 0 (0.0%) |
| Mobile Home / Other | 0 (0.0%) | 0 (0.0%) |
| Total | 634 (86.4%) | 100 (13.6%) |
Housing Structures by Number of Rooms in Vazquez
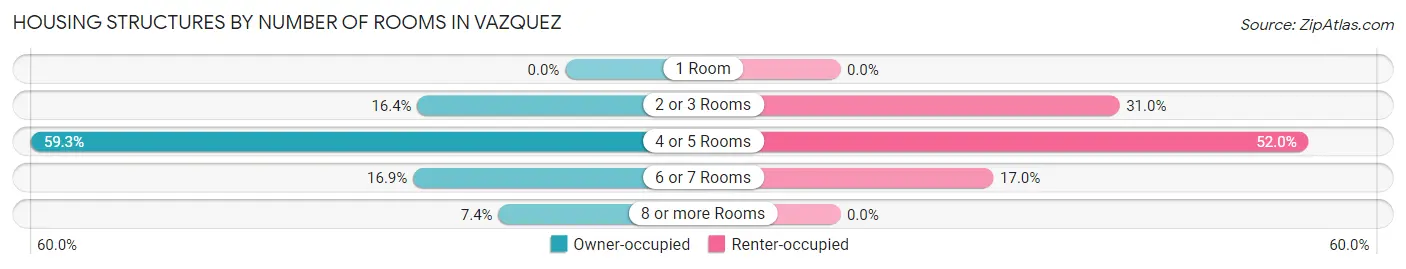
| Number of Rooms | Owner-occupied | Renter-occupied |
| 1 Room | 0 (0.0%) | 0 (0.0%) |
| 2 or 3 Rooms | 104 (16.4%) | 31 (31.0%) |
| 4 or 5 Rooms | 376 (59.3%) | 52 (52.0%) |
| 6 or 7 Rooms | 107 (16.9%) | 17 (17.0%) |
| 8 or more Rooms | 47 (7.4%) | 0 (0.0%) |
| Total | 634 (100.0%) | 100 (100.0%) |
Housing Structure by Heating Type in Vazquez
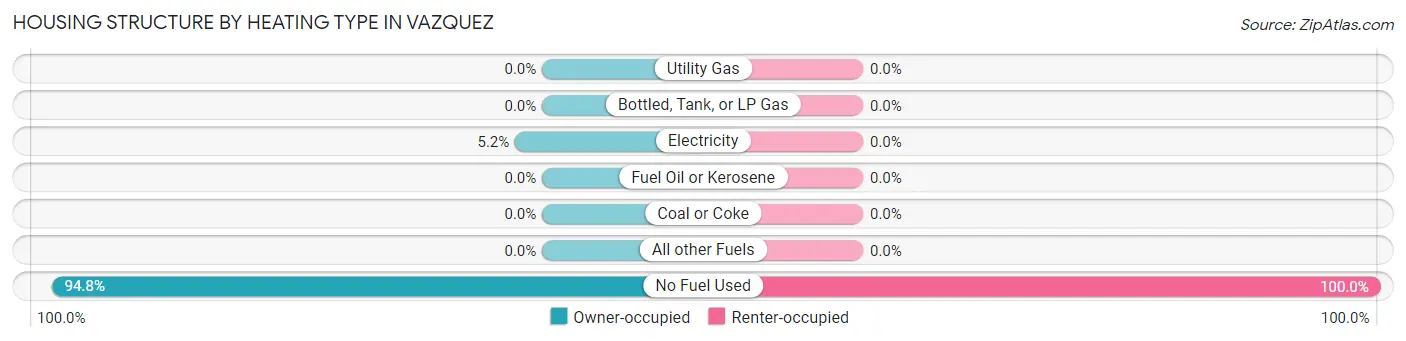
| Heating Type | Owner-occupied | Renter-occupied |
| Utility Gas | 0 (0.0%) | 0 (0.0%) |
| Bottled, Tank, or LP Gas | 0 (0.0%) | 0 (0.0%) |
| Electricity | 33 (5.2%) | 0 (0.0%) |
| Fuel Oil or Kerosene | 0 (0.0%) | 0 (0.0%) |
| Coal or Coke | 0 (0.0%) | 0 (0.0%) |
| All other Fuels | 0 (0.0%) | 0 (0.0%) |
| No Fuel Used | 601 (94.8%) | 100 (100.0%) |
| Total | 634 (100.0%) | 100 (100.0%) |
Household Vehicle Usage in Vazquez
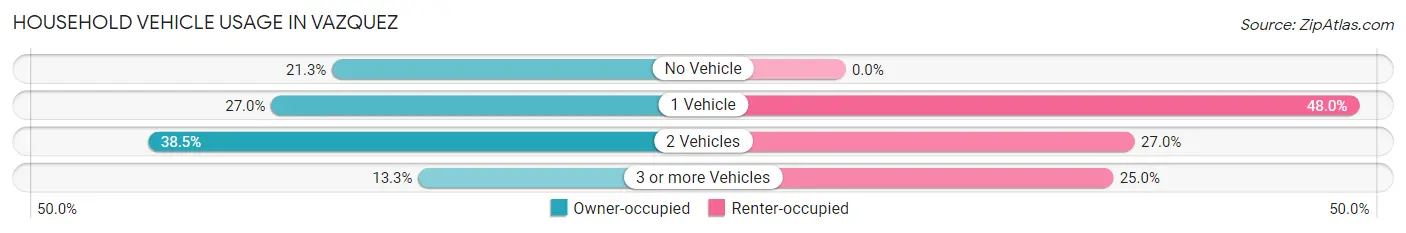
| Vehicles per Household | Owner-occupied | Renter-occupied |
| No Vehicle | 135 (21.3%) | 0 (0.0%) |
| 1 Vehicle | 171 (27.0%) | 48 (48.0%) |
| 2 Vehicles | 244 (38.5%) | 27 (27.0%) |
| 3 or more Vehicles | 84 (13.3%) | 25 (25.0%) |
| Total | 634 (100.0%) | 100 (100.0%) |
Real Estate & Mortgages in Vazquez
Real Estate and Mortgage Overview in Vazquez
| Characteristic | Without Mortgage | With Mortgage |
| Housing Units | 578 | 56 |
| Median Property Value | $76,200 | $0 |
| Median Household Income | $12,679 | $0 |
| Monthly Housing Costs | $148 | $0 |
| Real Estate Taxes | - | - |
Property Value by Mortgage Status in Vazquez
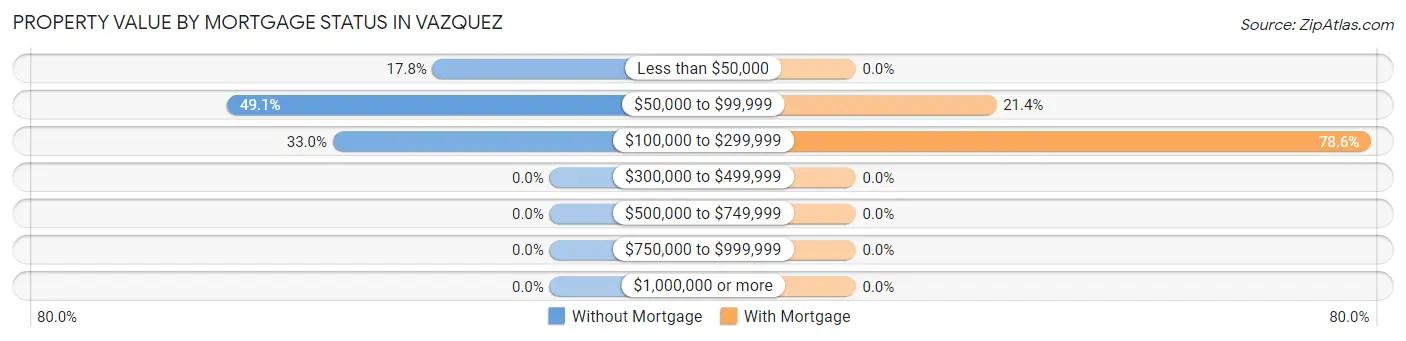
| Property Value | Without Mortgage | With Mortgage |
| Less than $50,000 | 103 (17.8%) | 0 (0.0%) |
| $50,000 to $99,999 | 284 (49.1%) | 12 (21.4%) |
| $100,000 to $299,999 | 191 (33.0%) | 44 (78.6%) |
| $300,000 to $499,999 | 0 (0.0%) | 0 (0.0%) |
| $500,000 to $749,999 | 0 (0.0%) | 0 (0.0%) |
| $750,000 to $999,999 | 0 (0.0%) | 0 (0.0%) |
| $1,000,000 or more | 0 (0.0%) | 0 (0.0%) |
| Total | 578 (100.0%) | 56 (100.0%) |
Household Income by Mortgage Status in Vazquez
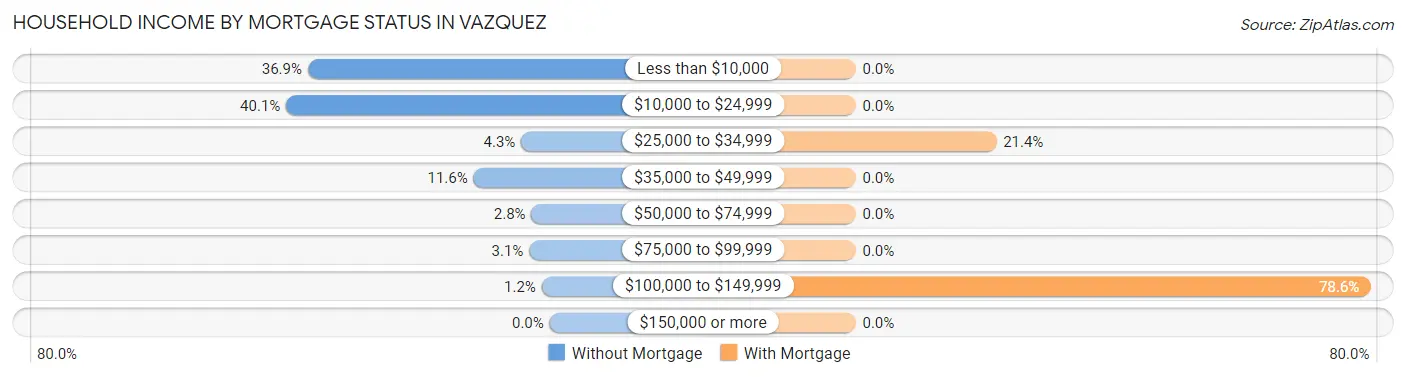
| Household Income | Without Mortgage | With Mortgage |
| Less than $10,000 | 213 (36.8%) | 0 (0.0%) |
| $10,000 to $24,999 | 232 (40.1%) | 0 (0.0%) |
| $25,000 to $34,999 | 25 (4.3%) | 12 (21.4%) |
| $35,000 to $49,999 | 67 (11.6%) | 0 (0.0%) |
| $50,000 to $74,999 | 16 (2.8%) | 0 (0.0%) |
| $75,000 to $99,999 | 18 (3.1%) | 0 (0.0%) |
| $100,000 to $149,999 | 7 (1.2%) | 44 (78.6%) |
| $150,000 or more | 0 (0.0%) | 0 (0.0%) |
| Total | 578 (100.0%) | 56 (100.0%) |
Property Value to Household Income Ratio in Vazquez
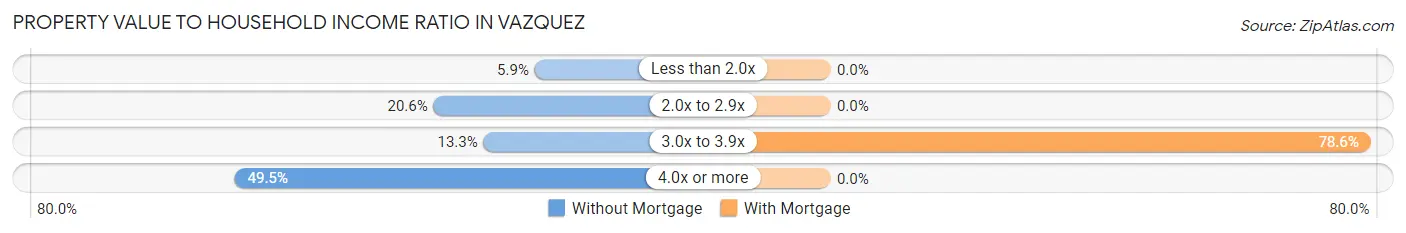
| Value-to-Income Ratio | Without Mortgage | With Mortgage |
| Less than 2.0x | 34 (5.9%) | 0 (0.0%) |
| 2.0x to 2.9x | 119 (20.6%) | 0 (0.0%) |
| 3.0x to 3.9x | 77 (13.3%) | 44 (78.6%) |
| 4.0x or more | 286 (49.5%) | 0 (0.0%) |
| Total | 578 (100.0%) | 56 (100.0%) |
Real Estate Taxes by Mortgage Status in Vazquez
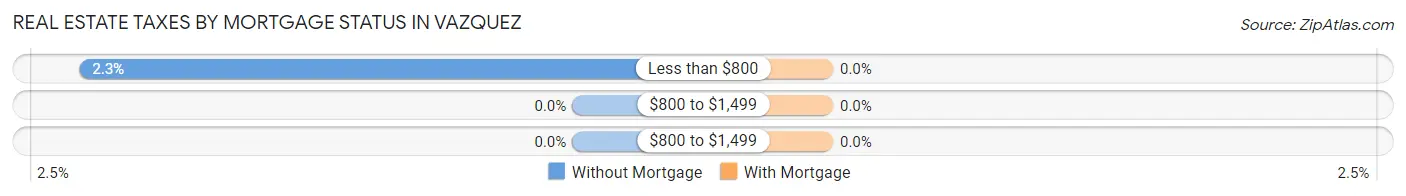
| Property Taxes | Without Mortgage | With Mortgage |
| Less than $800 | 13 (2.2%) | 0 (0.0%) |
| $800 to $1,499 | 0 (0.0%) | 0 (0.0%) |
| $800 to $1,499 | 0 (0.0%) | 0 (0.0%) |
| Total | 578 (100.0%) | 56 (100.0%) |
Health & Disability in Vazquez
Health Insurance Coverage by Age in Vazquez
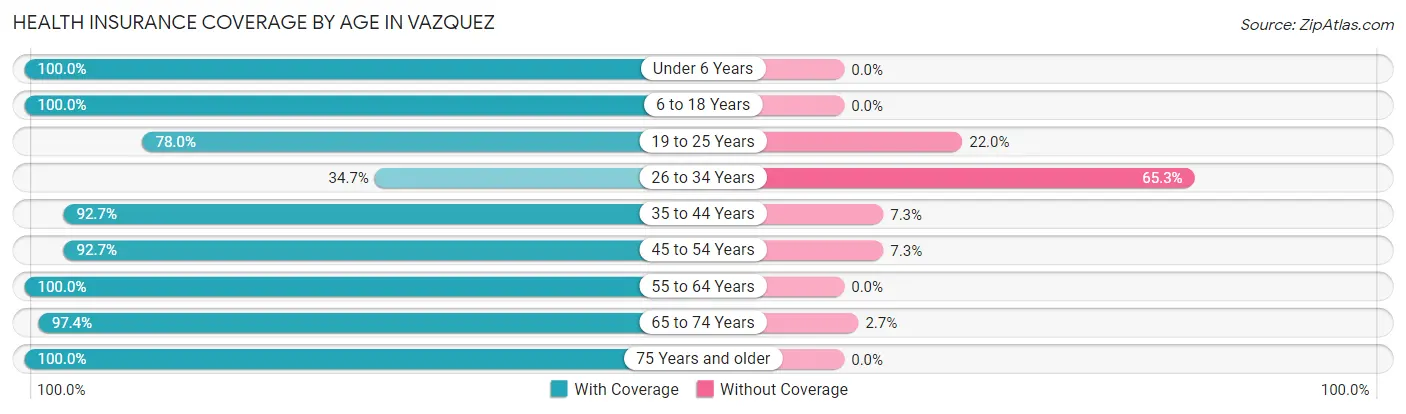
| Age Bracket | With Coverage | Without Coverage |
| Under 6 Years | 25 (100.0%) | 0 (0.0%) |
| 6 to 18 Years | 91 (100.0%) | 0 (0.0%) |
| 19 to 25 Years | 117 (78.0%) | 33 (22.0%) |
| 26 to 34 Years | 75 (34.7%) | 141 (65.3%) |
| 35 to 44 Years | 204 (92.7%) | 16 (7.3%) |
| 45 to 54 Years | 229 (92.7%) | 18 (7.3%) |
| 55 to 64 Years | 182 (100.0%) | 0 (0.0%) |
| 65 to 74 Years | 294 (97.4%) | 8 (2.6%) |
| 75 Years and older | 259 (100.0%) | 0 (0.0%) |
| Total | 1,476 (87.2%) | 216 (12.8%) |
Health Insurance Coverage by Citizenship Status in Vazquez
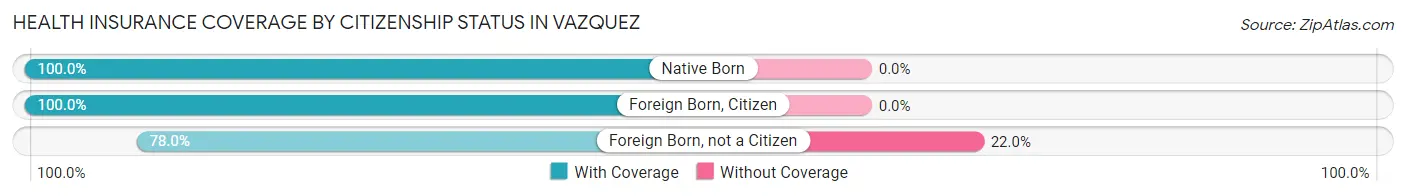
| Citizenship Status | With Coverage | Without Coverage |
| Native Born | 25 (100.0%) | 0 (0.0%) |
| Foreign Born, Citizen | 91 (100.0%) | 0 (0.0%) |
| Foreign Born, not a Citizen | 117 (78.0%) | 33 (22.0%) |
Health Insurance Coverage by Household Income in Vazquez
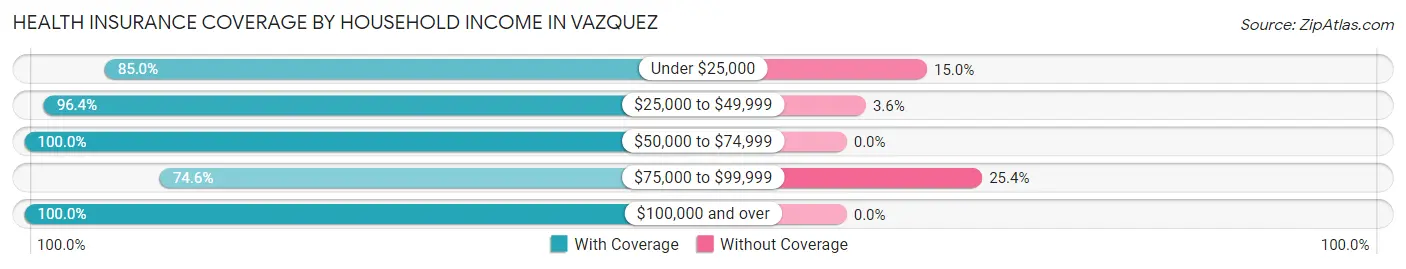
| Household Income | With Coverage | Without Coverage |
| Under $25,000 | 853 (85.0%) | 151 (15.0%) |
| $25,000 to $49,999 | 375 (96.4%) | 14 (3.6%) |
| $50,000 to $74,999 | 54 (100.0%) | 0 (0.0%) |
| $75,000 to $99,999 | 150 (74.6%) | 51 (25.4%) |
| $100,000 and over | 43 (100.0%) | 0 (0.0%) |
Public vs Private Health Insurance Coverage by Age in Vazquez
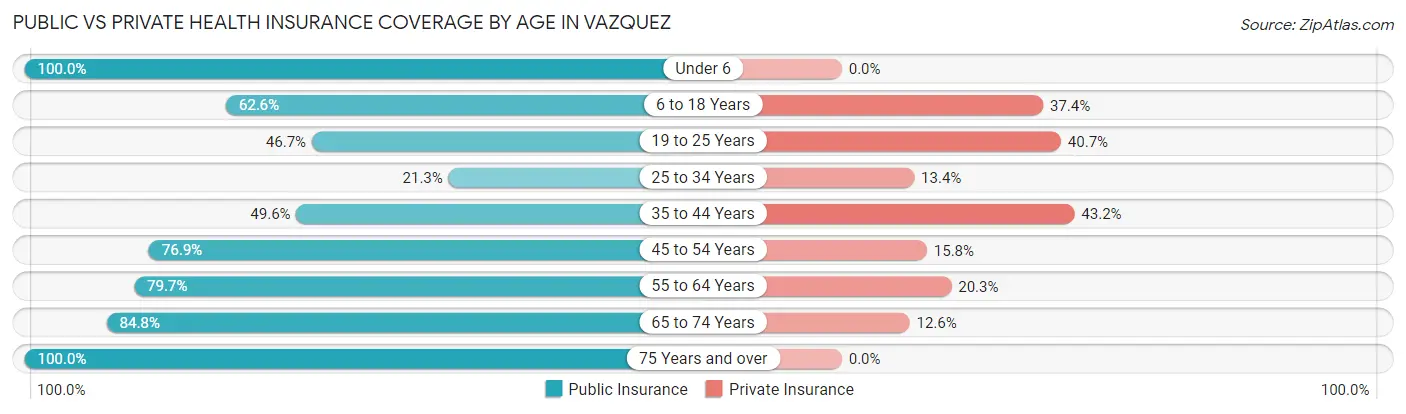
| Age Bracket | Public Insurance | Private Insurance |
| Under 6 | 25 (100.0%) | 0 (0.0%) |
| 6 to 18 Years | 57 (62.6%) | 34 (37.4%) |
| 19 to 25 Years | 70 (46.7%) | 61 (40.7%) |
| 25 to 34 Years | 46 (21.3%) | 29 (13.4%) |
| 35 to 44 Years | 109 (49.5%) | 95 (43.2%) |
| 45 to 54 Years | 190 (76.9%) | 39 (15.8%) |
| 55 to 64 Years | 145 (79.7%) | 37 (20.3%) |
| 65 to 74 Years | 256 (84.8%) | 38 (12.6%) |
| 75 Years and over | 259 (100.0%) | 0 (0.0%) |
| Total | 1,157 (68.4%) | 333 (19.7%) |
Disability Status by Sex by Age in Vazquez
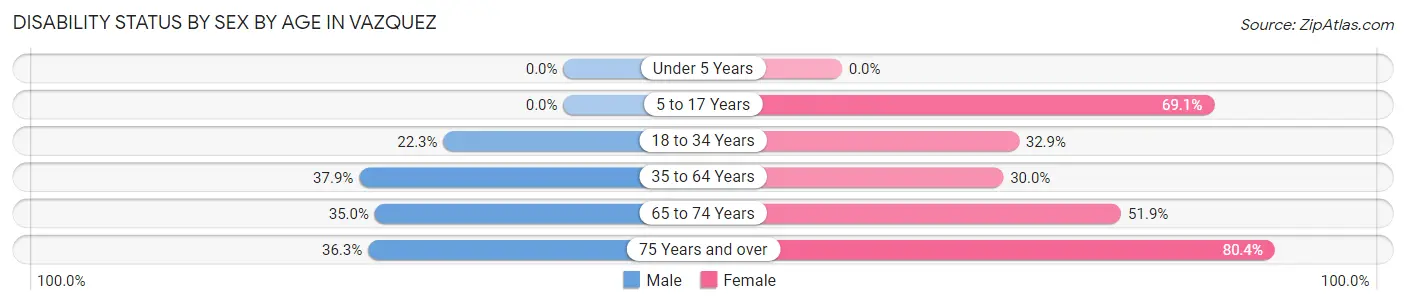
| Age Bracket | Male | Female |
| Under 5 Years | 0 (0.0%) | 0 (0.0%) |
| 5 to 17 Years | 0 (0.0%) | 38 (69.1%) |
| 18 to 34 Years | 51 (22.3%) | 45 (32.9%) |
| 35 to 64 Years | 141 (37.9%) | 83 (30.0%) |
| 65 to 74 Years | 49 (35.0%) | 84 (51.8%) |
| 75 Years and over | 33 (36.3%) | 135 (80.4%) |
Disability Class by Sex by Age in Vazquez
Disability Class: Hearing Difficulty
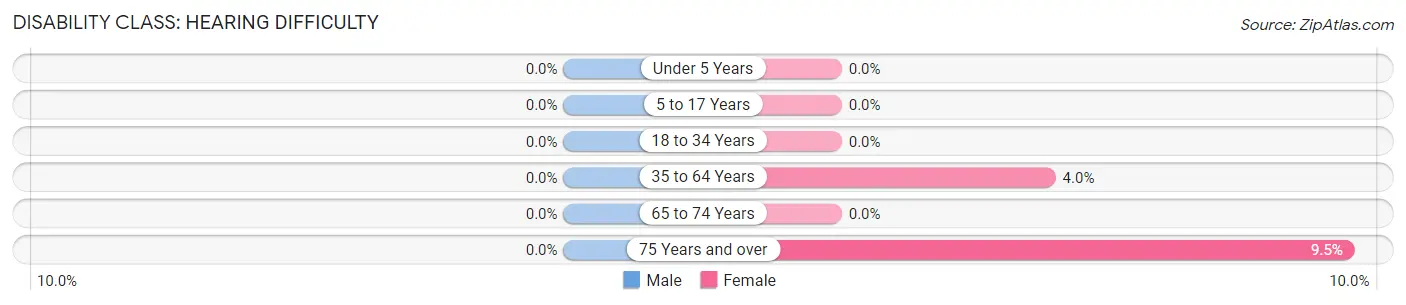
| Age Bracket | Male | Female |
| Under 5 Years | 0 (0.0%) | 0 (0.0%) |
| 5 to 17 Years | 0 (0.0%) | 0 (0.0%) |
| 18 to 34 Years | 0 (0.0%) | 0 (0.0%) |
| 35 to 64 Years | 0 (0.0%) | 11 (4.0%) |
| 65 to 74 Years | 0 (0.0%) | 0 (0.0%) |
| 75 Years and over | 0 (0.0%) | 16 (9.5%) |
Disability Class: Vision Difficulty
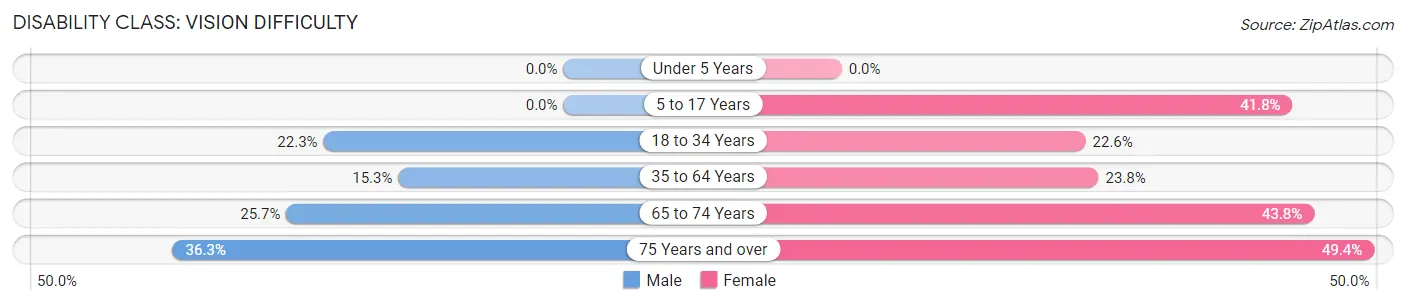
| Age Bracket | Male | Female |
| Under 5 Years | 0 (0.0%) | 0 (0.0%) |
| 5 to 17 Years | 0 (0.0%) | 23 (41.8%) |
| 18 to 34 Years | 51 (22.3%) | 31 (22.6%) |
| 35 to 64 Years | 57 (15.3%) | 66 (23.8%) |
| 65 to 74 Years | 36 (25.7%) | 71 (43.8%) |
| 75 Years and over | 33 (36.3%) | 83 (49.4%) |
Disability Class: Cognitive Difficulty
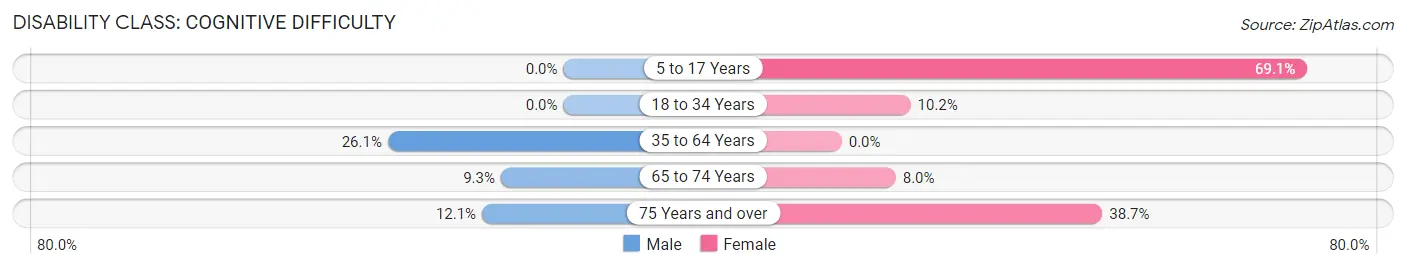
| Age Bracket | Male | Female |
| 5 to 17 Years | 0 (0.0%) | 38 (69.1%) |
| 18 to 34 Years | 0 (0.0%) | 14 (10.2%) |
| 35 to 64 Years | 97 (26.1%) | 0 (0.0%) |
| 65 to 74 Years | 13 (9.3%) | 13 (8.0%) |
| 75 Years and over | 11 (12.1%) | 65 (38.7%) |
Disability Class: Ambulatory Difficulty
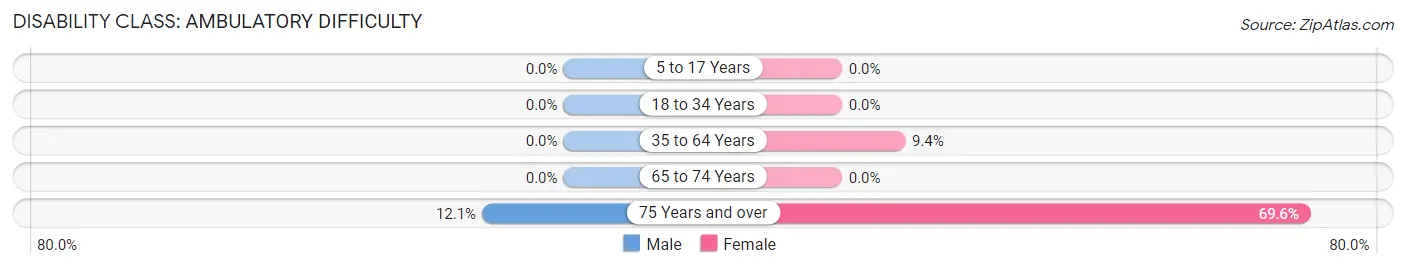
| Age Bracket | Male | Female |
| 5 to 17 Years | 0 (0.0%) | 0 (0.0%) |
| 18 to 34 Years | 0 (0.0%) | 0 (0.0%) |
| 35 to 64 Years | 0 (0.0%) | 26 (9.4%) |
| 65 to 74 Years | 0 (0.0%) | 0 (0.0%) |
| 75 Years and over | 11 (12.1%) | 117 (69.6%) |
Disability Class: Self-Care Difficulty
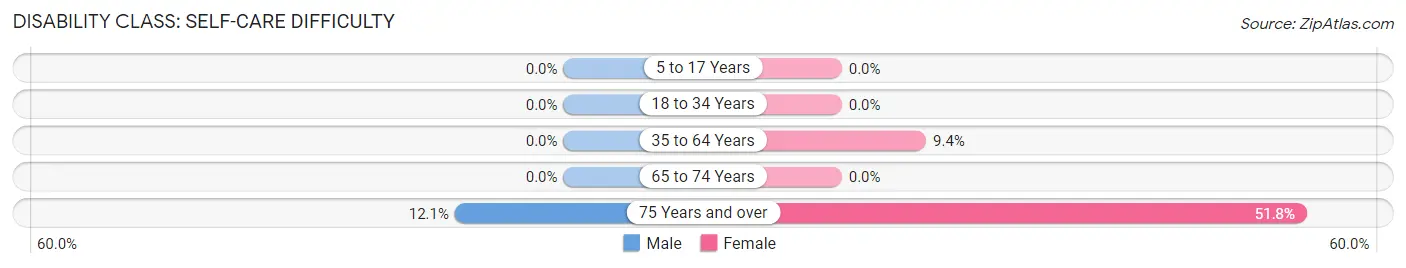
| Age Bracket | Male | Female |
| 5 to 17 Years | 0 (0.0%) | 0 (0.0%) |
| 18 to 34 Years | 0 (0.0%) | 0 (0.0%) |
| 35 to 64 Years | 0 (0.0%) | 26 (9.4%) |
| 65 to 74 Years | 0 (0.0%) | 0 (0.0%) |
| 75 Years and over | 11 (12.1%) | 87 (51.8%) |
Technology Access in Vazquez
Computing Device Access in Vazquez
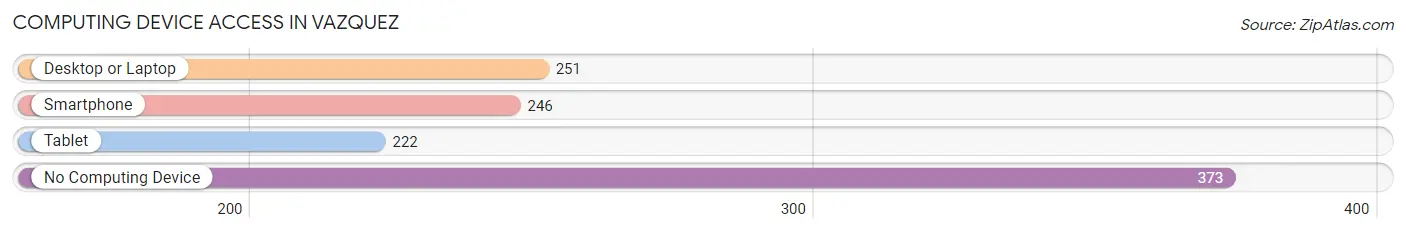
| Device Type | # Households | % Households |
| Desktop or Laptop | 251 | 34.2% |
| Smartphone | 246 | 33.5% |
| Tablet | 222 | 30.2% |
| No Computing Device | 373 | 50.8% |
| Total | 734 | 100.0% |
Internet Access in Vazquez
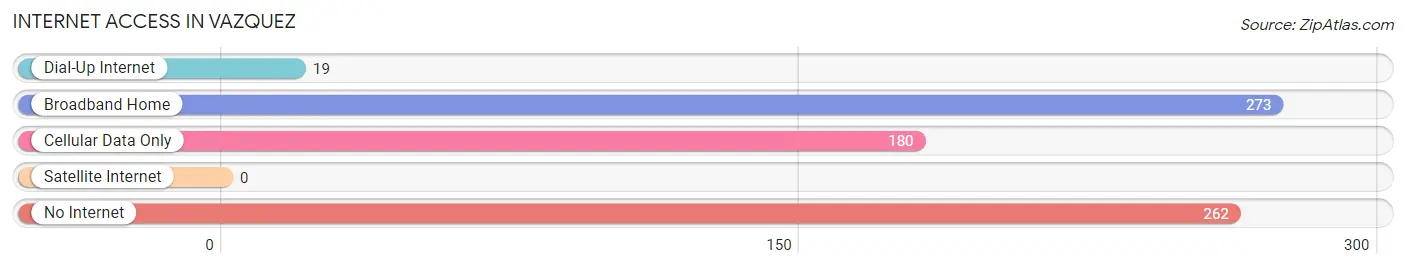
| Internet Type | # Households | % Households |
| Dial-Up Internet | 19 | 2.6% |
| Broadband Home | 273 | 37.2% |
| Cellular Data Only | 180 | 24.5% |
| Satellite Internet | 0 | 0.0% |
| No Internet | 262 | 35.7% |
| Total | 734 | 100.0% |
Vazquez Summary
The Commonwealth of Puerto Rico is an unincorporated territory of the United States located in the Caribbean Sea. It is the easternmost and smallest of the Greater Antilles, and is composed of the main island of Puerto Rico and several smaller islands. The island has a rich history, diverse geography, vibrant economy, and unique demographics.
History
Puerto Rico has a long and varied history, beginning with the arrival of the Taíno people in the 15th century. The Taíno were the first inhabitants of the island, and their culture and language had a significant influence on the development of Puerto Rico. The Spanish arrived in the 16th century and colonized the island, introducing Catholicism and Spanish culture. The island was ceded to the United States in 1898 following the Spanish-American War, and it became an unincorporated territory of the United States in 1917.
Since then, Puerto Rico has experienced a period of rapid economic growth and development, as well as a period of political turmoil. In 1952, Puerto Rico adopted its own constitution and became an autonomous commonwealth of the United States. In recent years, the island has experienced a period of economic stagnation and political unrest, culminating in a referendum in 2017 in which the majority of Puerto Ricans voted in favor of becoming a state of the United States.
Geography
Puerto Rico is located in the Caribbean Sea, east of the Dominican Republic and west of the Virgin Islands. The main island of Puerto Rico is approximately 100 miles long and 35 miles wide, and is composed of three distinct regions: the coastal lowlands, the central mountains, and the northern karst region. The island is home to a variety of landscapes, including lush rainforests, rugged mountains, and sandy beaches.
The island is also home to a number of rivers, including the Rio Grande de Loíza, the Rio Grande de Manatí, and the Rio de la Plata. The island is also home to a number of bays and lagoons, including the San Juan Bay, the Culebra Bay, and the San José Lagoon.
Economy
Puerto Rico has a vibrant and diverse economy, with a gross domestic product (GDP) of $103.3 billion in 2019. The island’s economy is largely driven by tourism, manufacturing, and services. The island is home to a number of large multinational corporations, including pharmaceutical giant Pfizer and consumer goods company Procter & Gamble.
The island’s economy has experienced a period of stagnation in recent years, due in part to the island’s high levels of public debt. In 2017, the island declared bankruptcy, and the government has since implemented a number of austerity measures in an effort to reduce the debt.
Demographics
Puerto Rico has a population of 3.2 million people, making it the most populous of the U.S. territories. The island is home to a diverse population, with the majority of the population being of Hispanic or Latino descent. The island is also home to a significant number of African-Americans, as well as a small but growing population of Asian-Americans.
The island’s population is largely concentrated in the metropolitan areas of San Juan and Ponce. The island’s population is also largely concentrated in the coastal regions, with the majority of the population living in the northern and eastern parts of the island.
Puerto Rico is a vibrant and diverse island with a rich history, diverse geography, vibrant economy, and unique demographics. The island has experienced a period of economic stagnation in recent years, but the government is working to reduce the island’s debt and revive the economy. The island’s population is diverse and largely concentrated in the metropolitan areas of San Juan and Ponce.
Common Questions
What is Per Capita Income in Vazquez?
Per Capita income in Vazquez is $11,009.
What is the Median Family Income in Vazquez?
Median Family Income in Vazquez is $21,949.
What is the Median Household income in Vazquez?
Median Household Income in Vazquez is $13,750.
What is Inequality or Gini Index in Vazquez?
Inequality or Gini Index in Vazquez is 0.55.
What is the Total Population of Vazquez?
Total Population of Vazquez is 1,692.
What is the Total Male Population of Vazquez?
Total Male Population of Vazquez is 893.
What is the Total Female Population of Vazquez?
Total Female Population of Vazquez is 799.
What is the Ratio of Males per 100 Females in Vazquez?
There are 111.76 Males per 100 Females in Vazquez.
What is the Ratio of Females per 100 Males in Vazquez?
There are 89.47 Females per 100 Males in Vazquez.
What is the Median Population Age in Vazquez?
Median Population Age in Vazquez is 50.9 Years.
What is the Average Family Size in Vazquez
Average Family Size in Vazquez is 3.1 People.
What is the Average Household Size in Vazquez
Average Household Size in Vazquez is 2.3 People.
How Large is the Labor Force in Vazquez?
There are 563 People in the Labor Forcein in Vazquez.
What is the Percentage of People in the Labor Force in Vazquez?
35.0% of People are in the Labor Force in Vazquez.
What is the Unemployment Rate in Vazquez?
Unemployment Rate in Vazquez is 11.7%.