Tlingit-Haida vs British Single Mother Poverty
COMPARE
Tlingit-Haida
British
Single Mother Poverty
Single Mother Poverty Comparison
Tlingit-Haida
British
30.9%
SINGLE MOTHER POVERTY
0.6/ 100
METRIC RATING
251st/ 347
METRIC RANK
29.2%
SINGLE MOTHER POVERTY
50.6/ 100
METRIC RATING
173rd/ 347
METRIC RANK
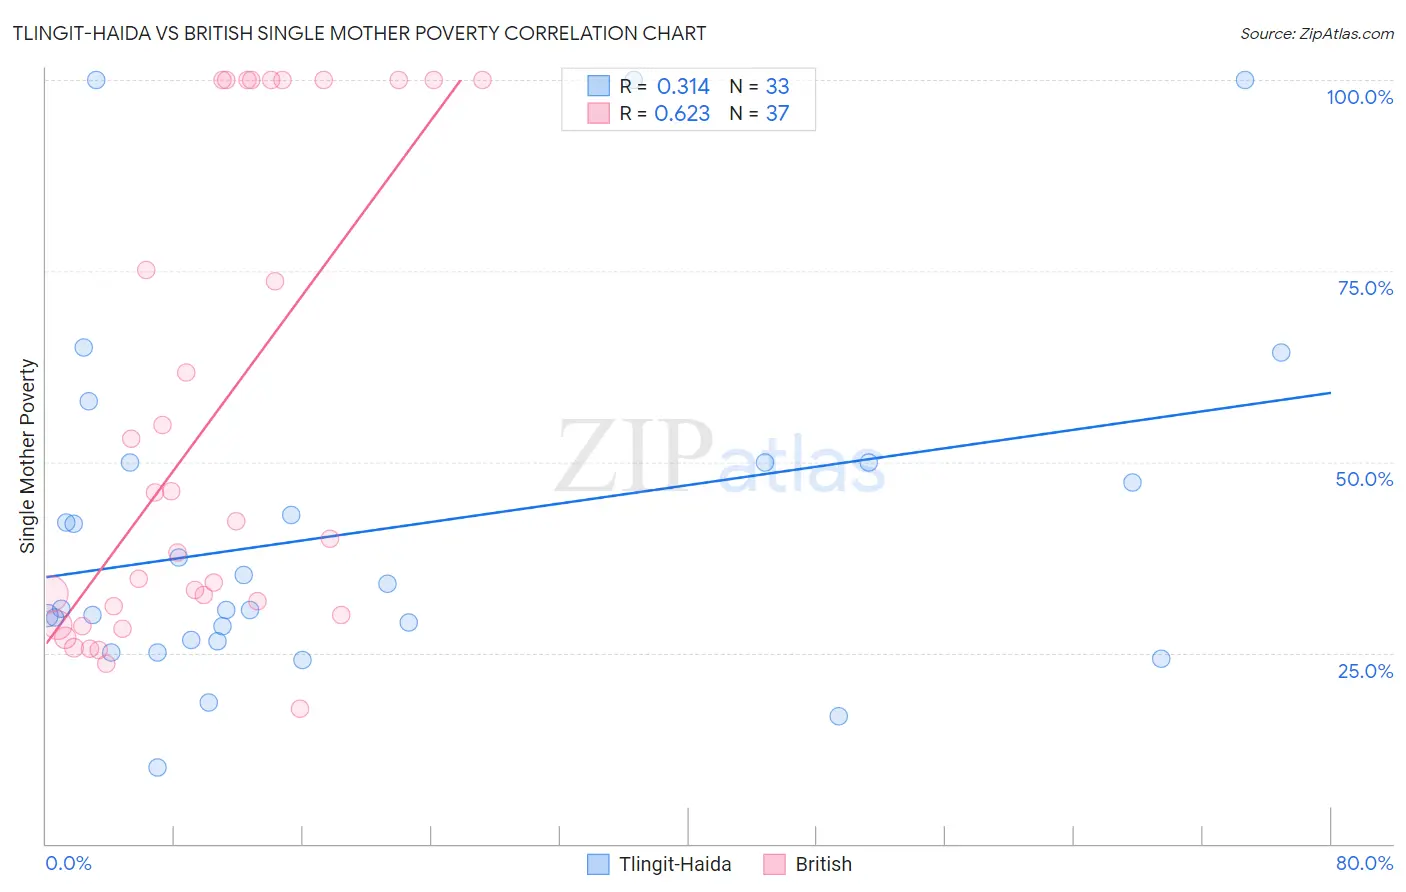
Tlingit-Haida vs British Single Mother Poverty Correlation Chart
The statistical analysis conducted on geographies consisting of 60,327,973 people shows a mild positive correlation between the proportion of Tlingit-Haida and poverty level among single mothers in the United States with a correlation coefficient (R) of 0.314 and weighted average of 30.9%. Similarly, the statistical analysis conducted on geographies consisting of 510,068,418 people shows a significant positive correlation between the proportion of British and poverty level among single mothers in the United States with a correlation coefficient (R) of 0.623 and weighted average of 29.2%, a difference of 6.0%.
Single Mother Poverty Correlation Summary
| Measurement | Tlingit-Haida | British |
| Minimum | 10.0% | 17.7% |
| Maximum | 100.0% | 100.0% |
| Range | 90.0% | 82.3% |
| Mean | 41.0% | 54.6% |
| Median | 30.7% | 40.0% |
| Interquartile 25% (IQ1) | 26.6% | 29.4% |
| Interquartile 75% (IQ3) | 50.0% | 100.0% |
| Interquartile Range (IQR) | 23.4% | 70.6% |
| Standard Deviation (Sample) | 22.9% | 30.6% |
| Standard Deviation (Population) | 22.6% | 30.2% |
Similar Demographics by Single Mother Poverty
Demographics Similar to Tlingit-Haida by Single Mother Poverty
In terms of single mother poverty, the demographic groups most similar to Tlingit-Haida are Alaska Native (30.9%, a difference of 0.010%), Celtic (30.9%, a difference of 0.040%), Vietnamese (30.9%, a difference of 0.12%), Senegalese (31.0%, a difference of 0.18%), and Cape Verdean (30.8%, a difference of 0.27%).
| Demographics | Rating | Rank | Single Mother Poverty |
| French | 1.3 /100 | #244 | Tragic 30.7% |
| Barbadians | 1.3 /100 | #245 | Tragic 30.7% |
| Ecuadorians | 0.9 /100 | #246 | Tragic 30.8% |
| West Indians | 0.9 /100 | #247 | Tragic 30.8% |
| French Canadians | 0.9 /100 | #248 | Tragic 30.8% |
| Cape Verdeans | 0.8 /100 | #249 | Tragic 30.8% |
| Vietnamese | 0.7 /100 | #250 | Tragic 30.9% |
| Tlingit-Haida | 0.6 /100 | #251 | Tragic 30.9% |
| Alaska Natives | 0.6 /100 | #252 | Tragic 30.9% |
| Celtics | 0.6 /100 | #253 | Tragic 30.9% |
| Senegalese | 0.5 /100 | #254 | Tragic 31.0% |
| Belizeans | 0.5 /100 | #255 | Tragic 31.0% |
| Immigrants | West Indies | 0.4 /100 | #256 | Tragic 31.1% |
| Immigrants | Bahamas | 0.4 /100 | #257 | Tragic 31.1% |
| Immigrants | Caribbean | 0.4 /100 | #258 | Tragic 31.1% |
Demographics Similar to British by Single Mother Poverty
In terms of single mother poverty, the demographic groups most similar to British are Immigrants from Saudi Arabia (29.2%, a difference of 0.030%), Immigrants from Costa Rica (29.2%, a difference of 0.090%), Hawaiian (29.2%, a difference of 0.13%), Carpatho Rusyn (29.1%, a difference of 0.16%), and New Zealander (29.1%, a difference of 0.22%).
| Demographics | Rating | Rank | Single Mother Poverty |
| Inupiat | 60.4 /100 | #166 | Good 29.0% |
| Costa Ricans | 58.4 /100 | #167 | Average 29.0% |
| Europeans | 57.6 /100 | #168 | Average 29.1% |
| Immigrants | Uruguay | 57.2 /100 | #169 | Average 29.1% |
| New Zealanders | 55.1 /100 | #170 | Average 29.1% |
| Puget Sound Salish | 55.1 /100 | #171 | Average 29.1% |
| Carpatho Rusyns | 53.8 /100 | #172 | Average 29.1% |
| British | 50.6 /100 | #173 | Average 29.2% |
| Immigrants | Saudi Arabia | 50.0 /100 | #174 | Average 29.2% |
| Immigrants | Costa Rica | 48.8 /100 | #175 | Average 29.2% |
| Hawaiians | 47.8 /100 | #176 | Average 29.2% |
| Immigrants | Bosnia and Herzegovina | 45.1 /100 | #177 | Average 29.2% |
| South American Indians | 43.2 /100 | #178 | Average 29.3% |
| Immigrants | Uzbekistan | 42.6 /100 | #179 | Average 29.3% |
| Immigrants | Norway | 41.5 /100 | #180 | Average 29.3% |