Tlingit-Haida vs Immigrants from Sweden Single Mother Poverty
COMPARE
Tlingit-Haida
Immigrants from Sweden
Single Mother Poverty
Single Mother Poverty Comparison
Tlingit-Haida
Immigrants from Sweden
30.9%
SINGLE MOTHER POVERTY
0.6/ 100
METRIC RATING
251st/ 347
METRIC RANK
27.5%
SINGLE MOTHER POVERTY
99.2/ 100
METRIC RATING
75th/ 347
METRIC RANK
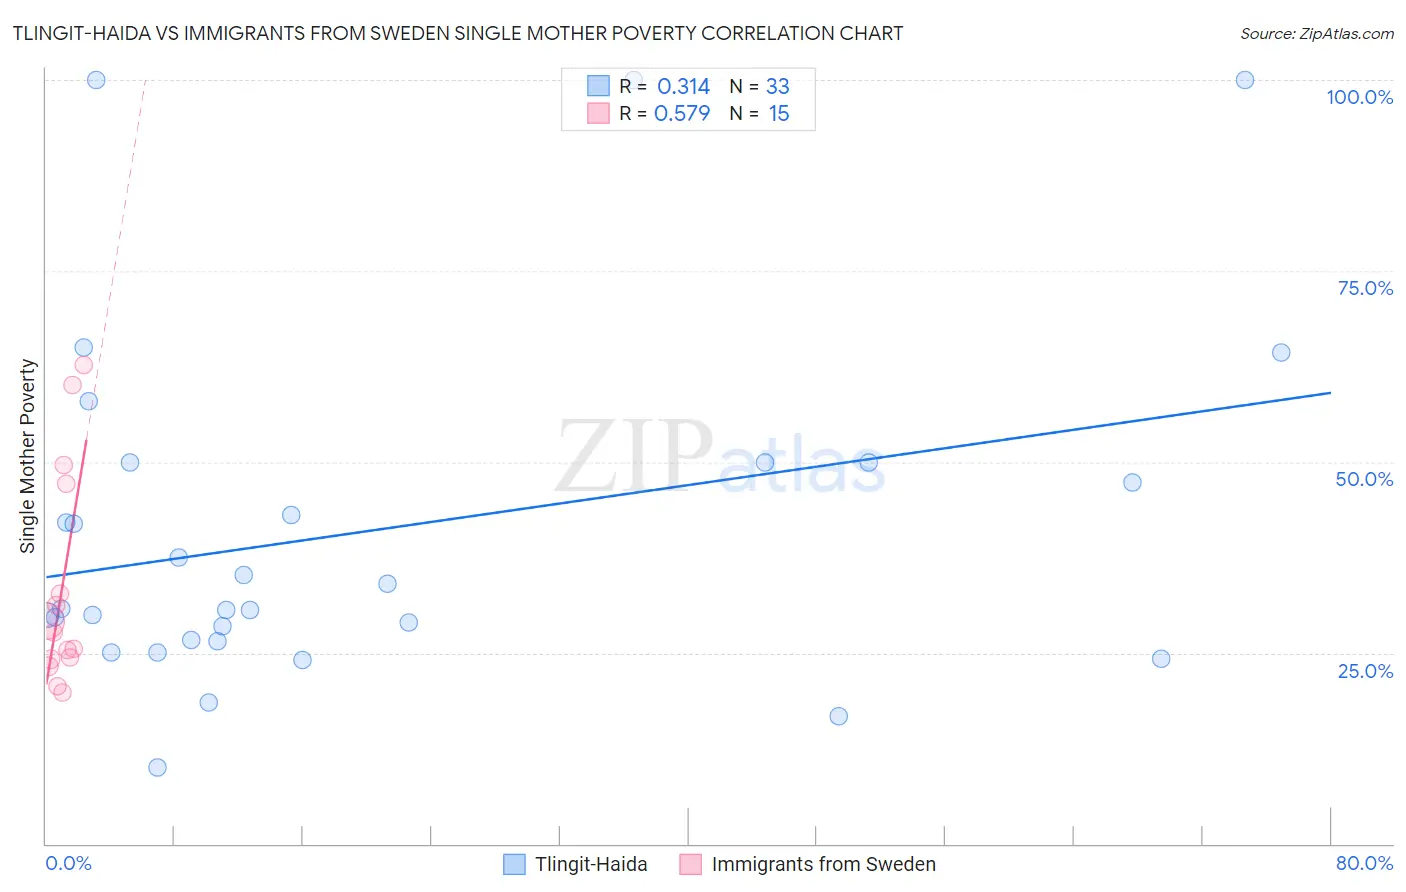
Tlingit-Haida vs Immigrants from Sweden Single Mother Poverty Correlation Chart
The statistical analysis conducted on geographies consisting of 60,327,973 people shows a mild positive correlation between the proportion of Tlingit-Haida and poverty level among single mothers in the United States with a correlation coefficient (R) of 0.314 and weighted average of 30.9%. Similarly, the statistical analysis conducted on geographies consisting of 161,889,555 people shows a substantial positive correlation between the proportion of Immigrants from Sweden and poverty level among single mothers in the United States with a correlation coefficient (R) of 0.579 and weighted average of 27.5%, a difference of 12.5%.
Single Mother Poverty Correlation Summary
| Measurement | Tlingit-Haida | Immigrants from Sweden |
| Minimum | 10.0% | 19.8% |
| Maximum | 100.0% | 62.7% |
| Range | 90.0% | 42.9% |
| Mean | 41.0% | 33.6% |
| Median | 30.7% | 27.7% |
| Interquartile 25% (IQ1) | 26.6% | 24.2% |
| Interquartile 75% (IQ3) | 50.0% | 47.2% |
| Interquartile Range (IQR) | 23.4% | 23.0% |
| Standard Deviation (Sample) | 22.9% | 14.2% |
| Standard Deviation (Population) | 22.6% | 13.7% |
Similar Demographics by Single Mother Poverty
Demographics Similar to Tlingit-Haida by Single Mother Poverty
In terms of single mother poverty, the demographic groups most similar to Tlingit-Haida are Alaska Native (30.9%, a difference of 0.010%), Celtic (30.9%, a difference of 0.040%), Vietnamese (30.9%, a difference of 0.12%), Senegalese (31.0%, a difference of 0.18%), and Cape Verdean (30.8%, a difference of 0.27%).
| Demographics | Rating | Rank | Single Mother Poverty |
| French | 1.3 /100 | #244 | Tragic 30.7% |
| Barbadians | 1.3 /100 | #245 | Tragic 30.7% |
| Ecuadorians | 0.9 /100 | #246 | Tragic 30.8% |
| West Indians | 0.9 /100 | #247 | Tragic 30.8% |
| French Canadians | 0.9 /100 | #248 | Tragic 30.8% |
| Cape Verdeans | 0.8 /100 | #249 | Tragic 30.8% |
| Vietnamese | 0.7 /100 | #250 | Tragic 30.9% |
| Tlingit-Haida | 0.6 /100 | #251 | Tragic 30.9% |
| Alaska Natives | 0.6 /100 | #252 | Tragic 30.9% |
| Celtics | 0.6 /100 | #253 | Tragic 30.9% |
| Senegalese | 0.5 /100 | #254 | Tragic 31.0% |
| Belizeans | 0.5 /100 | #255 | Tragic 31.0% |
| Immigrants | West Indies | 0.4 /100 | #256 | Tragic 31.1% |
| Immigrants | Bahamas | 0.4 /100 | #257 | Tragic 31.1% |
| Immigrants | Caribbean | 0.4 /100 | #258 | Tragic 31.1% |
Demographics Similar to Immigrants from Sweden by Single Mother Poverty
In terms of single mother poverty, the demographic groups most similar to Immigrants from Sweden are Peruvian (27.5%, a difference of 0.040%), Immigrants from Peru (27.5%, a difference of 0.060%), Immigrants from North Macedonia (27.5%, a difference of 0.080%), Immigrants from Italy (27.5%, a difference of 0.11%), and Taiwanese (27.5%, a difference of 0.11%).
| Demographics | Rating | Rank | Single Mother Poverty |
| Immigrants | Czechoslovakia | 99.5 /100 | #68 | Exceptional 27.4% |
| Lithuanians | 99.4 /100 | #69 | Exceptional 27.4% |
| Immigrants | Belarus | 99.4 /100 | #70 | Exceptional 27.4% |
| Macedonians | 99.4 /100 | #71 | Exceptional 27.4% |
| Immigrants | Russia | 99.4 /100 | #72 | Exceptional 27.4% |
| Sierra Leoneans | 99.3 /100 | #73 | Exceptional 27.4% |
| Immigrants | Europe | 99.3 /100 | #74 | Exceptional 27.4% |
| Immigrants | Sweden | 99.2 /100 | #75 | Exceptional 27.5% |
| Peruvians | 99.2 /100 | #76 | Exceptional 27.5% |
| Immigrants | Peru | 99.2 /100 | #77 | Exceptional 27.5% |
| Immigrants | North Macedonia | 99.2 /100 | #78 | Exceptional 27.5% |
| Immigrants | Italy | 99.1 /100 | #79 | Exceptional 27.5% |
| Taiwanese | 99.1 /100 | #80 | Exceptional 27.5% |
| Immigrants | Scotland | 98.9 /100 | #81 | Exceptional 27.6% |
| Immigrants | Cameroon | 98.8 /100 | #82 | Exceptional 27.6% |