Tlingit-Haida vs Jamaican Single Mother Poverty
COMPARE
Tlingit-Haida
Jamaican
Single Mother Poverty
Single Mother Poverty Comparison
Tlingit-Haida
Jamaicans
30.9%
SINGLE MOTHER POVERTY
0.6/ 100
METRIC RATING
251st/ 347
METRIC RANK
29.9%
SINGLE MOTHER POVERTY
11.7/ 100
METRIC RATING
215th/ 347
METRIC RANK
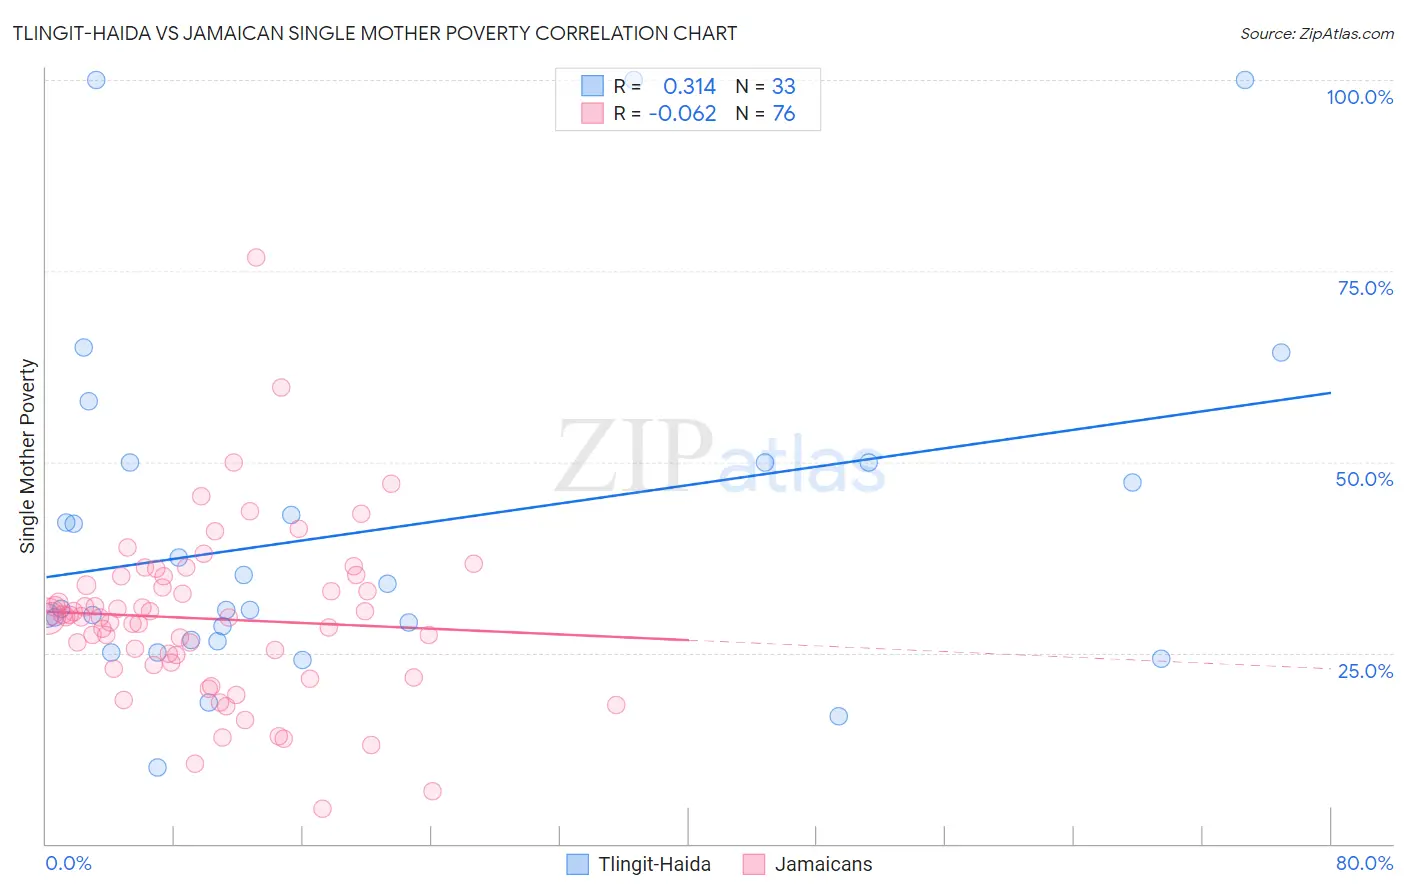
Tlingit-Haida vs Jamaican Single Mother Poverty Correlation Chart
The statistical analysis conducted on geographies consisting of 60,327,973 people shows a mild positive correlation between the proportion of Tlingit-Haida and poverty level among single mothers in the United States with a correlation coefficient (R) of 0.314 and weighted average of 30.9%. Similarly, the statistical analysis conducted on geographies consisting of 360,593,795 people shows a slight negative correlation between the proportion of Jamaicans and poverty level among single mothers in the United States with a correlation coefficient (R) of -0.062 and weighted average of 29.9%, a difference of 3.5%.
Single Mother Poverty Correlation Summary
| Measurement | Tlingit-Haida | Jamaican |
| Minimum | 10.0% | 4.6% |
| Maximum | 100.0% | 76.7% |
| Range | 90.0% | 72.1% |
| Mean | 41.0% | 29.5% |
| Median | 30.7% | 29.7% |
| Interquartile 25% (IQ1) | 26.6% | 23.5% |
| Interquartile 75% (IQ3) | 50.0% | 34.4% |
| Interquartile Range (IQR) | 23.4% | 10.9% |
| Standard Deviation (Sample) | 22.9% | 11.0% |
| Standard Deviation (Population) | 22.6% | 11.0% |
Similar Demographics by Single Mother Poverty
Demographics Similar to Tlingit-Haida by Single Mother Poverty
In terms of single mother poverty, the demographic groups most similar to Tlingit-Haida are Alaska Native (30.9%, a difference of 0.010%), Celtic (30.9%, a difference of 0.040%), Vietnamese (30.9%, a difference of 0.12%), Senegalese (31.0%, a difference of 0.18%), and Cape Verdean (30.8%, a difference of 0.27%).
| Demographics | Rating | Rank | Single Mother Poverty |
| French | 1.3 /100 | #244 | Tragic 30.7% |
| Barbadians | 1.3 /100 | #245 | Tragic 30.7% |
| Ecuadorians | 0.9 /100 | #246 | Tragic 30.8% |
| West Indians | 0.9 /100 | #247 | Tragic 30.8% |
| French Canadians | 0.9 /100 | #248 | Tragic 30.8% |
| Cape Verdeans | 0.8 /100 | #249 | Tragic 30.8% |
| Vietnamese | 0.7 /100 | #250 | Tragic 30.9% |
| Tlingit-Haida | 0.6 /100 | #251 | Tragic 30.9% |
| Alaska Natives | 0.6 /100 | #252 | Tragic 30.9% |
| Celtics | 0.6 /100 | #253 | Tragic 30.9% |
| Senegalese | 0.5 /100 | #254 | Tragic 31.0% |
| Belizeans | 0.5 /100 | #255 | Tragic 31.0% |
| Immigrants | West Indies | 0.4 /100 | #256 | Tragic 31.1% |
| Immigrants | Bahamas | 0.4 /100 | #257 | Tragic 31.1% |
| Immigrants | Caribbean | 0.4 /100 | #258 | Tragic 31.1% |
Demographics Similar to Jamaicans by Single Mother Poverty
In terms of single mother poverty, the demographic groups most similar to Jamaicans are Liberian (29.9%, a difference of 0.0%), Immigrants from Western Africa (29.9%, a difference of 0.020%), Immigrants from Thailand (29.9%, a difference of 0.030%), Immigrants from Ghana (29.9%, a difference of 0.040%), and Nicaraguan (29.8%, a difference of 0.080%).
| Demographics | Rating | Rank | Single Mother Poverty |
| Immigrants | Guyana | 14.7 /100 | #208 | Poor 29.8% |
| Irish | 13.9 /100 | #209 | Poor 29.8% |
| Haitians | 13.3 /100 | #210 | Poor 29.8% |
| Guyanese | 12.8 /100 | #211 | Poor 29.8% |
| Nicaraguans | 12.4 /100 | #212 | Poor 29.8% |
| Immigrants | Thailand | 12.0 /100 | #213 | Poor 29.9% |
| Liberians | 11.7 /100 | #214 | Poor 29.9% |
| Jamaicans | 11.7 /100 | #215 | Poor 29.9% |
| Immigrants | Western Africa | 11.5 /100 | #216 | Poor 29.9% |
| Immigrants | Ghana | 11.3 /100 | #217 | Poor 29.9% |
| Hungarians | 10.3 /100 | #218 | Poor 29.9% |
| Finns | 9.3 /100 | #219 | Tragic 30.0% |
| Germans | 8.8 /100 | #220 | Tragic 30.0% |
| Immigrants | Eritrea | 7.7 /100 | #221 | Tragic 30.0% |
| Sudanese | 7.6 /100 | #222 | Tragic 30.0% |