Tlingit-Haida vs Bangladeshi Single Mother Poverty
COMPARE
Tlingit-Haida
Bangladeshi
Single Mother Poverty
Single Mother Poverty Comparison
Tlingit-Haida
Bangladeshis
30.9%
SINGLE MOTHER POVERTY
0.6/ 100
METRIC RATING
251st/ 347
METRIC RANK
31.7%
SINGLE MOTHER POVERTY
0.1/ 100
METRIC RATING
274th/ 347
METRIC RANK
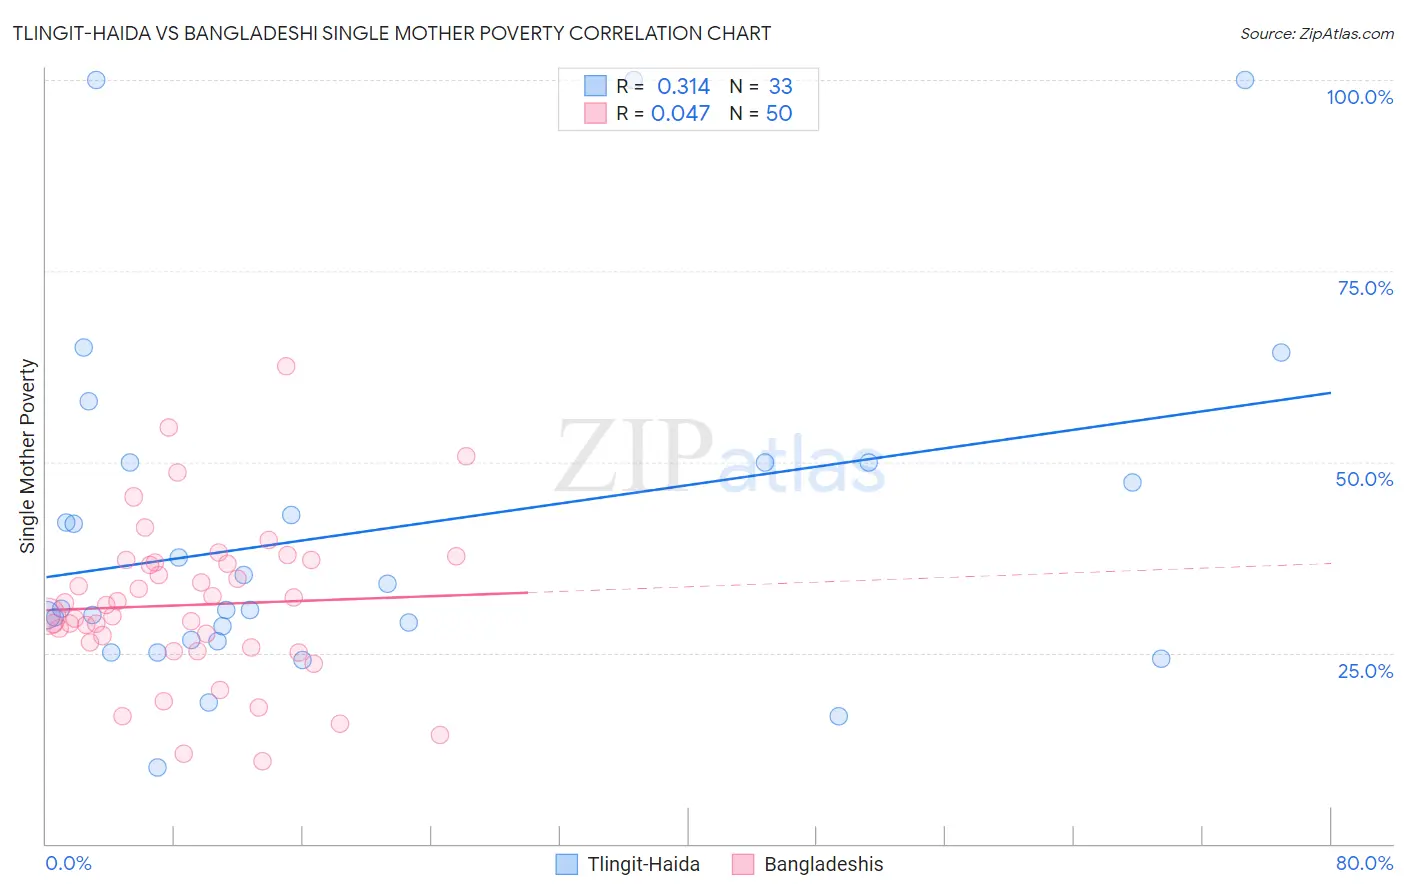
Tlingit-Haida vs Bangladeshi Single Mother Poverty Correlation Chart
The statistical analysis conducted on geographies consisting of 60,327,973 people shows a mild positive correlation between the proportion of Tlingit-Haida and poverty level among single mothers in the United States with a correlation coefficient (R) of 0.314 and weighted average of 30.9%. Similarly, the statistical analysis conducted on geographies consisting of 140,162,817 people shows no correlation between the proportion of Bangladeshis and poverty level among single mothers in the United States with a correlation coefficient (R) of 0.047 and weighted average of 31.7%, a difference of 2.6%.
Single Mother Poverty Correlation Summary
| Measurement | Tlingit-Haida | Bangladeshi |
| Minimum | 10.0% | 10.8% |
| Maximum | 100.0% | 62.5% |
| Range | 90.0% | 51.7% |
| Mean | 41.0% | 31.3% |
| Median | 30.7% | 30.5% |
| Interquartile 25% (IQ1) | 26.6% | 25.7% |
| Interquartile 75% (IQ3) | 50.0% | 36.8% |
| Interquartile Range (IQR) | 23.4% | 11.1% |
| Standard Deviation (Sample) | 22.9% | 10.3% |
| Standard Deviation (Population) | 22.6% | 10.2% |
Similar Demographics by Single Mother Poverty
Demographics Similar to Tlingit-Haida by Single Mother Poverty
In terms of single mother poverty, the demographic groups most similar to Tlingit-Haida are Alaska Native (30.9%, a difference of 0.010%), Celtic (30.9%, a difference of 0.040%), Vietnamese (30.9%, a difference of 0.12%), Senegalese (31.0%, a difference of 0.18%), and Cape Verdean (30.8%, a difference of 0.27%).
| Demographics | Rating | Rank | Single Mother Poverty |
| French | 1.3 /100 | #244 | Tragic 30.7% |
| Barbadians | 1.3 /100 | #245 | Tragic 30.7% |
| Ecuadorians | 0.9 /100 | #246 | Tragic 30.8% |
| West Indians | 0.9 /100 | #247 | Tragic 30.8% |
| French Canadians | 0.9 /100 | #248 | Tragic 30.8% |
| Cape Verdeans | 0.8 /100 | #249 | Tragic 30.8% |
| Vietnamese | 0.7 /100 | #250 | Tragic 30.9% |
| Tlingit-Haida | 0.6 /100 | #251 | Tragic 30.9% |
| Alaska Natives | 0.6 /100 | #252 | Tragic 30.9% |
| Celtics | 0.6 /100 | #253 | Tragic 30.9% |
| Senegalese | 0.5 /100 | #254 | Tragic 31.0% |
| Belizeans | 0.5 /100 | #255 | Tragic 31.0% |
| Immigrants | West Indies | 0.4 /100 | #256 | Tragic 31.1% |
| Immigrants | Bahamas | 0.4 /100 | #257 | Tragic 31.1% |
| Immigrants | Caribbean | 0.4 /100 | #258 | Tragic 31.1% |
Demographics Similar to Bangladeshis by Single Mother Poverty
In terms of single mother poverty, the demographic groups most similar to Bangladeshis are Central American (31.8%, a difference of 0.19%), Fijian (31.6%, a difference of 0.23%), Delaware (31.8%, a difference of 0.35%), Immigrants from Micronesia (31.6%, a difference of 0.46%), and Immigrants from Cabo Verde (31.6%, a difference of 0.48%).
| Demographics | Rating | Rank | Single Mother Poverty |
| Immigrants | Belize | 0.2 /100 | #267 | Tragic 31.4% |
| Immigrants | Senegal | 0.1 /100 | #268 | Tragic 31.5% |
| Scotch-Irish | 0.1 /100 | #269 | Tragic 31.5% |
| British West Indians | 0.1 /100 | #270 | Tragic 31.5% |
| Immigrants | Cabo Verde | 0.1 /100 | #271 | Tragic 31.6% |
| Immigrants | Micronesia | 0.1 /100 | #272 | Tragic 31.6% |
| Fijians | 0.1 /100 | #273 | Tragic 31.6% |
| Bangladeshis | 0.1 /100 | #274 | Tragic 31.7% |
| Central Americans | 0.1 /100 | #275 | Tragic 31.8% |
| Delaware | 0.0 /100 | #276 | Tragic 31.8% |
| Mexican American Indians | 0.0 /100 | #277 | Tragic 31.9% |
| Immigrants | Zaire | 0.0 /100 | #278 | Tragic 32.0% |
| Marshallese | 0.0 /100 | #279 | Tragic 32.1% |
| Immigrants | Nonimmigrants | 0.0 /100 | #280 | Tragic 32.2% |
| Cree | 0.0 /100 | #281 | Tragic 32.2% |