Tlingit-Haida vs Northern European Single Mother Poverty
COMPARE
Tlingit-Haida
Northern European
Single Mother Poverty
Single Mother Poverty Comparison
Tlingit-Haida
Northern Europeans
30.9%
SINGLE MOTHER POVERTY
0.6/ 100
METRIC RATING
251st/ 347
METRIC RANK
28.6%
SINGLE MOTHER POVERTY
81.7/ 100
METRIC RATING
150th/ 347
METRIC RANK
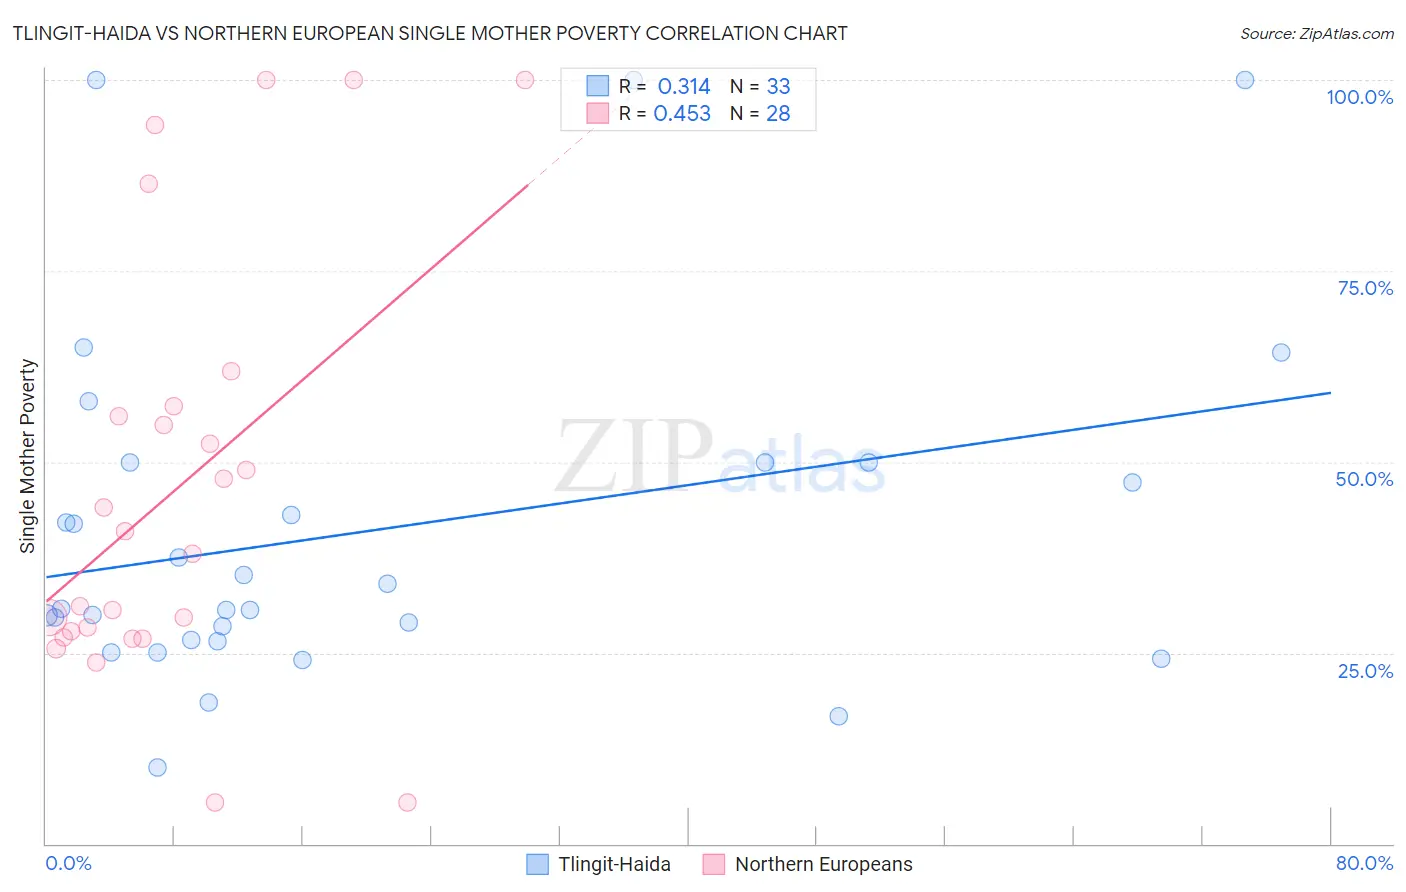
Tlingit-Haida vs Northern European Single Mother Poverty Correlation Chart
The statistical analysis conducted on geographies consisting of 60,327,973 people shows a mild positive correlation between the proportion of Tlingit-Haida and poverty level among single mothers in the United States with a correlation coefficient (R) of 0.314 and weighted average of 30.9%. Similarly, the statistical analysis conducted on geographies consisting of 394,065,574 people shows a moderate positive correlation between the proportion of Northern Europeans and poverty level among single mothers in the United States with a correlation coefficient (R) of 0.453 and weighted average of 28.6%, a difference of 8.0%.
Single Mother Poverty Correlation Summary
| Measurement | Tlingit-Haida | Northern European |
| Minimum | 10.0% | 5.4% |
| Maximum | 100.0% | 100.0% |
| Range | 90.0% | 94.6% |
| Mean | 41.0% | 46.4% |
| Median | 30.7% | 39.4% |
| Interquartile 25% (IQ1) | 26.6% | 27.4% |
| Interquartile 75% (IQ3) | 50.0% | 56.6% |
| Interquartile Range (IQR) | 23.4% | 29.2% |
| Standard Deviation (Sample) | 22.9% | 27.4% |
| Standard Deviation (Population) | 22.6% | 26.9% |
Similar Demographics by Single Mother Poverty
Demographics Similar to Tlingit-Haida by Single Mother Poverty
In terms of single mother poverty, the demographic groups most similar to Tlingit-Haida are Alaska Native (30.9%, a difference of 0.010%), Celtic (30.9%, a difference of 0.040%), Vietnamese (30.9%, a difference of 0.12%), Senegalese (31.0%, a difference of 0.18%), and Cape Verdean (30.8%, a difference of 0.27%).
| Demographics | Rating | Rank | Single Mother Poverty |
| French | 1.3 /100 | #244 | Tragic 30.7% |
| Barbadians | 1.3 /100 | #245 | Tragic 30.7% |
| Ecuadorians | 0.9 /100 | #246 | Tragic 30.8% |
| West Indians | 0.9 /100 | #247 | Tragic 30.8% |
| French Canadians | 0.9 /100 | #248 | Tragic 30.8% |
| Cape Verdeans | 0.8 /100 | #249 | Tragic 30.8% |
| Vietnamese | 0.7 /100 | #250 | Tragic 30.9% |
| Tlingit-Haida | 0.6 /100 | #251 | Tragic 30.9% |
| Alaska Natives | 0.6 /100 | #252 | Tragic 30.9% |
| Celtics | 0.6 /100 | #253 | Tragic 30.9% |
| Senegalese | 0.5 /100 | #254 | Tragic 31.0% |
| Belizeans | 0.5 /100 | #255 | Tragic 31.0% |
| Immigrants | West Indies | 0.4 /100 | #256 | Tragic 31.1% |
| Immigrants | Bahamas | 0.4 /100 | #257 | Tragic 31.1% |
| Immigrants | Caribbean | 0.4 /100 | #258 | Tragic 31.1% |
Demographics Similar to Northern Europeans by Single Mother Poverty
In terms of single mother poverty, the demographic groups most similar to Northern Europeans are Immigrants from Oceania (28.7%, a difference of 0.14%), Austrian (28.7%, a difference of 0.21%), Serbian (28.6%, a difference of 0.30%), Syrian (28.6%, a difference of 0.32%), and Immigrants from Lebanon (28.6%, a difference of 0.33%).
| Demographics | Rating | Rank | Single Mother Poverty |
| Immigrants | North America | 86.5 /100 | #143 | Excellent 28.5% |
| Luxembourgers | 86.4 /100 | #144 | Excellent 28.5% |
| Immigrants | South America | 86.1 /100 | #145 | Excellent 28.5% |
| Immigrants | Denmark | 86.1 /100 | #146 | Excellent 28.5% |
| Immigrants | Lebanon | 85.3 /100 | #147 | Excellent 28.6% |
| Syrians | 85.3 /100 | #148 | Excellent 28.6% |
| Serbians | 85.0 /100 | #149 | Excellent 28.6% |
| Northern Europeans | 81.7 /100 | #150 | Excellent 28.6% |
| Immigrants | Oceania | 79.9 /100 | #151 | Good 28.7% |
| Austrians | 79.0 /100 | #152 | Good 28.7% |
| Slovenes | 76.4 /100 | #153 | Good 28.8% |
| Portuguese | 73.2 /100 | #154 | Good 28.8% |
| Ugandans | 71.7 /100 | #155 | Good 28.8% |
| Iraqis | 71.5 /100 | #156 | Good 28.8% |
| Immigrants | Western Europe | 71.1 /100 | #157 | Good 28.9% |