Tlingit-Haida vs Immigrants from Ecuador Single Mother Poverty
COMPARE
Tlingit-Haida
Immigrants from Ecuador
Single Mother Poverty
Single Mother Poverty Comparison
Tlingit-Haida
Immigrants from Ecuador
30.9%
SINGLE MOTHER POVERTY
0.6/ 100
METRIC RATING
251st/ 347
METRIC RANK
31.3%
SINGLE MOTHER POVERTY
0.2/ 100
METRIC RATING
264th/ 347
METRIC RANK
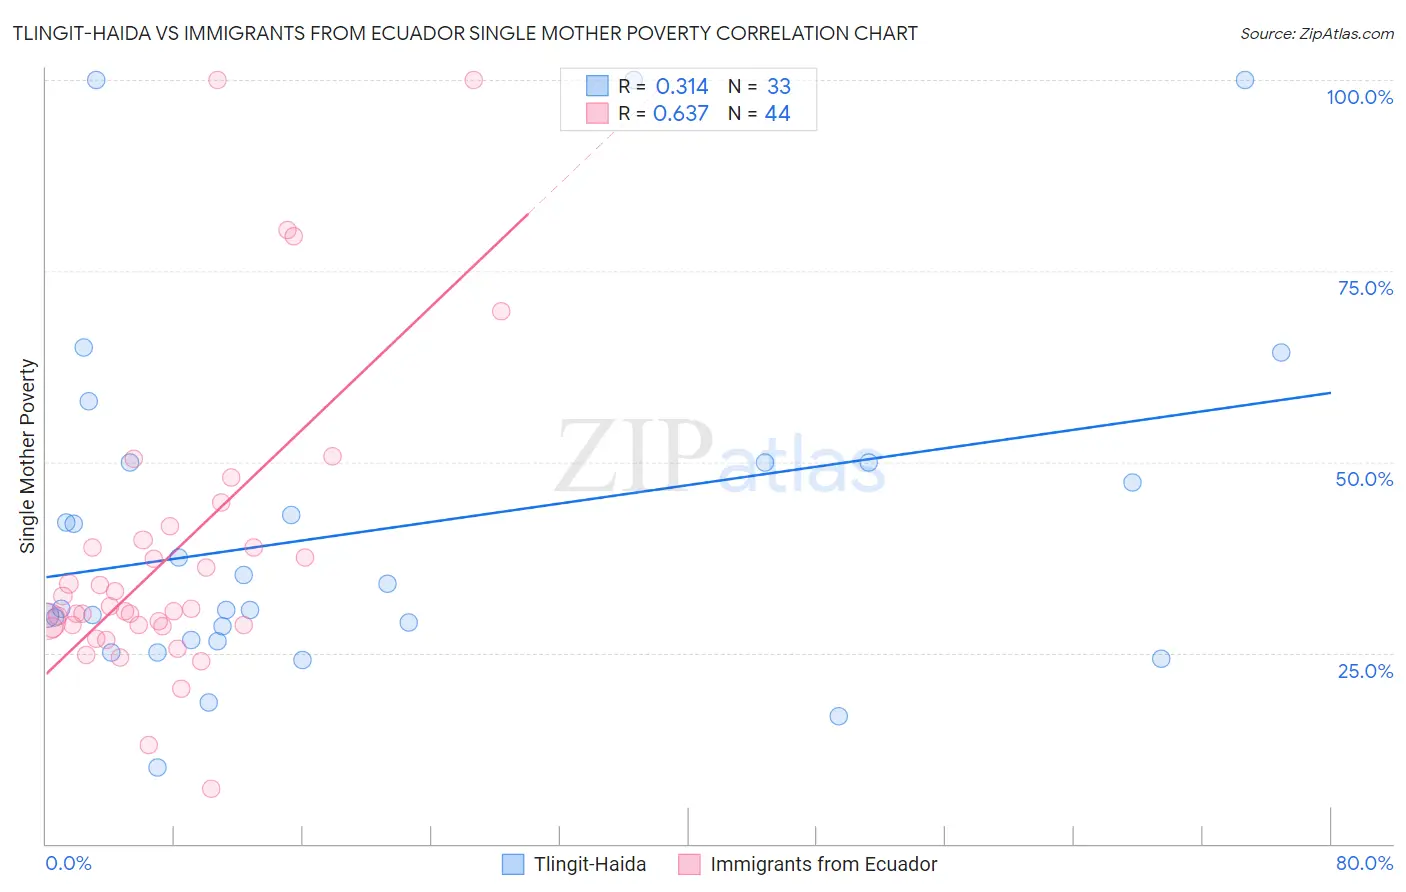
Tlingit-Haida vs Immigrants from Ecuador Single Mother Poverty Correlation Chart
The statistical analysis conducted on geographies consisting of 60,327,973 people shows a mild positive correlation between the proportion of Tlingit-Haida and poverty level among single mothers in the United States with a correlation coefficient (R) of 0.314 and weighted average of 30.9%. Similarly, the statistical analysis conducted on geographies consisting of 266,047,722 people shows a significant positive correlation between the proportion of Immigrants from Ecuador and poverty level among single mothers in the United States with a correlation coefficient (R) of 0.637 and weighted average of 31.3%, a difference of 1.3%.
Single Mother Poverty Correlation Summary
| Measurement | Tlingit-Haida | Immigrants from Ecuador |
| Minimum | 10.0% | 7.3% |
| Maximum | 100.0% | 100.0% |
| Range | 90.0% | 92.7% |
| Mean | 41.0% | 37.8% |
| Median | 30.7% | 30.6% |
| Interquartile 25% (IQ1) | 26.6% | 28.6% |
| Interquartile 75% (IQ3) | 50.0% | 39.3% |
| Interquartile Range (IQR) | 23.4% | 10.8% |
| Standard Deviation (Sample) | 22.9% | 19.7% |
| Standard Deviation (Population) | 22.6% | 19.5% |
Demographics Similar to Tlingit-Haida and Immigrants from Ecuador by Single Mother Poverty
In terms of single mother poverty, the demographic groups most similar to Tlingit-Haida are Alaska Native (30.9%, a difference of 0.010%), Celtic (30.9%, a difference of 0.040%), Vietnamese (30.9%, a difference of 0.12%), Senegalese (31.0%, a difference of 0.18%), and Cape Verdean (30.8%, a difference of 0.27%). Similarly, the demographic groups most similar to Immigrants from Ecuador are Bahamian (31.3%, a difference of 0.020%), German Russian (31.3%, a difference of 0.030%), Subsaharan African (31.4%, a difference of 0.090%), Immigrants from Belize (31.4%, a difference of 0.25%), and Hmong (31.2%, a difference of 0.28%).
| Demographics | Rating | Rank | Single Mother Poverty |
| West Indians | 0.9 /100 | #247 | Tragic 30.8% |
| French Canadians | 0.9 /100 | #248 | Tragic 30.8% |
| Cape Verdeans | 0.8 /100 | #249 | Tragic 30.8% |
| Vietnamese | 0.7 /100 | #250 | Tragic 30.9% |
| Tlingit-Haida | 0.6 /100 | #251 | Tragic 30.9% |
| Alaska Natives | 0.6 /100 | #252 | Tragic 30.9% |
| Celtics | 0.6 /100 | #253 | Tragic 30.9% |
| Senegalese | 0.5 /100 | #254 | Tragic 31.0% |
| Belizeans | 0.5 /100 | #255 | Tragic 31.0% |
| Immigrants | West Indies | 0.4 /100 | #256 | Tragic 31.1% |
| Immigrants | Bahamas | 0.4 /100 | #257 | Tragic 31.1% |
| Immigrants | Caribbean | 0.4 /100 | #258 | Tragic 31.1% |
| Immigrants | Bangladesh | 0.4 /100 | #259 | Tragic 31.1% |
| Whites/Caucasians | 0.3 /100 | #260 | Tragic 31.2% |
| Immigrants | El Salvador | 0.3 /100 | #261 | Tragic 31.2% |
| Hmong | 0.3 /100 | #262 | Tragic 31.2% |
| Bahamians | 0.2 /100 | #263 | Tragic 31.3% |
| Immigrants | Ecuador | 0.2 /100 | #264 | Tragic 31.3% |
| German Russians | 0.2 /100 | #265 | Tragic 31.3% |
| Sub-Saharan Africans | 0.2 /100 | #266 | Tragic 31.4% |
| Immigrants | Belize | 0.2 /100 | #267 | Tragic 31.4% |