Tlingit-Haida vs Immigrants from Germany Single Mother Poverty
COMPARE
Tlingit-Haida
Immigrants from Germany
Single Mother Poverty
Single Mother Poverty Comparison
Tlingit-Haida
Immigrants from Germany
30.9%
SINGLE MOTHER POVERTY
0.6/ 100
METRIC RATING
251st/ 347
METRIC RANK
29.5%
SINGLE MOTHER POVERTY
30.4/ 100
METRIC RATING
190th/ 347
METRIC RANK
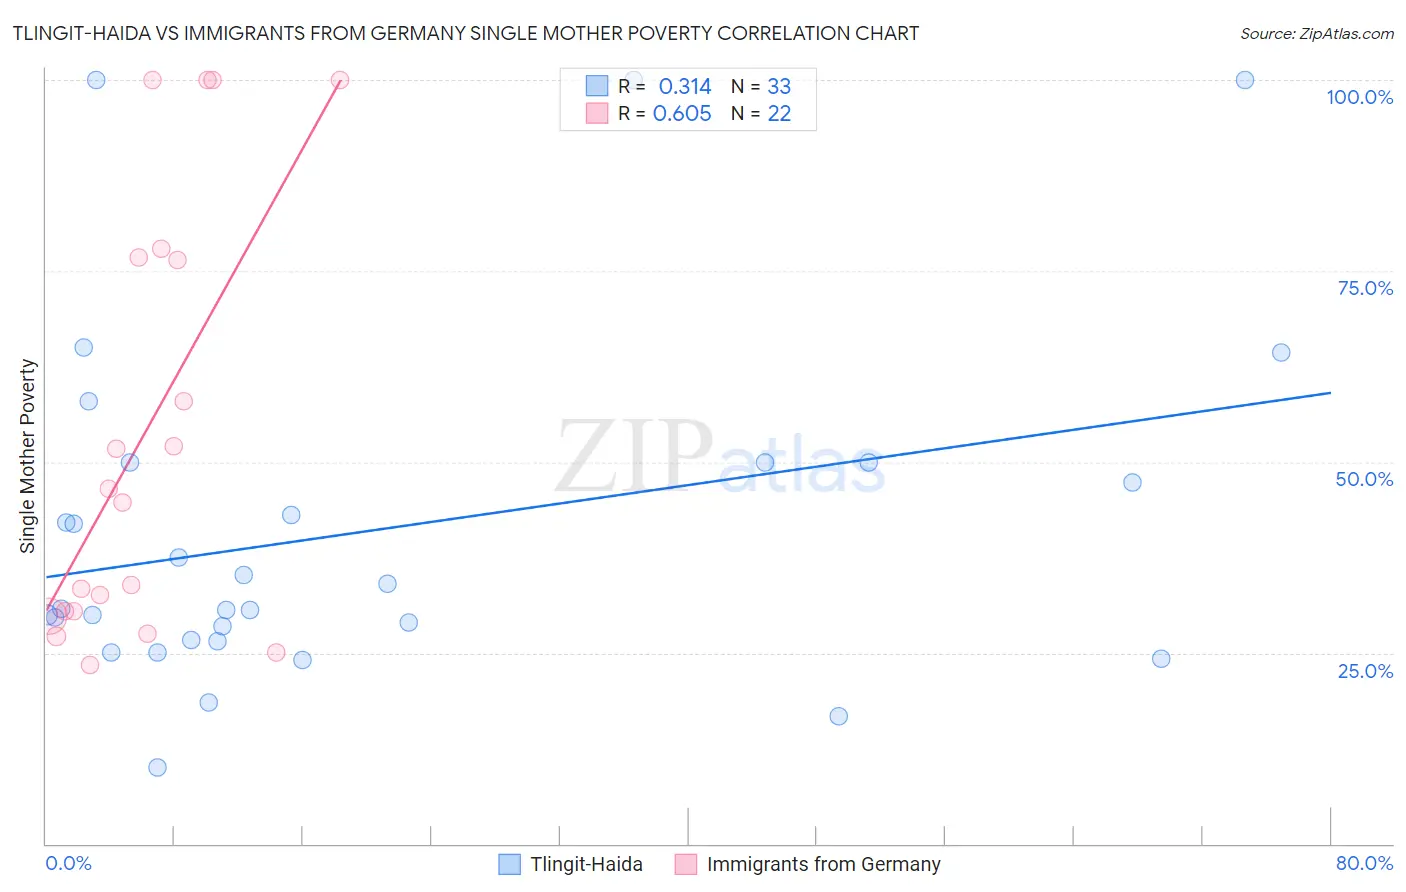
Tlingit-Haida vs Immigrants from Germany Single Mother Poverty Correlation Chart
The statistical analysis conducted on geographies consisting of 60,327,973 people shows a mild positive correlation between the proportion of Tlingit-Haida and poverty level among single mothers in the United States with a correlation coefficient (R) of 0.314 and weighted average of 30.9%. Similarly, the statistical analysis conducted on geographies consisting of 449,496,540 people shows a significant positive correlation between the proportion of Immigrants from Germany and poverty level among single mothers in the United States with a correlation coefficient (R) of 0.605 and weighted average of 29.5%, a difference of 5.0%.
Single Mother Poverty Correlation Summary
| Measurement | Tlingit-Haida | Immigrants from Germany |
| Minimum | 10.0% | 23.4% |
| Maximum | 100.0% | 100.0% |
| Range | 90.0% | 76.6% |
| Mean | 41.0% | 53.5% |
| Median | 30.7% | 45.6% |
| Interquartile 25% (IQ1) | 26.6% | 30.4% |
| Interquartile 75% (IQ3) | 50.0% | 76.8% |
| Interquartile Range (IQR) | 23.4% | 46.4% |
| Standard Deviation (Sample) | 22.9% | 28.0% |
| Standard Deviation (Population) | 22.6% | 27.3% |
Similar Demographics by Single Mother Poverty
Demographics Similar to Tlingit-Haida by Single Mother Poverty
In terms of single mother poverty, the demographic groups most similar to Tlingit-Haida are Alaska Native (30.9%, a difference of 0.010%), Celtic (30.9%, a difference of 0.040%), Vietnamese (30.9%, a difference of 0.12%), Senegalese (31.0%, a difference of 0.18%), and Cape Verdean (30.8%, a difference of 0.27%).
| Demographics | Rating | Rank | Single Mother Poverty |
| French | 1.3 /100 | #244 | Tragic 30.7% |
| Barbadians | 1.3 /100 | #245 | Tragic 30.7% |
| Ecuadorians | 0.9 /100 | #246 | Tragic 30.8% |
| West Indians | 0.9 /100 | #247 | Tragic 30.8% |
| French Canadians | 0.9 /100 | #248 | Tragic 30.8% |
| Cape Verdeans | 0.8 /100 | #249 | Tragic 30.8% |
| Vietnamese | 0.7 /100 | #250 | Tragic 30.9% |
| Tlingit-Haida | 0.6 /100 | #251 | Tragic 30.9% |
| Alaska Natives | 0.6 /100 | #252 | Tragic 30.9% |
| Celtics | 0.6 /100 | #253 | Tragic 30.9% |
| Senegalese | 0.5 /100 | #254 | Tragic 31.0% |
| Belizeans | 0.5 /100 | #255 | Tragic 31.0% |
| Immigrants | West Indies | 0.4 /100 | #256 | Tragic 31.1% |
| Immigrants | Bahamas | 0.4 /100 | #257 | Tragic 31.1% |
| Immigrants | Caribbean | 0.4 /100 | #258 | Tragic 31.1% |
Demographics Similar to Immigrants from Germany by Single Mother Poverty
In terms of single mother poverty, the demographic groups most similar to Immigrants from Germany are Guamanian/Chamorro (29.4%, a difference of 0.070%), Immigrants from Africa (29.4%, a difference of 0.070%), Immigrants from Trinidad and Tobago (29.5%, a difference of 0.070%), Moroccan (29.5%, a difference of 0.10%), and Lebanese (29.4%, a difference of 0.11%).
| Demographics | Rating | Rank | Single Mother Poverty |
| Nepalese | 38.3 /100 | #183 | Fair 29.3% |
| Nigerians | 38.0 /100 | #184 | Fair 29.3% |
| Ghanaians | 36.8 /100 | #185 | Fair 29.4% |
| Yugoslavians | 36.0 /100 | #186 | Fair 29.4% |
| Lebanese | 32.5 /100 | #187 | Fair 29.4% |
| Guamanians/Chamorros | 31.8 /100 | #188 | Fair 29.4% |
| Immigrants | Africa | 31.6 /100 | #189 | Fair 29.4% |
| Immigrants | Germany | 30.4 /100 | #190 | Fair 29.5% |
| Immigrants | Trinidad and Tobago | 29.2 /100 | #191 | Fair 29.5% |
| Moroccans | 28.6 /100 | #192 | Fair 29.5% |
| Basques | 28.3 /100 | #193 | Fair 29.5% |
| Icelanders | 26.1 /100 | #194 | Fair 29.5% |
| Slavs | 24.5 /100 | #195 | Fair 29.6% |
| Spanish American Indians | 23.4 /100 | #196 | Fair 29.6% |
| Immigrants | Jamaica | 22.0 /100 | #197 | Fair 29.6% |