Guamanian/Chamorro vs Immigrants from Spain Receiving Food Stamps
COMPARE
Guamanian/Chamorro
Immigrants from Spain
Receiving Food Stamps
Receiving Food Stamps Comparison
Guamanians/Chamorros
Immigrants from Spain
11.7%
RECEIVING FOOD STAMPS
54.2/ 100
METRIC RATING
172nd/ 347
METRIC RANK
11.1%
RECEIVING FOOD STAMPS
81.7/ 100
METRIC RATING
151st/ 347
METRIC RANK
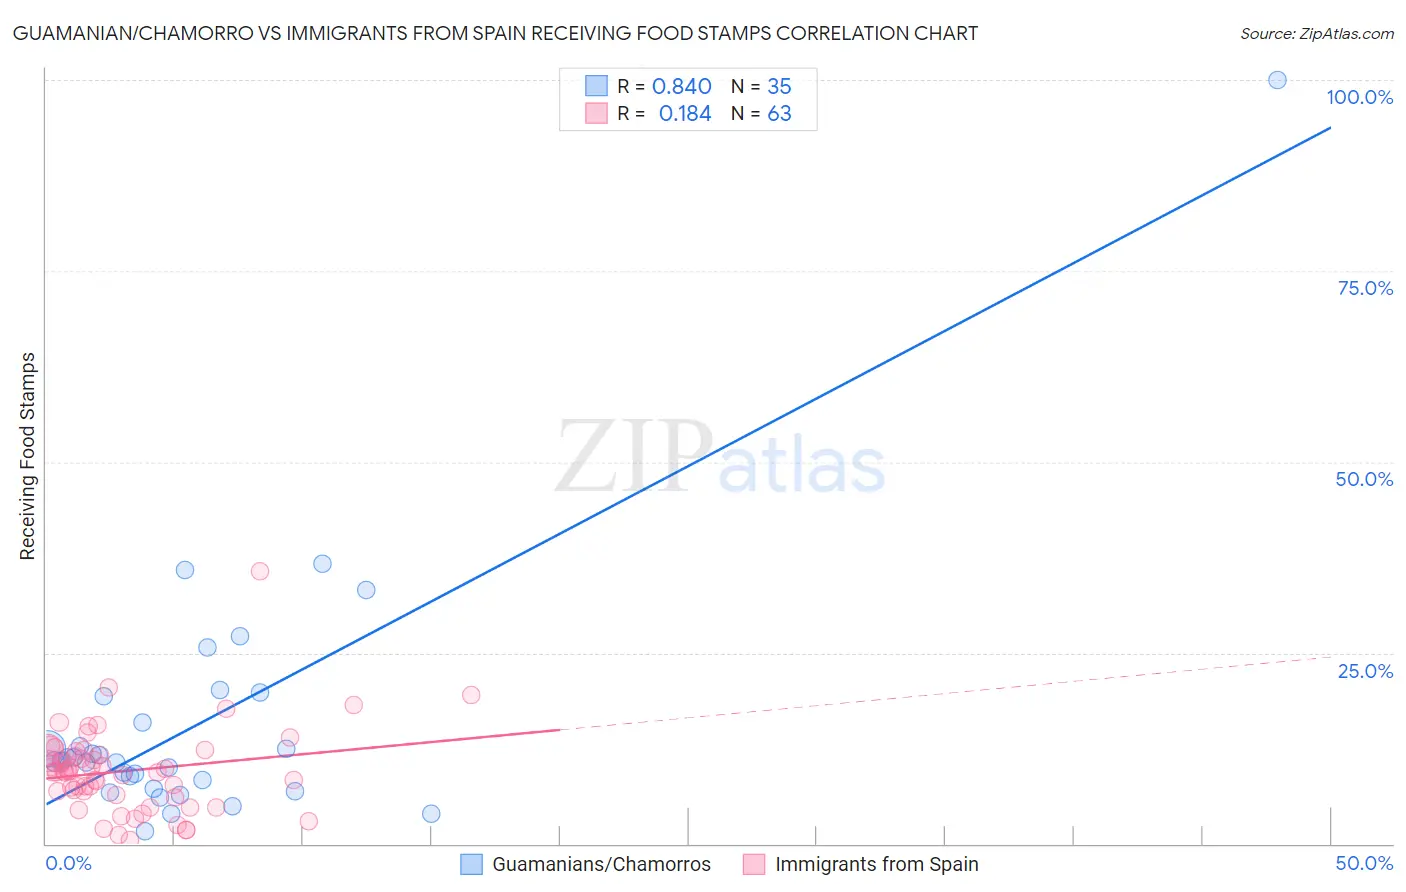
Guamanian/Chamorro vs Immigrants from Spain Receiving Food Stamps Correlation Chart
The statistical analysis conducted on geographies consisting of 221,700,710 people shows a very strong positive correlation between the proportion of Guamanians/Chamorros and percentage of population receiving government assistance and/or food stamps in the United States with a correlation coefficient (R) of 0.840 and weighted average of 11.7%. Similarly, the statistical analysis conducted on geographies consisting of 239,167,111 people shows a poor positive correlation between the proportion of Immigrants from Spain and percentage of population receiving government assistance and/or food stamps in the United States with a correlation coefficient (R) of 0.184 and weighted average of 11.1%, a difference of 4.9%.
Receiving Food Stamps Correlation Summary
| Measurement | Guamanian/Chamorro | Immigrants from Spain |
| Minimum | 1.7% | 0.50% |
| Maximum | 100.0% | 35.7% |
| Range | 98.3% | 35.2% |
| Mean | 15.8% | 9.5% |
| Median | 10.8% | 9.4% |
| Interquartile 25% (IQ1) | 7.3% | 6.3% |
| Interquartile 75% (IQ3) | 19.4% | 12.0% |
| Interquartile Range (IQR) | 12.1% | 5.7% |
| Standard Deviation (Sample) | 17.1% | 5.6% |
| Standard Deviation (Population) | 16.9% | 5.6% |
Similar Demographics by Receiving Food Stamps
Demographics Similar to Guamanians/Chamorros by Receiving Food Stamps
In terms of receiving food stamps, the demographic groups most similar to Guamanians/Chamorros are Immigrants from Syria (11.7%, a difference of 0.11%), Immigrants from Western Asia (11.6%, a difference of 0.32%), Costa Rican (11.6%, a difference of 0.53%), Immigrants from Eritrea (11.7%, a difference of 0.59%), and Immigrants from Eastern Africa (11.6%, a difference of 0.60%).
| Demographics | Rating | Rank | Receiving Food Stamps |
| Arabs | 64.7 /100 | #165 | Good 11.5% |
| Immigrants | Belarus | 62.8 /100 | #166 | Good 11.5% |
| Kenyans | 60.2 /100 | #167 | Good 11.6% |
| Tlingit-Haida | 59.1 /100 | #168 | Average 11.6% |
| Immigrants | Eastern Africa | 58.3 /100 | #169 | Average 11.6% |
| Costa Ricans | 57.9 /100 | #170 | Average 11.6% |
| Immigrants | Western Asia | 56.4 /100 | #171 | Average 11.6% |
| Guamanians/Chamorros | 54.2 /100 | #172 | Average 11.7% |
| Immigrants | Syria | 53.4 /100 | #173 | Average 11.7% |
| Immigrants | Eritrea | 50.0 /100 | #174 | Average 11.7% |
| Osage | 49.8 /100 | #175 | Average 11.7% |
| Peruvians | 49.3 /100 | #176 | Average 11.7% |
| Immigrants | Ukraine | 48.4 /100 | #177 | Average 11.8% |
| German Russians | 48.1 /100 | #178 | Average 11.8% |
| Immigrants | Kenya | 46.4 /100 | #179 | Average 11.8% |
Demographics Similar to Immigrants from Spain by Receiving Food Stamps
In terms of receiving food stamps, the demographic groups most similar to Immigrants from Spain are Immigrants from Kazakhstan (11.1%, a difference of 0.0%), Lebanese (11.1%, a difference of 0.020%), Armenian (11.1%, a difference of 0.090%), Immigrants from Argentina (11.2%, a difference of 0.33%), and Soviet Union (11.1%, a difference of 0.36%).
| Demographics | Rating | Rank | Receiving Food Stamps |
| Syrians | 85.5 /100 | #144 | Excellent 11.0% |
| Hungarians | 85.1 /100 | #145 | Excellent 11.0% |
| Taiwanese | 84.2 /100 | #146 | Excellent 11.0% |
| Whites/Caucasians | 83.9 /100 | #147 | Excellent 11.1% |
| Immigrants | South Eastern Asia | 83.3 /100 | #148 | Excellent 11.1% |
| Brazilians | 83.2 /100 | #149 | Excellent 11.1% |
| Soviet Union | 83.1 /100 | #150 | Excellent 11.1% |
| Immigrants | Spain | 81.7 /100 | #151 | Excellent 11.1% |
| Immigrants | Kazakhstan | 81.7 /100 | #152 | Excellent 11.1% |
| Lebanese | 81.6 /100 | #153 | Excellent 11.1% |
| Armenians | 81.4 /100 | #154 | Excellent 11.1% |
| Immigrants | Argentina | 80.4 /100 | #155 | Excellent 11.2% |
| Immigrants | Afghanistan | 75.6 /100 | #156 | Good 11.3% |
| Immigrants | Lebanon | 75.2 /100 | #157 | Good 11.3% |
| Immigrants | Bosnia and Herzegovina | 72.6 /100 | #158 | Good 11.3% |