Guamanian/Chamorro vs Haitian Receiving Food Stamps
COMPARE
Guamanian/Chamorro
Haitian
Receiving Food Stamps
Receiving Food Stamps Comparison
Guamanians/Chamorros
Haitians
11.7%
RECEIVING FOOD STAMPS
54.2/ 100
METRIC RATING
172nd/ 347
METRIC RANK
17.8%
RECEIVING FOOD STAMPS
0.0/ 100
METRIC RATING
323rd/ 347
METRIC RANK
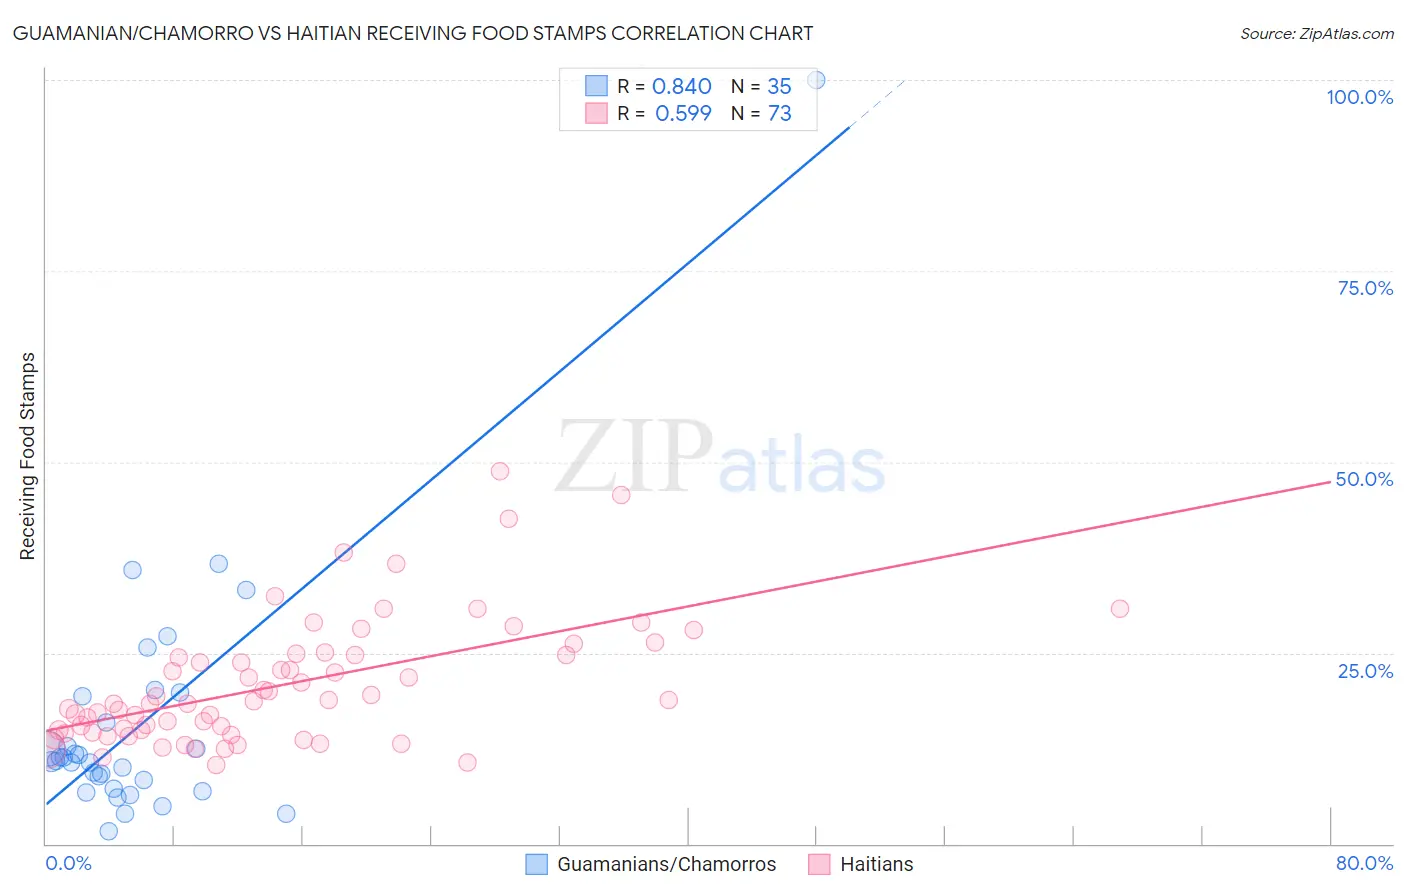
Guamanian/Chamorro vs Haitian Receiving Food Stamps Correlation Chart
The statistical analysis conducted on geographies consisting of 221,700,710 people shows a very strong positive correlation between the proportion of Guamanians/Chamorros and percentage of population receiving government assistance and/or food stamps in the United States with a correlation coefficient (R) of 0.840 and weighted average of 11.7%. Similarly, the statistical analysis conducted on geographies consisting of 287,415,058 people shows a substantial positive correlation between the proportion of Haitians and percentage of population receiving government assistance and/or food stamps in the United States with a correlation coefficient (R) of 0.599 and weighted average of 17.8%, a difference of 52.4%.
Receiving Food Stamps Correlation Summary
| Measurement | Guamanian/Chamorro | Haitian |
| Minimum | 1.7% | 10.3% |
| Maximum | 100.0% | 48.7% |
| Range | 98.3% | 38.4% |
| Mean | 15.8% | 20.9% |
| Median | 10.8% | 18.7% |
| Interquartile 25% (IQ1) | 7.3% | 14.7% |
| Interquartile 75% (IQ3) | 19.4% | 24.8% |
| Interquartile Range (IQR) | 12.1% | 10.1% |
| Standard Deviation (Sample) | 17.1% | 8.2% |
| Standard Deviation (Population) | 16.9% | 8.1% |
Similar Demographics by Receiving Food Stamps
Demographics Similar to Guamanians/Chamorros by Receiving Food Stamps
In terms of receiving food stamps, the demographic groups most similar to Guamanians/Chamorros are Immigrants from Syria (11.7%, a difference of 0.11%), Immigrants from Western Asia (11.6%, a difference of 0.32%), Costa Rican (11.6%, a difference of 0.53%), Immigrants from Eritrea (11.7%, a difference of 0.59%), and Immigrants from Eastern Africa (11.6%, a difference of 0.60%).
| Demographics | Rating | Rank | Receiving Food Stamps |
| Arabs | 64.7 /100 | #165 | Good 11.5% |
| Immigrants | Belarus | 62.8 /100 | #166 | Good 11.5% |
| Kenyans | 60.2 /100 | #167 | Good 11.6% |
| Tlingit-Haida | 59.1 /100 | #168 | Average 11.6% |
| Immigrants | Eastern Africa | 58.3 /100 | #169 | Average 11.6% |
| Costa Ricans | 57.9 /100 | #170 | Average 11.6% |
| Immigrants | Western Asia | 56.4 /100 | #171 | Average 11.6% |
| Guamanians/Chamorros | 54.2 /100 | #172 | Average 11.7% |
| Immigrants | Syria | 53.4 /100 | #173 | Average 11.7% |
| Immigrants | Eritrea | 50.0 /100 | #174 | Average 11.7% |
| Osage | 49.8 /100 | #175 | Average 11.7% |
| Peruvians | 49.3 /100 | #176 | Average 11.7% |
| Immigrants | Ukraine | 48.4 /100 | #177 | Average 11.8% |
| German Russians | 48.1 /100 | #178 | Average 11.8% |
| Immigrants | Kenya | 46.4 /100 | #179 | Average 11.8% |
Demographics Similar to Haitians by Receiving Food Stamps
In terms of receiving food stamps, the demographic groups most similar to Haitians are Immigrants from Grenada (17.8%, a difference of 0.010%), British West Indian (17.9%, a difference of 0.59%), Immigrants from Haiti (18.2%, a difference of 2.4%), Cuban (18.2%, a difference of 2.5%), and Apache (18.3%, a difference of 2.8%).
| Demographics | Rating | Rank | Receiving Food Stamps |
| Central American Indians | 0.0 /100 | #316 | Tragic 17.1% |
| Blacks/African Americans | 0.0 /100 | #317 | Tragic 17.2% |
| Menominee | 0.0 /100 | #318 | Tragic 17.2% |
| Immigrants | St. Vincent and the Grenadines | 0.0 /100 | #319 | Tragic 17.2% |
| Immigrants | Nicaragua | 0.0 /100 | #320 | Tragic 17.2% |
| Natives/Alaskans | 0.0 /100 | #321 | Tragic 17.3% |
| Immigrants | Grenada | 0.0 /100 | #322 | Tragic 17.8% |
| Haitians | 0.0 /100 | #323 | Tragic 17.8% |
| British West Indians | 0.0 /100 | #324 | Tragic 17.9% |
| Immigrants | Haiti | 0.0 /100 | #325 | Tragic 18.2% |
| Cubans | 0.0 /100 | #326 | Tragic 18.2% |
| Apache | 0.0 /100 | #327 | Tragic 18.3% |
| Colville | 0.0 /100 | #328 | Tragic 18.3% |
| Immigrants | Dominica | 0.0 /100 | #329 | Tragic 18.4% |
| Pima | 0.0 /100 | #330 | Tragic 19.0% |