Guamanian/Chamorro vs Arab Family Poverty
COMPARE
Guamanian/Chamorro
Arab
Family Poverty
Family Poverty Comparison
Guamanians/Chamorros
Arabs
8.8%
FAMILY POVERTY
64.7/ 100
METRIC RATING
165th/ 347
METRIC RANK
9.2%
FAMILY POVERTY
31.5/ 100
METRIC RATING
190th/ 347
METRIC RANK
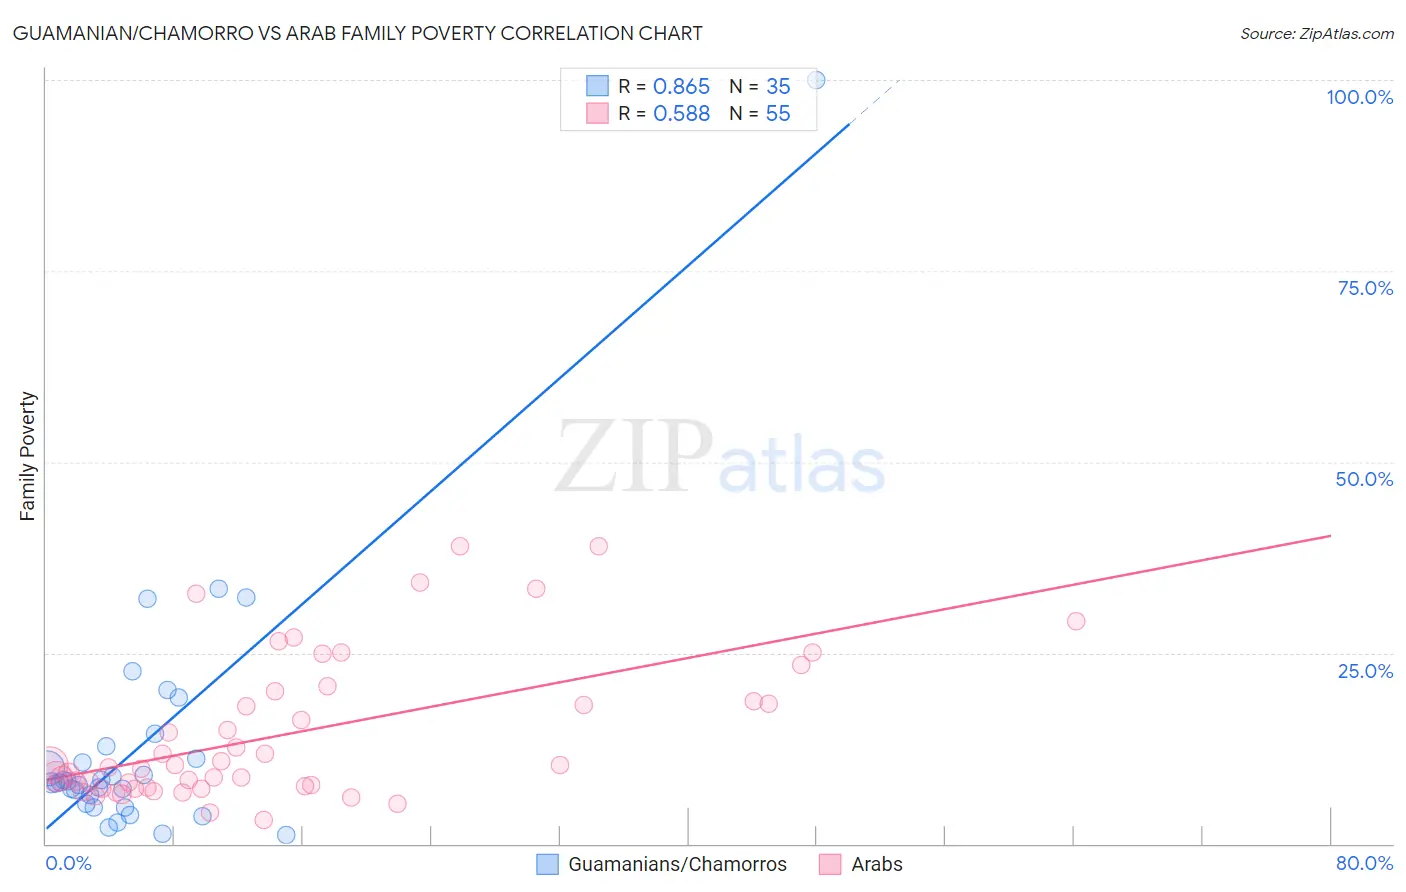
Guamanian/Chamorro vs Arab Family Poverty Correlation Chart
The statistical analysis conducted on geographies consisting of 221,737,995 people shows a very strong positive correlation between the proportion of Guamanians/Chamorros and poverty level among families in the United States with a correlation coefficient (R) of 0.865 and weighted average of 8.8%. Similarly, the statistical analysis conducted on geographies consisting of 484,664,597 people shows a substantial positive correlation between the proportion of Arabs and poverty level among families in the United States with a correlation coefficient (R) of 0.588 and weighted average of 9.2%, a difference of 4.6%.
Family Poverty Correlation Summary
| Measurement | Guamanian/Chamorro | Arab |
| Minimum | 1.2% | 3.1% |
| Maximum | 100.0% | 39.0% |
| Range | 98.8% | 35.9% |
| Mean | 13.1% | 14.5% |
| Median | 8.0% | 10.2% |
| Interquartile 25% (IQ1) | 5.2% | 7.3% |
| Interquartile 75% (IQ3) | 12.7% | 19.9% |
| Interquartile Range (IQR) | 7.5% | 12.6% |
| Standard Deviation (Sample) | 17.3% | 9.5% |
| Standard Deviation (Population) | 17.1% | 9.4% |
Similar Demographics by Family Poverty
Demographics Similar to Guamanians/Chamorros by Family Poverty
In terms of family poverty, the demographic groups most similar to Guamanians/Chamorros are Celtic (8.8%, a difference of 0.030%), Afghan (8.8%, a difference of 0.18%), Pennsylvania German (8.8%, a difference of 0.19%), Ethiopian (8.8%, a difference of 0.24%), and Immigrants from Ethiopia (8.9%, a difference of 0.32%).
| Demographics | Rating | Rank | Family Poverty |
| Whites/Caucasians | 69.1 /100 | #158 | Good 8.8% |
| Peruvians | 68.0 /100 | #159 | Good 8.8% |
| Hungarians | 67.2 /100 | #160 | Good 8.8% |
| Immigrants | Northern Africa | 66.9 /100 | #161 | Good 8.8% |
| Ethiopians | 66.3 /100 | #162 | Good 8.8% |
| Pennsylvania Germans | 66.0 /100 | #163 | Good 8.8% |
| Celtics | 64.9 /100 | #164 | Good 8.8% |
| Guamanians/Chamorros | 64.7 /100 | #165 | Good 8.8% |
| Afghans | 63.5 /100 | #166 | Good 8.8% |
| Immigrants | Ethiopia | 62.5 /100 | #167 | Good 8.9% |
| Israelis | 62.1 /100 | #168 | Good 8.9% |
| Immigrants | Chile | 59.6 /100 | #169 | Average 8.9% |
| Kenyans | 58.2 /100 | #170 | Average 8.9% |
| Lebanese | 57.6 /100 | #171 | Average 8.9% |
| Immigrants | Peru | 57.5 /100 | #172 | Average 8.9% |
Demographics Similar to Arabs by Family Poverty
In terms of family poverty, the demographic groups most similar to Arabs are Immigrants from Afghanistan (9.2%, a difference of 0.090%), Immigrants from Kenya (9.2%, a difference of 0.37%), Ugandan (9.3%, a difference of 0.41%), Spanish (9.3%, a difference of 0.42%), and Immigrants from Western Asia (9.3%, a difference of 0.50%).
| Demographics | Rating | Rank | Family Poverty |
| Uruguayans | 39.2 /100 | #183 | Fair 9.1% |
| South American Indians | 38.7 /100 | #184 | Fair 9.1% |
| Immigrants | Saudi Arabia | 38.6 /100 | #185 | Fair 9.1% |
| Colombians | 36.1 /100 | #186 | Fair 9.2% |
| Delaware | 35.4 /100 | #187 | Fair 9.2% |
| Immigrants | Kenya | 34.0 /100 | #188 | Fair 9.2% |
| Immigrants | Afghanistan | 32.1 /100 | #189 | Fair 9.2% |
| Arabs | 31.5 /100 | #190 | Fair 9.2% |
| Ugandans | 28.7 /100 | #191 | Fair 9.3% |
| Spanish | 28.7 /100 | #192 | Fair 9.3% |
| Immigrants | Western Asia | 28.2 /100 | #193 | Fair 9.3% |
| South Americans | 28.1 /100 | #194 | Fair 9.3% |
| Venezuelans | 27.4 /100 | #195 | Fair 9.3% |
| Immigrants | Venezuela | 26.1 /100 | #196 | Fair 9.3% |
| Immigrants | Colombia | 24.4 /100 | #197 | Fair 9.3% |