White/Caucasian Family Poverty
COMPARE
White/Caucasian
Select to Compare
Family Poverty
White/Caucasian Family Poverty
8.8%
POVERTY | FAMILIES
69.1/ 100
METRIC RATING
158th/ 347
METRIC RANK
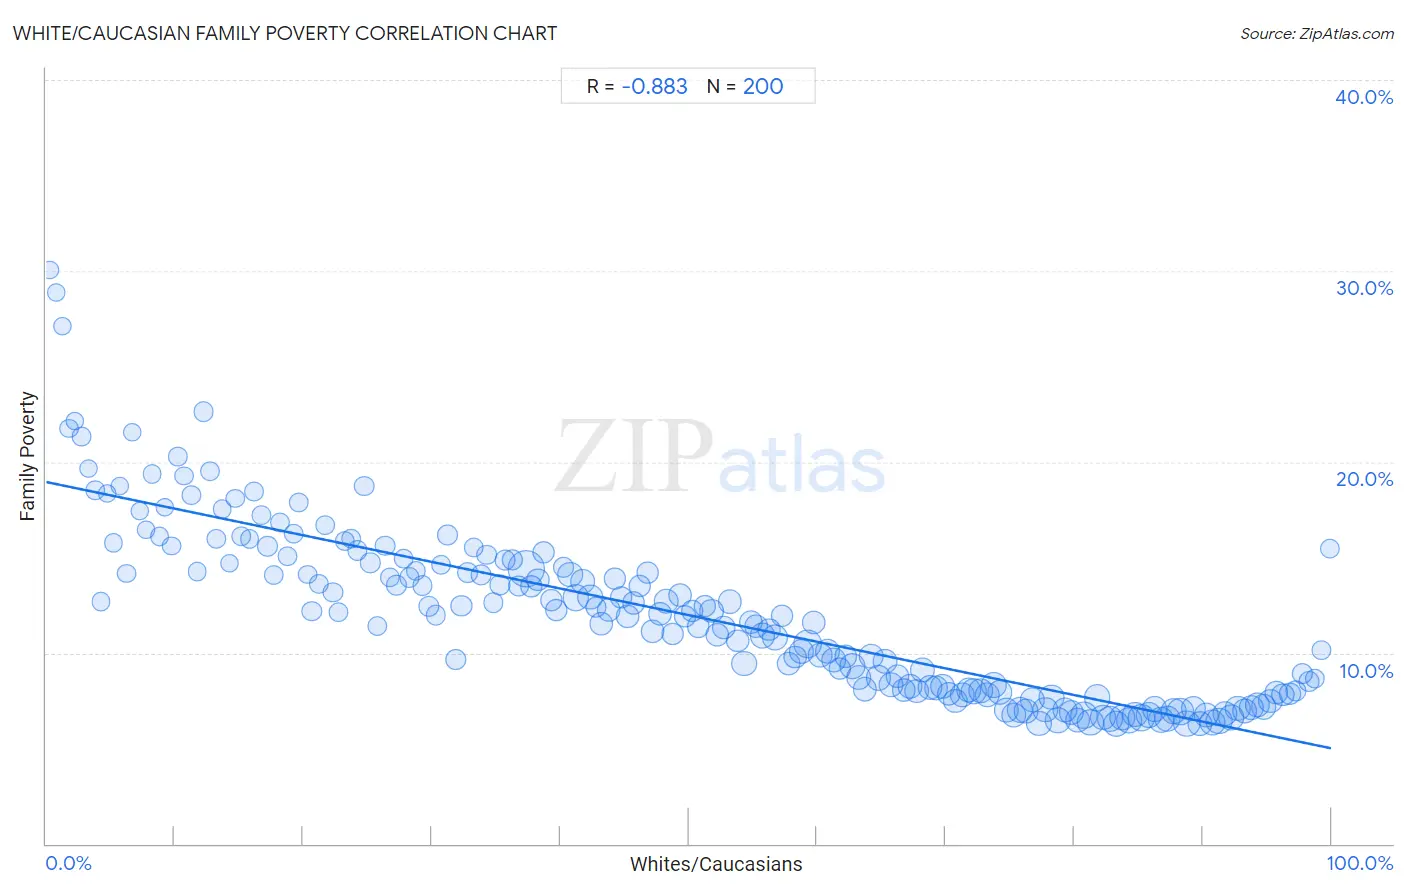
White/Caucasian Family Poverty Correlation Chart
The statistical analysis conducted on geographies consisting of 578,762,373 people shows a very strong negative correlation between the proportion of Whites/Caucasians and poverty level among families in the United States with a correlation coefficient (R) of -0.883 and weighted average of 8.8%. On average, for every 1% (one percent) increase in Whites/Caucasians within a typical geography, there is a decrease of 0.14% in poverty level among families.
It is essential to understand that the correlation between the percentage of Whites/Caucasians and poverty level among families does not imply a direct cause-and-effect relationship. It remains uncertain whether the presence of Whites/Caucasians influences an upward or downward trend in the level of poverty level among families within an area, or if Whites/Caucasians simply ended up residing in those areas with higher or lower levels of poverty level among families due to other factors.
Demographics Similar to Whites/Caucasians by Family Poverty
In terms of family poverty, the demographic groups most similar to Whites/Caucasians are Tsimshian (8.8%, a difference of 0.040%), Peruvian (8.8%, a difference of 0.16%), Hungarian (8.8%, a difference of 0.30%), Immigrants from Northern Africa (8.8%, a difference of 0.33%), and Immigrants from Oceania (8.7%, a difference of 0.34%).
| Demographics | Rating | Rank | Family Poverty |
| Brazilians | 80.1 /100 | #151 | Excellent 8.6% |
| Samoans | 79.8 /100 | #152 | Good 8.6% |
| Immigrants from Spain | 79.1 /100 | #153 | Good 8.6% |
| Immigrants from Vietnam | 75.4 /100 | #154 | Good 8.7% |
| Immigrants from Kuwait | 73.6 /100 | #155 | Good 8.7% |
| Immigrants from Oceania | 71.2 /100 | #156 | Good 8.7% |
| Tsimshian | 69.3 /100 | #157 | Good 8.8% |
| Whites/Caucasians | 69.1 /100 | #158 | Good 8.8% |
| Peruvians | 68.0 /100 | #159 | Good 8.8% |
| Hungarians | 67.2 /100 | #160 | Good 8.8% |
| Immigrants from Northern Africa | 66.9 /100 | #161 | Good 8.8% |
| Ethiopians | 66.3 /100 | #162 | Good 8.8% |
| Pennsylvania Germans | 66.0 /100 | #163 | Good 8.8% |
| Celtics | 64.9 /100 | #164 | Good 8.8% |
| Guamanians/Chamorros | 64.7 /100 | #165 | Good 8.8% |
White/Caucasian Family Poverty Correlation Summary
| Measurement | White/Caucasian Data | Family Poverty Data |
| Minimum | 0.32% | 6.3% |
| Maximum | 99.9% | 30.1% |
| Range | 99.6% | 23.8% |
| Mean | 50.0% | 12.0% |
| Median | 50.0% | 11.9% |
| Interquartile 25% (IQ1) | 25.0% | 7.9% |
| Interquartile 75% (IQ3) | 75.0% | 14.7% |
| Interquartile Range (IQR) | 50.0% | 6.7% |
| Standard Deviation (Sample) | 28.9% | 4.6% |
| Standard Deviation (Population) | 28.9% | 4.6% |
Correlation Details
| White/Caucasian Percentile | Sample Size | Family Poverty |
[ 0.0% - 0.5% ] 0.32% | 62,421 | 30.1% |
[ 0.5% - 1.0% ] 0.79% | 73,342 | 28.8% |
[ 1.0% - 1.5% ] 1.26% | 178,395 | 27.1% |
[ 1.5% - 2.0% ] 1.77% | 472,094 | 21.8% |
[ 2.0% - 2.5% ] 2.21% | 314,944 | 22.1% |
[ 2.5% - 3.0% ] 2.76% | 534,023 | 21.3% |
[ 3.0% - 3.5% ] 3.26% | 352,657 | 19.6% |
[ 3.5% - 4.0% ] 3.79% | 517,953 | 18.5% |
[ 4.0% - 4.5% ] 4.25% | 459,958 | 12.7% |
[ 4.5% - 5.0% ] 4.75% | 433,010 | 18.3% |
[ 5.0% - 5.5% ] 5.23% | 436,221 | 15.8% |
[ 5.5% - 6.0% ] 5.75% | 363,477 | 18.7% |
[ 6.0% - 6.5% ] 6.27% | 447,837 | 14.2% |
[ 6.5% - 7.0% ] 6.68% | 428,830 | 21.5% |
[ 7.0% - 7.5% ] 7.30% | 355,262 | 17.4% |
[ 7.5% - 8.0% ] 7.78% | 342,135 | 16.4% |
[ 8.0% - 8.5% ] 8.24% | 574,274 | 19.4% |
[ 8.5% - 9.0% ] 8.81% | 668,669 | 16.1% |
[ 9.0% - 9.5% ] 9.25% | 386,064 | 17.6% |
[ 9.5% - 10.0% ] 9.74% | 489,661 | 15.6% |
[ 10.0% - 10.5% ] 10.22% | 433,565 | 20.3% |
[ 10.5% - 11.0% ] 10.73% | 510,906 | 19.3% |
[ 11.0% - 11.5% ] 11.28% | 718,074 | 18.3% |
[ 11.5% - 12.0% ] 11.75% | 474,899 | 14.2% |
[ 12.0% - 12.5% ] 12.21% | 1,177,460 | 22.6% |
[ 12.5% - 13.0% ] 12.75% | 894,969 | 19.5% |
[ 13.0% - 13.5% ] 13.27% | 801,130 | 15.9% |
[ 13.5% - 14.0% ] 13.70% | 437,657 | 17.5% |
[ 14.0% - 14.5% ] 14.27% | 709,339 | 14.7% |
[ 14.5% - 15.0% ] 14.71% | 512,174 | 18.1% |
[ 15.0% - 15.5% ] 15.17% | 878,180 | 16.1% |
[ 15.5% - 16.0% ] 15.81% | 705,600 | 16.0% |
[ 16.0% - 16.5% ] 16.15% | 545,249 | 18.4% |
[ 16.5% - 17.0% ] 16.76% | 689,619 | 17.2% |
[ 17.0% - 17.5% ] 17.25% | 1,693,579 | 15.6% |
[ 17.5% - 18.0% ] 17.71% | 875,000 | 14.1% |
[ 18.0% - 18.5% ] 18.21% | 919,759 | 16.8% |
[ 18.5% - 19.0% ] 18.75% | 953,782 | 15.1% |
[ 19.0% - 19.5% ] 19.26% | 1,001,528 | 16.3% |
[ 19.5% - 20.0% ] 19.69% | 916,945 | 17.9% |
[ 20.0% - 20.5% ] 20.31% | 759,475 | 14.1% |
[ 20.5% - 21.0% ] 20.67% | 992,848 | 12.2% |
[ 21.0% - 21.5% ] 21.23% | 741,004 | 13.6% |
[ 21.5% - 22.0% ] 21.70% | 688,991 | 16.7% |
[ 22.0% - 22.5% ] 22.31% | 1,092,813 | 13.2% |
[ 22.5% - 23.0% ] 22.71% | 1,275,266 | 12.1% |
[ 23.0% - 23.5% ] 23.23% | 1,193,433 | 15.9% |
[ 23.5% - 24.0% ] 23.75% | 1,053,077 | 16.0% |
[ 24.0% - 24.5% ] 24.24% | 1,076,734 | 15.4% |
[ 24.5% - 25.0% ] 24.75% | 1,123,030 | 18.7% |
[ 25.0% - 25.5% ] 25.23% | 1,376,550 | 14.7% |
[ 25.5% - 26.0% ] 25.75% | 1,166,133 | 11.4% |
[ 26.0% - 26.5% ] 26.33% | 1,585,414 | 15.6% |
[ 26.5% - 27.0% ] 26.74% | 1,056,608 | 13.9% |
[ 27.0% - 27.5% ] 27.26% | 1,467,861 | 13.5% |
[ 27.5% - 28.0% ] 27.80% | 1,023,440 | 14.9% |
[ 28.0% - 28.5% ] 28.27% | 1,654,502 | 13.9% |
[ 28.5% - 29.0% ] 28.77% | 1,413,125 | 14.3% |
[ 29.0% - 29.5% ] 29.28% | 991,291 | 13.5% |
[ 29.5% - 30.0% ] 29.74% | 1,624,101 | 12.4% |
[ 30.0% - 30.5% ] 30.32% | 1,526,785 | 12.0% |
[ 30.5% - 31.0% ] 30.75% | 1,176,349 | 14.6% |
[ 31.0% - 31.5% ] 31.24% | 1,709,025 | 16.2% |
[ 31.5% - 32.0% ] 31.87% | 2,369,150 | 9.6% |
[ 32.0% - 32.5% ] 32.29% | 2,337,791 | 12.5% |
[ 32.5% - 33.0% ] 32.77% | 1,595,338 | 14.2% |
[ 33.0% - 33.5% ] 33.27% | 950,183 | 15.5% |
[ 33.5% - 34.0% ] 33.82% | 1,883,581 | 14.1% |
[ 34.0% - 34.5% ] 34.27% | 1,172,109 | 15.1% |
[ 34.5% - 35.0% ] 34.79% | 1,433,924 | 12.6% |
[ 35.0% - 35.5% ] 35.27% | 1,822,028 | 13.5% |
[ 35.5% - 36.0% ] 35.73% | 1,658,077 | 14.9% |
[ 36.0% - 36.5% ] 36.25% | 1,972,186 | 14.9% |
[ 36.5% - 37.0% ] 36.75% | 2,020,685 | 13.5% |
[ 37.0% - 37.5% ] 37.37% | 12,683,522 | 14.4% |
[ 37.5% - 38.0% ] 37.71% | 2,486,576 | 13.5% |
[ 38.0% - 38.5% ] 38.25% | 2,884,004 | 13.8% |
[ 38.5% - 39.0% ] 38.72% | 2,810,713 | 15.2% |
[ 39.0% - 39.5% ] 39.28% | 2,413,097 | 12.8% |
[ 39.5% - 40.0% ] 39.72% | 2,512,615 | 12.2% |
[ 40.0% - 40.5% ] 40.24% | 2,007,085 | 14.5% |
[ 40.5% - 41.0% ] 40.78% | 4,866,093 | 14.1% |
[ 41.0% - 41.5% ] 41.21% | 5,714,809 | 12.9% |
[ 41.5% - 42.0% ] 41.77% | 4,034,695 | 13.7% |
[ 42.0% - 42.5% ] 42.32% | 4,848,133 | 12.9% |
[ 42.5% - 43.0% ] 42.76% | 2,118,893 | 12.4% |
[ 43.0% - 43.5% ] 43.19% | 3,451,094 | 11.5% |
[ 43.5% - 44.0% ] 43.79% | 3,478,524 | 12.2% |
[ 44.0% - 44.5% ] 44.24% | 2,767,666 | 13.9% |
[ 44.5% - 45.0% ] 44.74% | 2,725,012 | 12.9% |
[ 45.0% - 45.5% ] 45.27% | 3,308,212 | 11.9% |
[ 45.5% - 46.0% ] 45.71% | 2,784,334 | 12.6% |
[ 46.0% - 46.5% ] 46.21% | 2,968,592 | 13.5% |
[ 46.5% - 47.0% ] 46.77% | 2,390,918 | 14.2% |
[ 47.0% - 47.5% ] 47.21% | 3,347,665 | 11.1% |
[ 47.5% - 48.0% ] 47.75% | 3,355,003 | 12.0% |
[ 48.0% - 48.5% ] 48.24% | 4,304,947 | 12.7% |
[ 48.5% - 49.0% ] 48.73% | 2,384,551 | 11.0% |
[ 49.0% - 49.5% ] 49.29% | 3,329,207 | 13.0% |
[ 49.5% - 50.0% ] 49.74% | 2,472,553 | 11.9% |
[ 50.0% - 50.5% ] 50.26% | 2,951,673 | 12.2% |
[ 50.5% - 51.0% ] 50.75% | 3,217,419 | 11.4% |
[ 51.0% - 51.5% ] 51.23% | 2,797,127 | 12.5% |
[ 51.5% - 52.0% ] 51.79% | 3,773,165 | 12.2% |
[ 52.0% - 52.5% ] 52.20% | 3,792,875 | 10.9% |
[ 52.5% - 53.0% ] 52.76% | 3,444,223 | 11.3% |
[ 53.0% - 53.5% ] 53.23% | 3,638,612 | 12.7% |
[ 53.5% - 54.0% ] 53.78% | 3,215,692 | 10.6% |
[ 54.0% - 54.5% ] 54.32% | 4,567,755 | 9.4% |
[ 54.5% - 55.0% ] 54.82% | 3,904,375 | 11.6% |
[ 55.0% - 55.5% ] 55.28% | 3,499,565 | 11.4% |
[ 55.5% - 56.0% ] 55.75% | 4,330,252 | 10.9% |
[ 56.0% - 56.5% ] 56.24% | 3,119,172 | 11.2% |
[ 56.5% - 57.0% ] 56.71% | 5,197,514 | 10.8% |
[ 57.0% - 57.5% ] 57.25% | 3,197,832 | 11.9% |
[ 57.5% - 58.0% ] 57.74% | 3,625,991 | 9.4% |
[ 58.0% - 58.5% ] 58.26% | 3,210,748 | 9.8% |
[ 58.5% - 59.0% ] 58.75% | 4,029,890 | 10.1% |
[ 59.0% - 59.5% ] 59.26% | 6,610,188 | 10.4% |
[ 59.5% - 60.0% ] 59.75% | 3,429,504 | 11.6% |
[ 60.0% - 60.5% ] 60.24% | 4,070,951 | 9.9% |
[ 60.5% - 61.0% ] 60.76% | 4,270,301 | 10.1% |
[ 61.0% - 61.5% ] 61.31% | 4,259,123 | 9.6% |
[ 61.5% - 62.0% ] 61.77% | 2,845,048 | 9.2% |
[ 62.0% - 62.5% ] 62.23% | 3,264,737 | 9.8% |
[ 62.5% - 63.0% ] 62.76% | 5,264,333 | 9.3% |
[ 63.0% - 63.5% ] 63.24% | 4,326,634 | 8.7% |
[ 63.5% - 64.0% ] 63.73% | 3,638,879 | 8.1% |
[ 64.0% - 64.5% ] 64.23% | 4,341,003 | 9.8% |
[ 64.5% - 65.0% ] 64.76% | 4,634,122 | 8.7% |
[ 65.0% - 65.5% ] 65.30% | 4,171,624 | 9.6% |
[ 65.5% - 66.0% ] 65.73% | 4,568,622 | 8.3% |
[ 66.0% - 66.5% ] 66.26% | 3,489,361 | 8.8% |
[ 66.5% - 67.0% ] 66.78% | 3,360,283 | 8.1% |
[ 67.0% - 67.5% ] 67.25% | 4,191,476 | 8.3% |
[ 67.5% - 68.0% ] 67.75% | 3,688,292 | 8.0% |
[ 68.0% - 68.5% ] 68.23% | 4,356,542 | 9.1% |
[ 68.5% - 69.0% ] 68.77% | 4,334,530 | 8.2% |
[ 69.0% - 69.5% ] 69.23% | 3,686,616 | 8.2% |
[ 69.5% - 70.0% ] 69.76% | 4,162,133 | 8.2% |
[ 70.0% - 70.5% ] 70.24% | 3,339,621 | 7.9% |
[ 70.5% - 71.0% ] 70.73% | 3,795,728 | 7.5% |
[ 71.0% - 71.5% ] 71.27% | 4,490,826 | 7.8% |
[ 71.5% - 72.0% ] 71.76% | 4,291,519 | 8.0% |
[ 72.0% - 72.5% ] 72.22% | 5,032,984 | 8.0% |
[ 72.5% - 73.0% ] 72.72% | 4,926,220 | 8.0% |
[ 73.0% - 73.5% ] 73.26% | 4,532,913 | 7.8% |
[ 73.5% - 74.0% ] 73.74% | 5,093,552 | 8.3% |
[ 74.0% - 74.5% ] 74.24% | 4,493,041 | 7.9% |
[ 74.5% - 75.0% ] 74.75% | 4,061,477 | 7.0% |
[ 75.0% - 75.5% ] 75.27% | 4,219,706 | 6.8% |
[ 75.5% - 76.0% ] 75.73% | 5,300,405 | 7.0% |
[ 76.0% - 76.5% ] 76.24% | 4,468,369 | 7.0% |
[ 76.5% - 77.0% ] 76.75% | 4,429,643 | 7.5% |
[ 77.0% - 77.5% ] 77.25% | 4,759,901 | 6.3% |
[ 77.5% - 78.0% ] 77.75% | 4,698,318 | 7.0% |
[ 78.0% - 78.5% ] 78.25% | 4,697,718 | 7.7% |
[ 78.5% - 79.0% ] 78.74% | 4,756,908 | 6.5% |
[ 79.0% - 79.5% ] 79.24% | 4,352,042 | 7.0% |
[ 79.5% - 80.0% ] 79.75% | 4,216,844 | 6.9% |
[ 80.0% - 80.5% ] 80.25% | 4,124,872 | 6.5% |
[ 80.5% - 81.0% ] 80.75% | 5,601,885 | 6.7% |
[ 81.0% - 81.5% ] 81.26% | 5,308,037 | 6.3% |
[ 81.5% - 82.0% ] 81.77% | 5,593,302 | 7.7% |
[ 82.0% - 82.5% ] 82.25% | 4,464,636 | 6.6% |
[ 82.5% - 83.0% ] 82.75% | 5,002,972 | 6.6% |
[ 83.0% - 83.5% ] 83.25% | 5,060,818 | 6.3% |
[ 83.5% - 84.0% ] 83.75% | 5,335,641 | 6.6% |
[ 84.0% - 84.5% ] 84.25% | 4,644,198 | 6.5% |
[ 84.5% - 85.0% ] 84.75% | 4,960,474 | 6.8% |
[ 85.0% - 85.5% ] 85.23% | 5,715,666 | 6.6% |
[ 85.5% - 86.0% ] 85.76% | 5,081,258 | 6.7% |
[ 86.0% - 86.5% ] 86.25% | 4,802,317 | 7.1% |
[ 86.5% - 87.0% ] 86.74% | 5,352,544 | 6.5% |
[ 87.0% - 87.5% ] 87.26% | 5,245,995 | 6.6% |
[ 87.5% - 88.0% ] 87.75% | 5,206,637 | 6.9% |
[ 88.0% - 88.5% ] 88.26% | 5,478,284 | 6.9% |
[ 88.5% - 89.0% ] 88.75% | 5,315,761 | 6.3% |
[ 89.0% - 89.5% ] 89.25% | 4,665,178 | 7.1% |
[ 89.5% - 90.0% ] 89.74% | 4,465,621 | 6.3% |
[ 90.0% - 90.5% ] 90.25% | 4,239,890 | 6.7% |
[ 90.5% - 91.0% ] 90.76% | 5,149,418 | 6.3% |
[ 91.0% - 91.5% ] 91.25% | 5,521,753 | 6.4% |
[ 91.5% - 92.0% ] 91.75% | 4,414,034 | 6.8% |
[ 92.0% - 92.5% ] 92.24% | 5,152,395 | 6.6% |
[ 92.5% - 93.0% ] 92.75% | 4,742,845 | 7.1% |
[ 93.0% - 93.5% ] 93.24% | 4,648,239 | 7.0% |
[ 93.5% - 94.0% ] 93.75% | 4,147,861 | 7.1% |
[ 94.0% - 94.5% ] 94.25% | 4,419,016 | 7.3% |
[ 94.5% - 95.0% ] 94.75% | 4,380,001 | 7.2% |
[ 95.0% - 95.5% ] 95.26% | 3,690,427 | 7.5% |
[ 95.5% - 96.0% ] 95.76% | 3,326,469 | 7.9% |
[ 96.0% - 96.5% ] 96.25% | 2,926,024 | 7.8% |
[ 96.5% - 97.0% ] 96.75% | 2,578,582 | 7.9% |
[ 97.0% - 97.5% ] 97.25% | 2,222,524 | 8.0% |
[ 97.5% - 98.0% ] 97.74% | 1,948,654 | 8.9% |
[ 98.0% - 98.5% ] 98.25% | 1,394,171 | 8.5% |
[ 98.5% - 99.0% ] 98.72% | 1,096,674 | 8.7% |
[ 99.0% - 99.5% ] 99.24% | 659,123 | 10.1% |
[ 99.5% - 100.0% ] 99.89% | 1,070,199 | 15.5% |