Zip Codes with the Highest Percentage of Population with a Degree in Visual and Performing Arts in Springfield, OH
RELATED REPORTS & OPTIONS
Visual and Performing Arts
Springfield
Compare Zip Codes
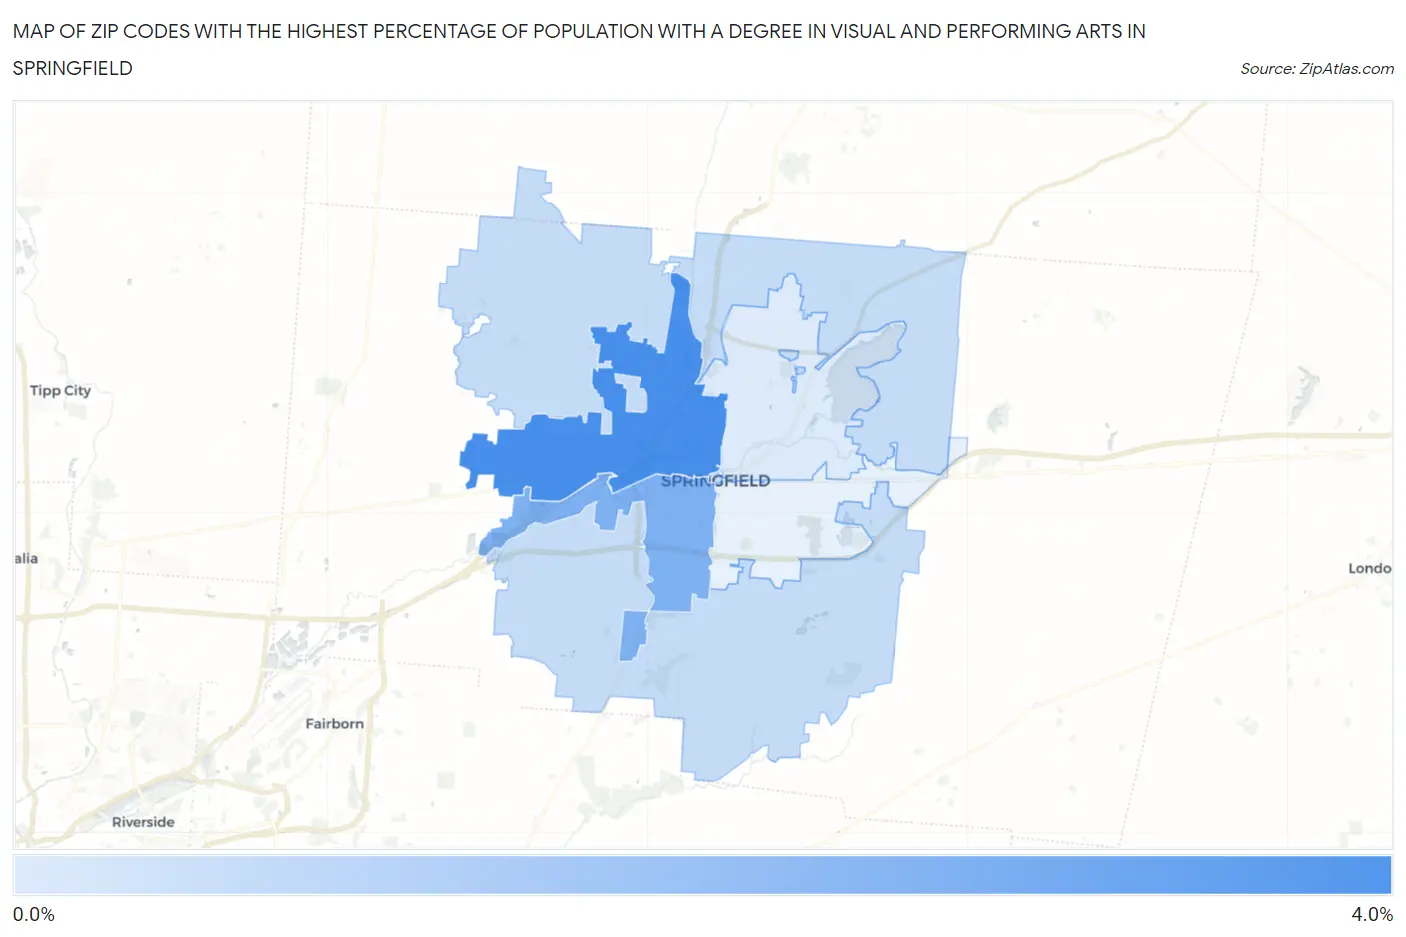
Map of Zip Codes with the Highest Percentage of Population with a Degree in Visual and Performing Arts in Springfield
0.96%
3.2%
Zip Codes with the Highest Percentage of Population with a Degree in Visual and Performing Arts in Springfield, OH
| Zip Code | % Graduates | vs State | vs National | |
| 1. | 45504 | 3.2% | 3.7%(-0.558)#436 | 4.3%(-1.10)#12,148 |
| 2. | 45506 | 2.3% | 3.7%(-1.37)#547 | 4.3%(-1.91)#15,209 |
| 3. | 45502 | 1.3% | 3.7%(-2.42)#693 | 4.3%(-2.96)#18,818 |
| 4. | 45503 | 0.96% | 3.7%(-2.75)#726 | 4.3%(-3.29)#19,782 |
1
Common Questions
What are the Top 3 Zip Codes with the Highest Percentage of Population with a Degree in Visual and Performing Arts in Springfield, OH?
Top 3 Zip Codes with the Highest Percentage of Population with a Degree in Visual and Performing Arts in Springfield, OH are:
What zip code has the Highest Percentage of Population with a Degree in Visual and Performing Arts in Springfield, OH?
45504 has the Highest Percentage of Population with a Degree in Visual and Performing Arts in Springfield, OH with 3.2%.
What is the Percentage of Population with a Degree in Visual and Performing Arts in Springfield, OH?
Percentage of Population with a Degree in Visual and Performing Arts in Springfield is 1.9%.
What is the Percentage of Population with a Degree in Visual and Performing Arts in Ohio?
Percentage of Population with a Degree in Visual and Performing Arts in Ohio is 3.7%.
What is the Percentage of Population with a Degree in Visual and Performing Arts in the United States?
Percentage of Population with a Degree in Visual and Performing Arts in the United States is 4.3%.