Zip Codes with the Highest Percentage of Population Employed in Computer, Engineering & Science in Springfield, OH
RELATED REPORTS & OPTIONS
Computer, Engineering & Science
Springfield
Compare Zip Codes
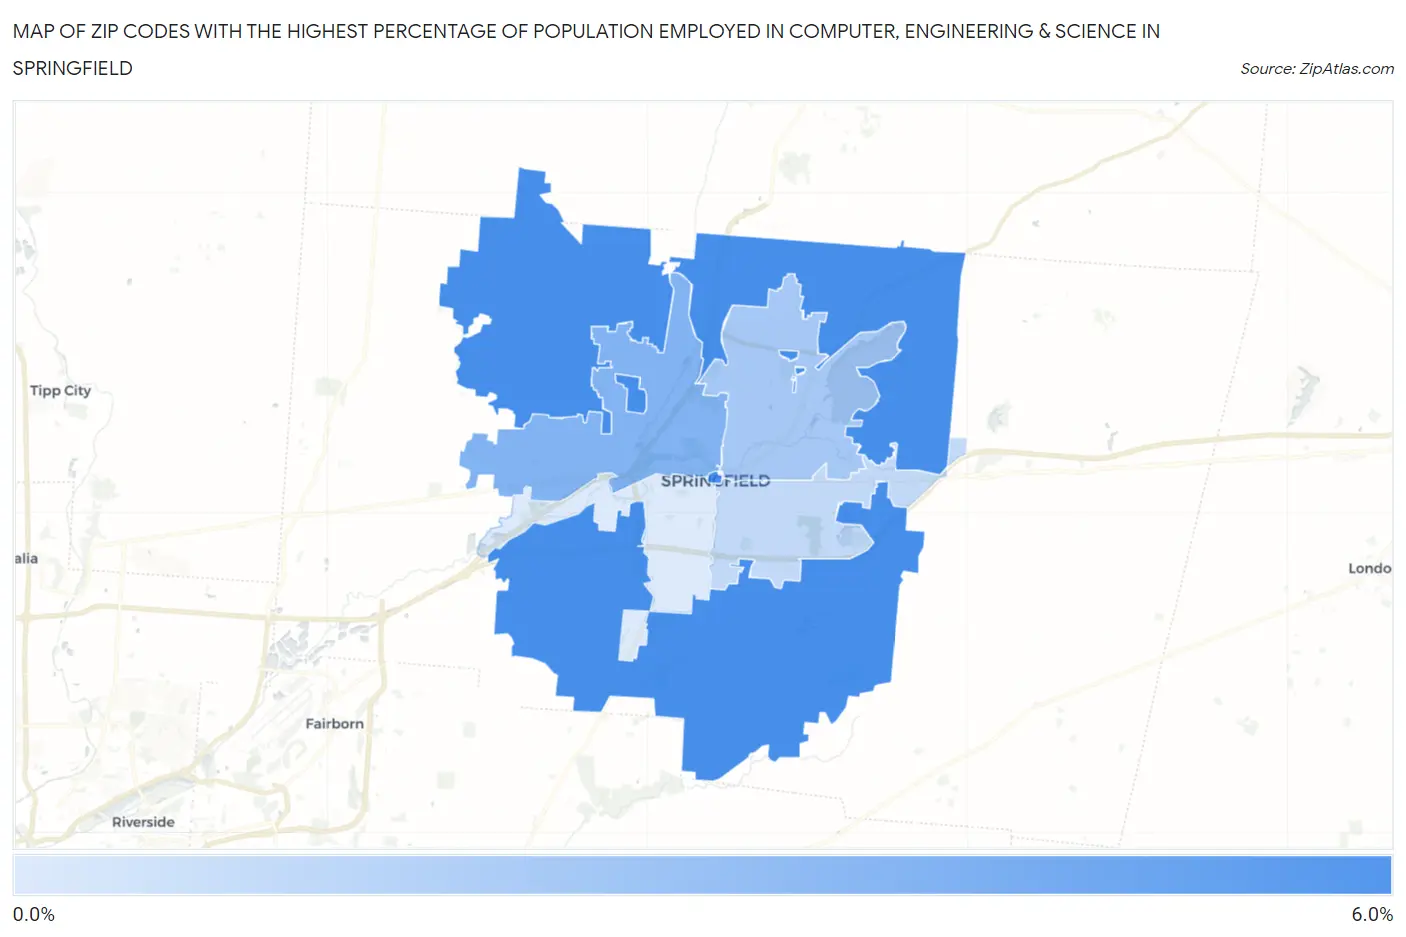
Map of Zip Codes with the Highest Percentage of Population Employed in Computer, Engineering & Science in Springfield
1.1%
5.7%
Zip Codes with the Highest Percentage of Population Employed in Computer, Engineering & Science in Springfield, OH
| Zip Code | % Employed | vs State | vs National | |
| 1. | 45502 | 5.7% | 6.1%(-0.351)#347 | 6.8%(-1.05)#9,516 |
| 2. | 45504 | 3.9% | 6.1%(-2.12)#555 | 6.8%(-2.82)#14,648 |
| 3. | 45503 | 2.8% | 6.1%(-3.28)#729 | 6.8%(-3.98)#18,899 |
| 4. | 45505 | 1.9% | 6.1%(-4.14)#868 | 6.8%(-4.84)#22,147 |
| 5. | 45506 | 1.1% | 6.1%(-4.97)#956 | 6.8%(-5.67)#24,788 |
1
Common Questions
What are the Top 3 Zip Codes with the Highest Percentage of Population Employed in Computer, Engineering & Science in Springfield, OH?
Top 3 Zip Codes with the Highest Percentage of Population Employed in Computer, Engineering & Science in Springfield, OH are:
What zip code has the Highest Percentage of Population Employed in Computer, Engineering & Science in Springfield, OH?
45502 has the Highest Percentage of Population Employed in Computer, Engineering & Science in Springfield, OH with 5.7%.
What is the Percentage of Population Employed in Computer, Engineering & Science in Springfield, OH?
Percentage of Population Employed in Computer, Engineering & Science in Springfield is 2.3%.
What is the Percentage of Population Employed in Computer, Engineering & Science in Ohio?
Percentage of Population Employed in Computer, Engineering & Science in Ohio is 6.1%.
What is the Percentage of Population Employed in Computer, Engineering & Science in the United States?
Percentage of Population Employed in Computer, Engineering & Science in the United States is 6.8%.