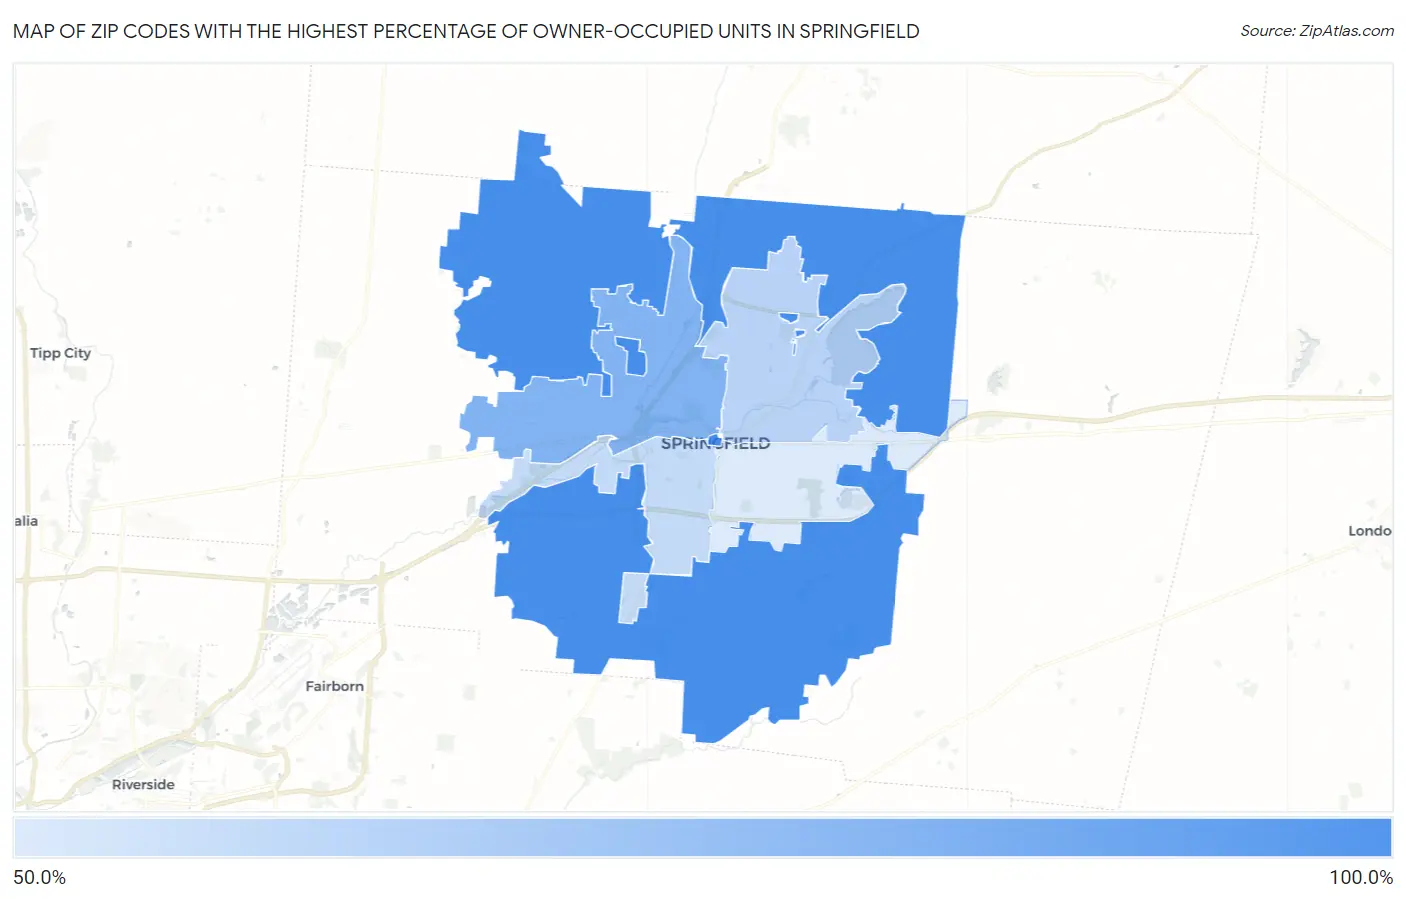
Zip Codes with the Highest Percentage of Owner-Occupied Units in Springfield, OH
RELATED REPORTS & OPTIONS
Highest Owner-Occupied
Springfield
Compare Zip Codes
Map of Zip Codes with the Highest Percentage of Owner-Occupied Units in Springfield
51.3%
87.6%
Zip Codes with the Highest Percentage of Owner-Occupied Units in Springfield, OH
| Zip Code | % Owner-Occupied | vs State | vs National | |
| 1. | 45502 | 87.6% | 66.8%(+20.8)#228 | 64.8%(+22.8)#7,324 |
| 2. | 45504 | 72.6% | 66.8%(+5.75)#776 | 64.8%(+7.75)#21,024 |
| 3. | 45503 | 59.5% | 66.8%(-7.36)#1,018 | 64.8%(-5.36)#27,576 |
| 4. | 45506 | 56.9% | 66.8%(-9.96)#1,040 | 64.8%(-7.95)#28,274 |
| 5. | 45505 | 51.3% | 66.8%(-15.5)#1,092 | 64.8%(-13.5)#29,486 |
1
Common Questions
What are the Top 3 Zip Codes with the Highest Percentage of Owner-Occupied Units in Springfield, OH?
Top 3 Zip Codes with the Highest Percentage of Owner-Occupied Units in Springfield, OH are:
What zip code has the Highest Percentage of Owner-Occupied Units in Springfield, OH?
45502 has the Highest Percentage of Owner-Occupied Units in Springfield, OH with 87.6%.
What is the Percentage of Owner-Occupied Units in Springfield, OH?
Percentage of Owner-Occupied Units in Springfield is 51.4%.
What is the Percentage of Owner-Occupied Units in Ohio?
Percentage of Owner-Occupied Units in Ohio is 66.8%.
What is the Percentage of Owner-Occupied Units in the United States?
Percentage of Owner-Occupied Units in the United States is 64.8%.