Zip Codes with the Highest Percentage of Population with a Degree in Visual and Performing Arts in North Las Vegas, NV
RELATED REPORTS & OPTIONS
Visual and Performing Arts
North Las Vegas
Compare Zip Codes
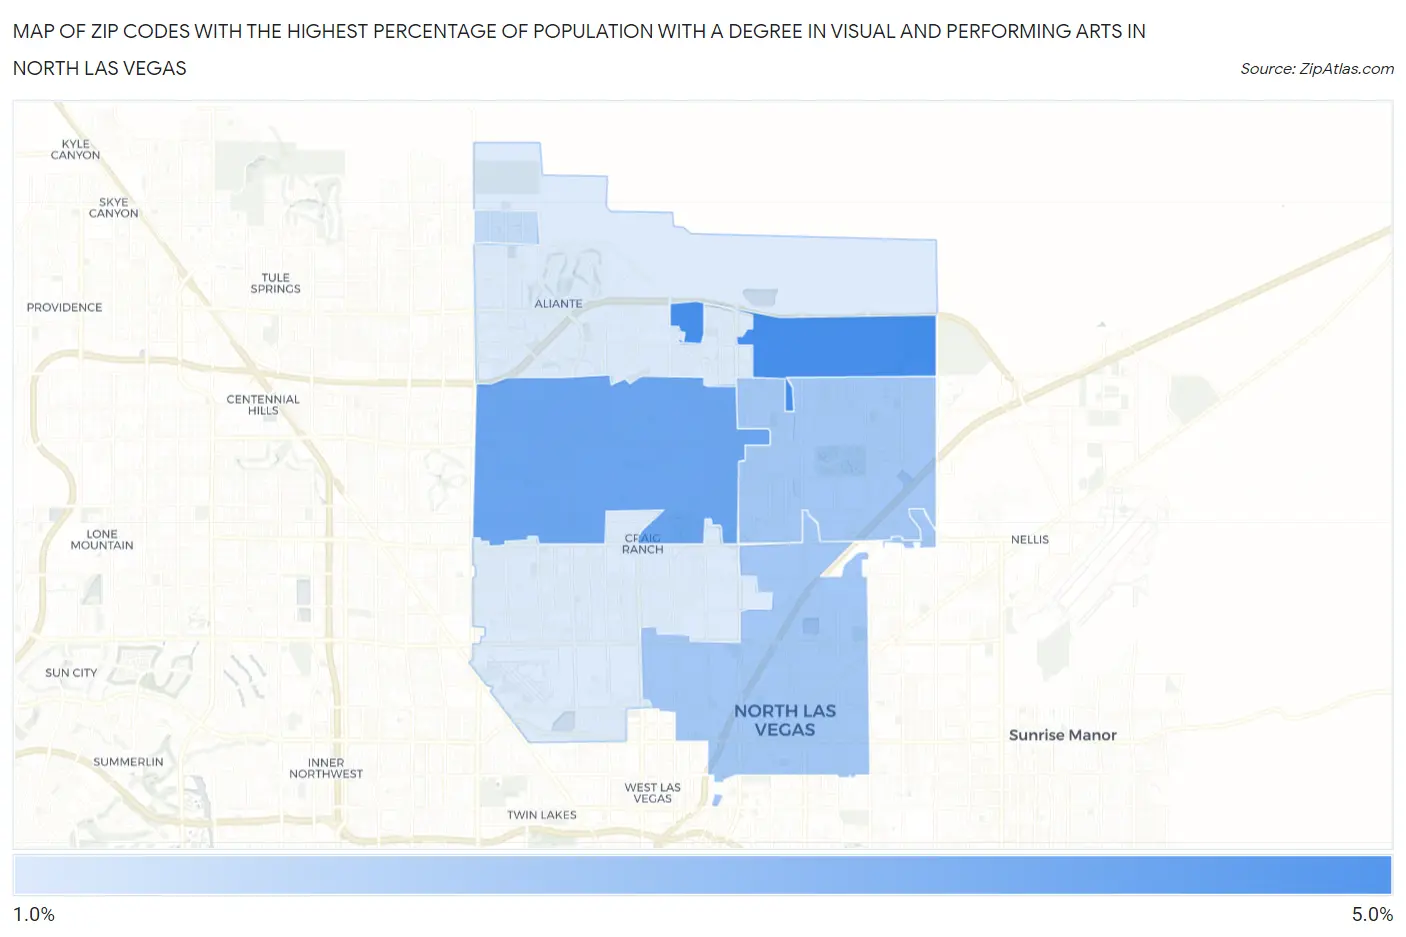
Map of Zip Codes with the Highest Percentage of Population with a Degree in Visual and Performing Arts in North Las Vegas
1.2%
4.3%
Zip Codes with the Highest Percentage of Population with a Degree in Visual and Performing Arts in North Las Vegas, NV
| Zip Code | % Graduates | vs State | vs National | |
| 1. | 89086 | 4.3% | 3.8%(+0.483)#41 | 4.3%(+0.024)#8,417 |
| 2. | 89031 | 3.5% | 3.8%(-0.287)#61 | 4.3%(-0.746)#10,858 |
| 3. | 89030 | 2.4% | 3.8%(-1.39)#86 | 4.3%(-1.85)#14,991 |
| 4. | 89081 | 2.4% | 3.8%(-1.42)#88 | 4.3%(-1.88)#15,086 |
| 5. | 89085 | 1.7% | 3.8%(-2.06)#97 | 4.3%(-2.52)#17,373 |
| 6. | 89032 | 1.2% | 3.8%(-2.56)#104 | 4.3%(-3.02)#18,984 |
| 7. | 89084 | 1.2% | 3.8%(-2.58)#105 | 4.3%(-3.04)#19,027 |
1
Common Questions
What are the Top 5 Zip Codes with the Highest Percentage of Population with a Degree in Visual and Performing Arts in North Las Vegas, NV?
Top 5 Zip Codes with the Highest Percentage of Population with a Degree in Visual and Performing Arts in North Las Vegas, NV are:
What zip code has the Highest Percentage of Population with a Degree in Visual and Performing Arts in North Las Vegas, NV?
89086 has the Highest Percentage of Population with a Degree in Visual and Performing Arts in North Las Vegas, NV with 4.3%.
What is the Percentage of Population with a Degree in Visual and Performing Arts in North Las Vegas, NV?
Percentage of Population with a Degree in Visual and Performing Arts in North Las Vegas is 2.3%.
What is the Percentage of Population with a Degree in Visual and Performing Arts in Nevada?
Percentage of Population with a Degree in Visual and Performing Arts in Nevada is 3.8%.
What is the Percentage of Population with a Degree in Visual and Performing Arts in the United States?
Percentage of Population with a Degree in Visual and Performing Arts in the United States is 4.3%.