Zip Codes with the Highest Percentage of Population Employed in Legal Services & Support in North Las Vegas, NV
RELATED REPORTS & OPTIONS
Legal Services & Support
North Las Vegas
Compare Zip Codes
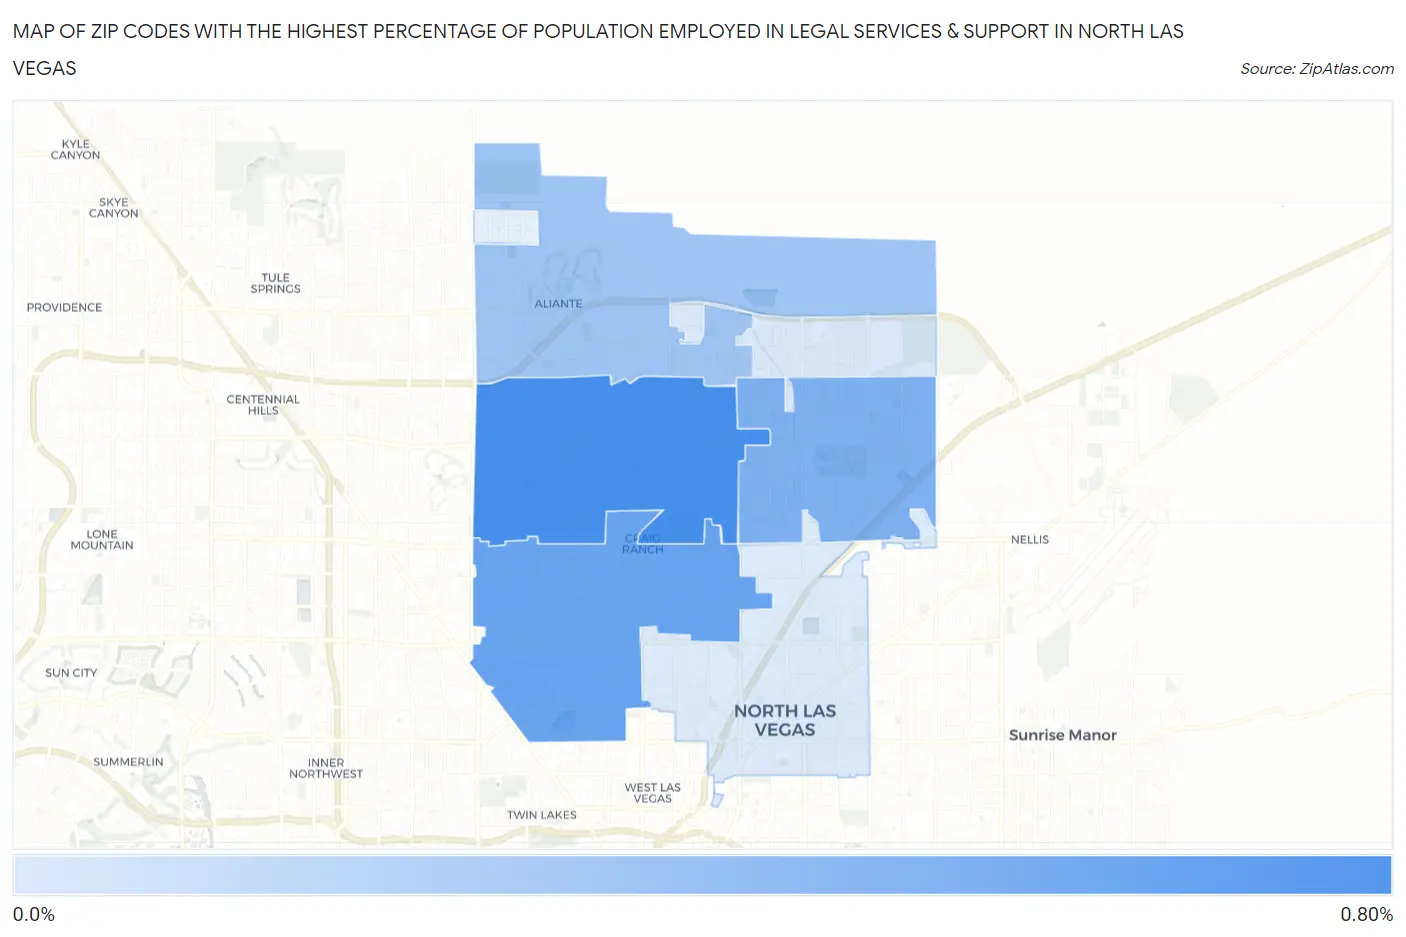
Map of Zip Codes with the Highest Percentage of Population Employed in Legal Services & Support in North Las Vegas
0.075%
0.76%
Zip Codes with the Highest Percentage of Population Employed in Legal Services & Support in North Las Vegas, NV
| Zip Code | % Employed | vs State | vs National | |
| 1. | 89031 | 0.76% | 0.99%(-0.229)#61 | 1.2%(-0.427)#9,853 |
| 2. | 89032 | 0.60% | 0.99%(-0.385)#73 | 1.2%(-0.582)#11,437 |
| 3. | 89081 | 0.50% | 0.99%(-0.486)#80 | 1.2%(-0.683)#12,621 |
| 4. | 89084 | 0.36% | 0.99%(-0.623)#89 | 1.2%(-0.821)#14,288 |
| 5. | 89086 | 0.090% | 0.99%(-0.896)#104 | 1.2%(-1.09)#17,204 |
| 6. | 89030 | 0.075% | 0.99%(-0.911)#106 | 1.2%(-1.11)#17,305 |
1
Common Questions
What are the Top 5 Zip Codes with the Highest Percentage of Population Employed in Legal Services & Support in North Las Vegas, NV?
Top 5 Zip Codes with the Highest Percentage of Population Employed in Legal Services & Support in North Las Vegas, NV are:
What zip code has the Highest Percentage of Population Employed in Legal Services & Support in North Las Vegas, NV?
89031 has the Highest Percentage of Population Employed in Legal Services & Support in North Las Vegas, NV with 0.76%.
What is the Percentage of Population Employed in Legal Services & Support in North Las Vegas, NV?
Percentage of Population Employed in Legal Services & Support in North Las Vegas is 0.48%.
What is the Percentage of Population Employed in Legal Services & Support in Nevada?
Percentage of Population Employed in Legal Services & Support in Nevada is 0.99%.
What is the Percentage of Population Employed in Legal Services & Support in the United States?
Percentage of Population Employed in Legal Services & Support in the United States is 1.2%.