Zip Codes with the Highest Percentage of Population Employed in Accommodation & Food Services in North Las Vegas, NV
RELATED REPORTS & OPTIONS
Accommodation & Food Services
North Las Vegas
Compare Zip Codes
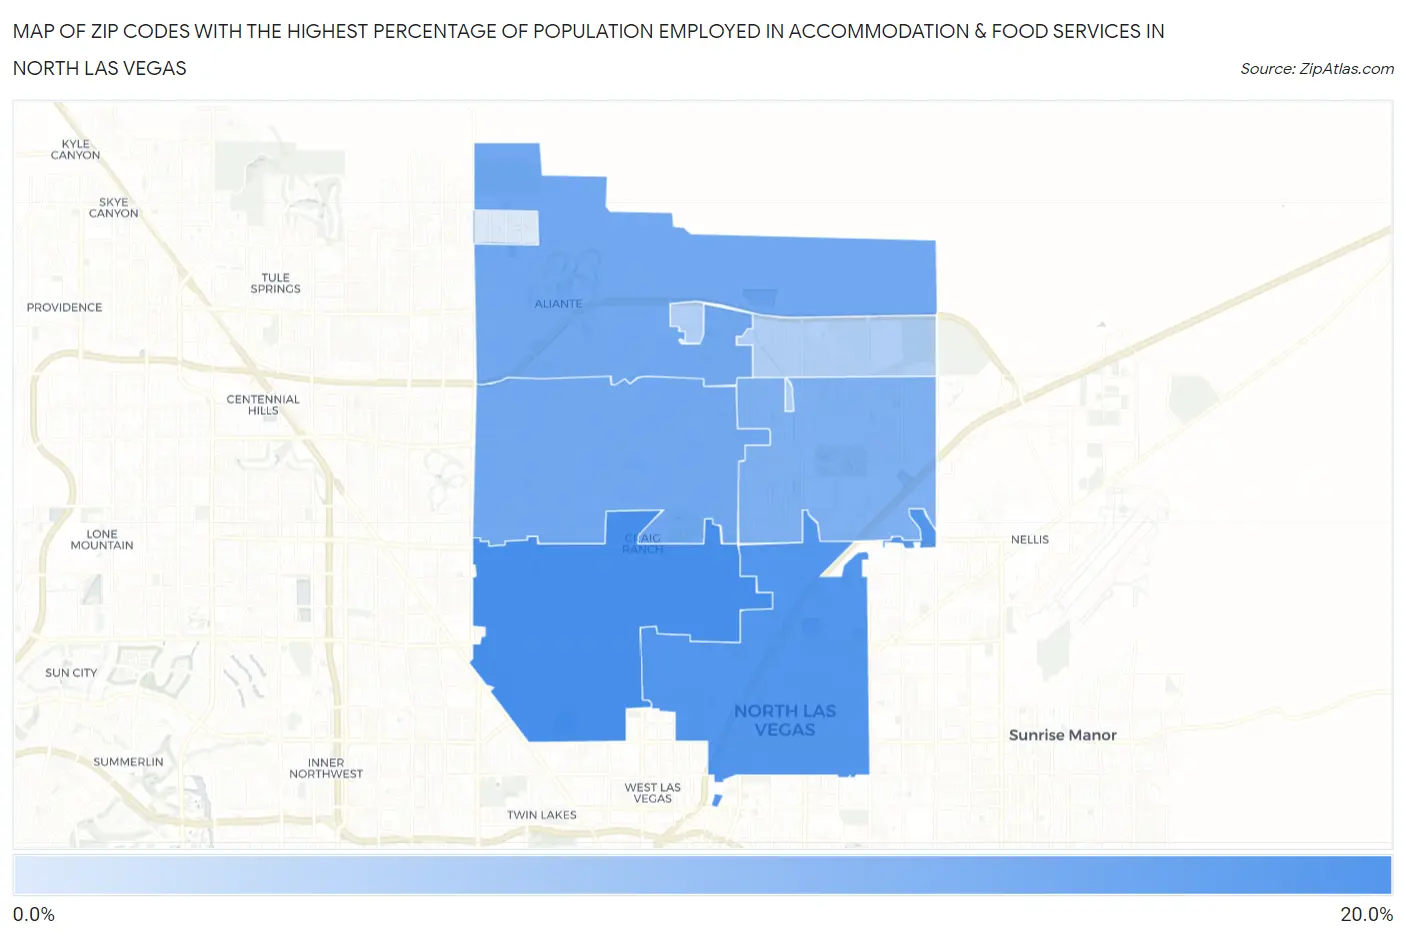
Map of Zip Codes with the Highest Percentage of Population Employed in Accommodation & Food Services in North Las Vegas
1.3%
17.5%
Zip Codes with the Highest Percentage of Population Employed in Accommodation & Food Services in North Las Vegas, NV
| Zip Code | % Employed | vs State | vs National | |
| 1. | 89032 | 17.5% | 13.3%(+4.23)#24 | 6.9%(+10.6)#1,183 |
| 2. | 89030 | 16.3% | 13.3%(+3.02)#33 | 6.9%(+9.41)#1,392 |
| 3. | 89084 | 12.7% | 13.3%(-0.522)#50 | 6.9%(+5.86)#2,464 |
| 4. | 89031 | 12.7% | 13.3%(-0.541)#51 | 6.9%(+5.84)#2,473 |
| 5. | 89081 | 11.3% | 13.3%(-1.96)#61 | 6.9%(+4.42)#3,318 |
| 6. | 89086 | 5.7% | 13.3%(-7.53)#114 | 6.9%(-1.14)#14,256 |
| 7. | 89085 | 1.3% | 13.3%(-11.9)#138 | 6.9%(-5.54)#26,741 |
1
Common Questions
What are the Top 5 Zip Codes with the Highest Percentage of Population Employed in Accommodation & Food Services in North Las Vegas, NV?
Top 5 Zip Codes with the Highest Percentage of Population Employed in Accommodation & Food Services in North Las Vegas, NV are:
What zip code has the Highest Percentage of Population Employed in Accommodation & Food Services in North Las Vegas, NV?
89032 has the Highest Percentage of Population Employed in Accommodation & Food Services in North Las Vegas, NV with 17.5%.
What is the Percentage of Population Employed in Accommodation & Food Services in North Las Vegas, NV?
Percentage of Population Employed in Accommodation & Food Services in North Las Vegas is 13.8%.
What is the Percentage of Population Employed in Accommodation & Food Services in Nevada?
Percentage of Population Employed in Accommodation & Food Services in Nevada is 13.3%.
What is the Percentage of Population Employed in Accommodation & Food Services in the United States?
Percentage of Population Employed in Accommodation & Food Services in the United States is 6.9%.