Zip Codes with the Highest Percentage of Households with Income Above $100,000 in Clifton, NJ
RELATED REPORTS & OPTIONS
Household Income | $100k+
Clifton
Compare Zip Codes
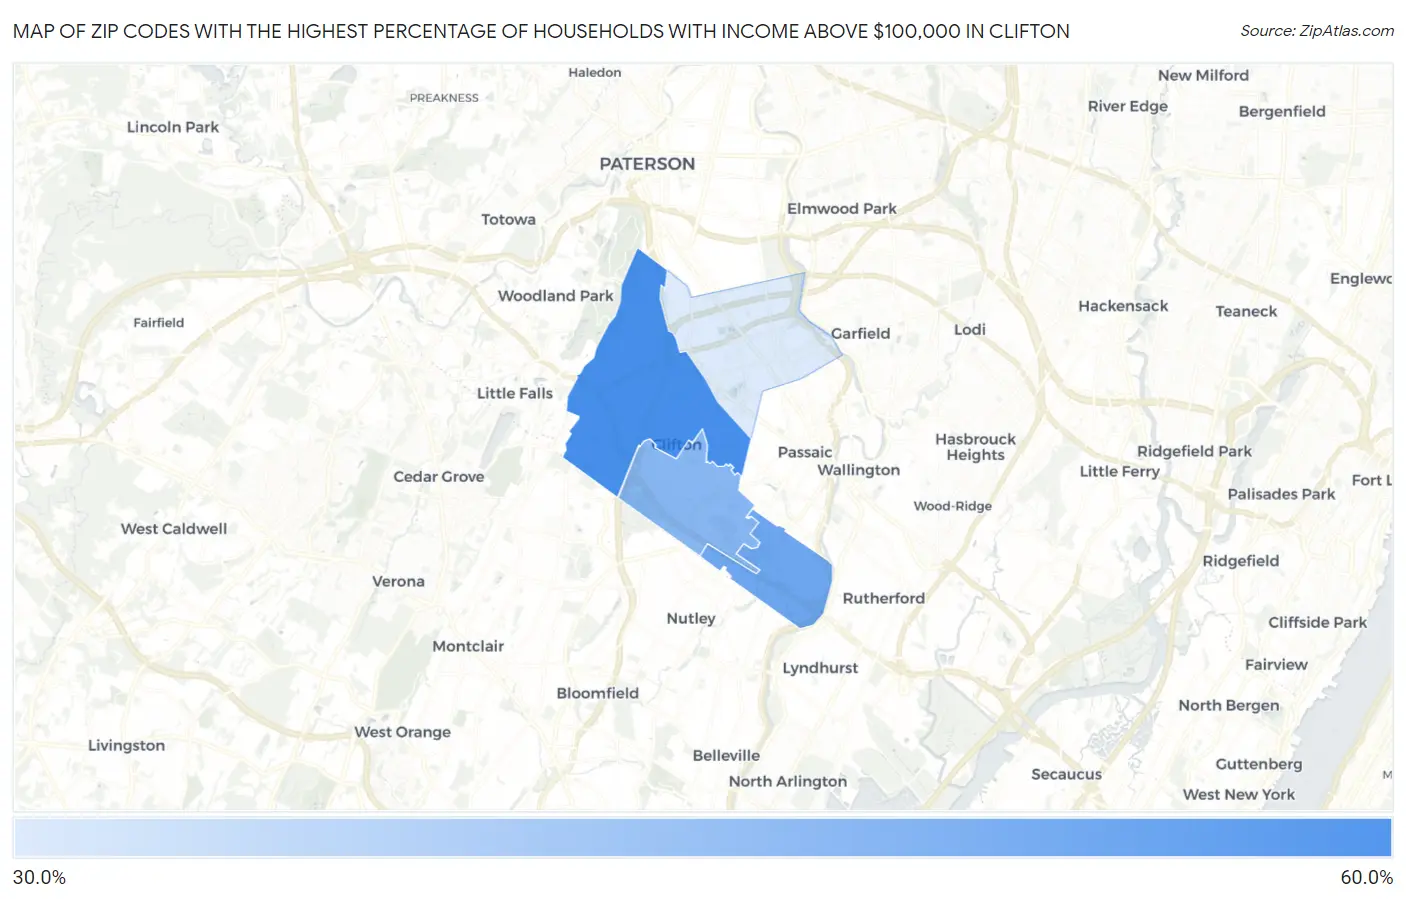
Map of Zip Codes with the Highest Percentage of Households with Income Above $100,000 in Clifton
36.9%
57.7%
Zip Codes with the Highest Percentage of Households with Income Above $100,000 in Clifton, NJ
| Zip Code | Households with Income > $100k | vs State | vs National | |
| 1. | 07013 | 57.7% | 48.7%(+9.00)#229 | 37.3%(+20.4)#2,826 |
| 2. | 07014 | 52.1% | 48.7%(+3.40)#313 | 37.3%(+14.8)#4,220 |
| 3. | 07012 | 48.3% | 48.7%(-0.400)#350 | 37.3%(+11.0)#5,387 |
| 4. | 07011 | 36.9% | 48.7%(-11.8)#474 | 37.3%(-0.400)#10,614 |
1
Common Questions
What are the Top 3 Zip Codes with the Highest Percentage of Households with Income Above $100,000 in Clifton, NJ?
Top 3 Zip Codes with the Highest Percentage of Households with Income Above $100,000 in Clifton, NJ are:
What zip code has the Highest Percentage of Households with Income Above $100,000 in Clifton, NJ?
07013 has the Highest Percentage of Households with Income Above $100,000 in Clifton, NJ with 57.7%.
What is the Percentage of Households with Income Above $100,000 in Clifton, NJ?
Percentage of Households with Income Above $100,000 in Clifton is 47.2%.
What is the Percentage of Households with Income Above $100,000 in New Jersey?
Percentage of Households with Income Above $100,000 in New Jersey is 48.7%.
What is the Percentage of Households with Income Above $100,000 in the United States?
Percentage of Households with Income Above $100,000 in the United States is 37.3%.