Zip Codes with the Highest Percentage of Population Employed in Health Diagnosing & Treating in Clifton, NJ
RELATED REPORTS & OPTIONS
Health Diagnosing & Treating
Clifton
Compare Zip Codes
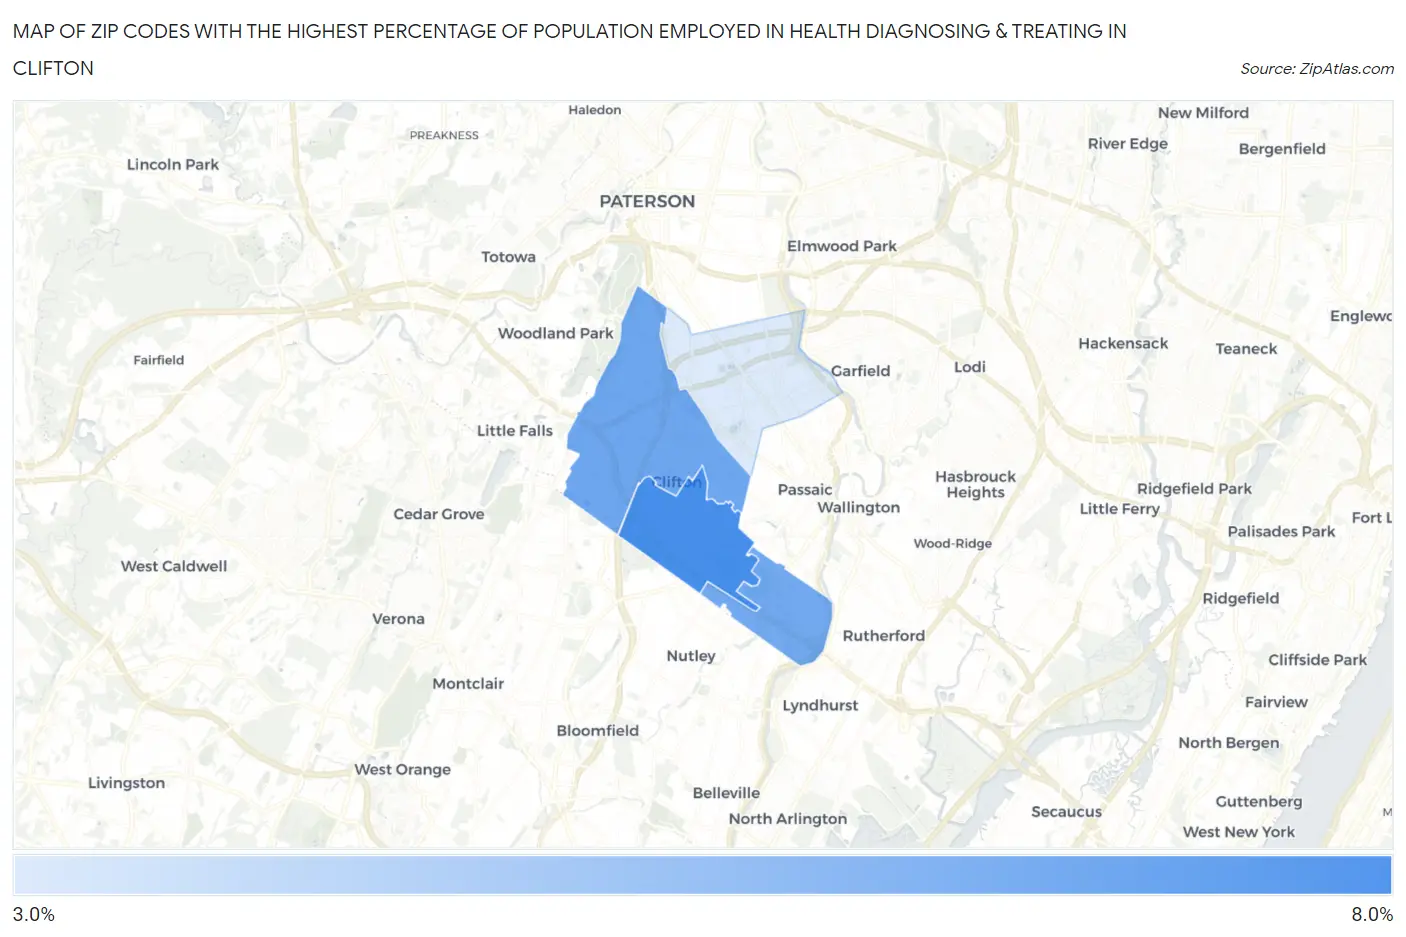
Map of Zip Codes with the Highest Percentage of Population Employed in Health Diagnosing & Treating in Clifton
3.5%
7.8%
Zip Codes with the Highest Percentage of Population Employed in Health Diagnosing & Treating in Clifton, NJ
| Zip Code | % Employed | vs State | vs National | |
| 1. | 07012 | 7.8% | 6.2%(+1.52)#153 | 6.2%(+1.51)#8,104 |
| 2. | 07013 | 6.6% | 6.2%(+0.374)#245 | 6.2%(+0.371)#11,600 |
| 3. | 07014 | 6.5% | 6.2%(+0.250)#265 | 6.2%(+0.246)#12,059 |
| 4. | 07011 | 3.5% | 6.2%(-2.76)#490 | 6.2%(-2.76)#22,948 |
1
Common Questions
What are the Top 3 Zip Codes with the Highest Percentage of Population Employed in Health Diagnosing & Treating in Clifton, NJ?
Top 3 Zip Codes with the Highest Percentage of Population Employed in Health Diagnosing & Treating in Clifton, NJ are:
What zip code has the Highest Percentage of Population Employed in Health Diagnosing & Treating in Clifton, NJ?
07012 has the Highest Percentage of Population Employed in Health Diagnosing & Treating in Clifton, NJ with 7.8%.
What is the Percentage of Population Employed in Health Diagnosing & Treating in Clifton, NJ?
Percentage of Population Employed in Health Diagnosing & Treating in Clifton is 5.4%.
What is the Percentage of Population Employed in Health Diagnosing & Treating in New Jersey?
Percentage of Population Employed in Health Diagnosing & Treating in New Jersey is 6.2%.
What is the Percentage of Population Employed in Health Diagnosing & Treating in the United States?
Percentage of Population Employed in Health Diagnosing & Treating in the United States is 6.2%.