Zip Codes with the Highest Percentage of Households with Income Below $10,000 in Clifton, NJ
RELATED REPORTS & OPTIONS
Household Income | $0-10k
Clifton
Compare Zip Codes
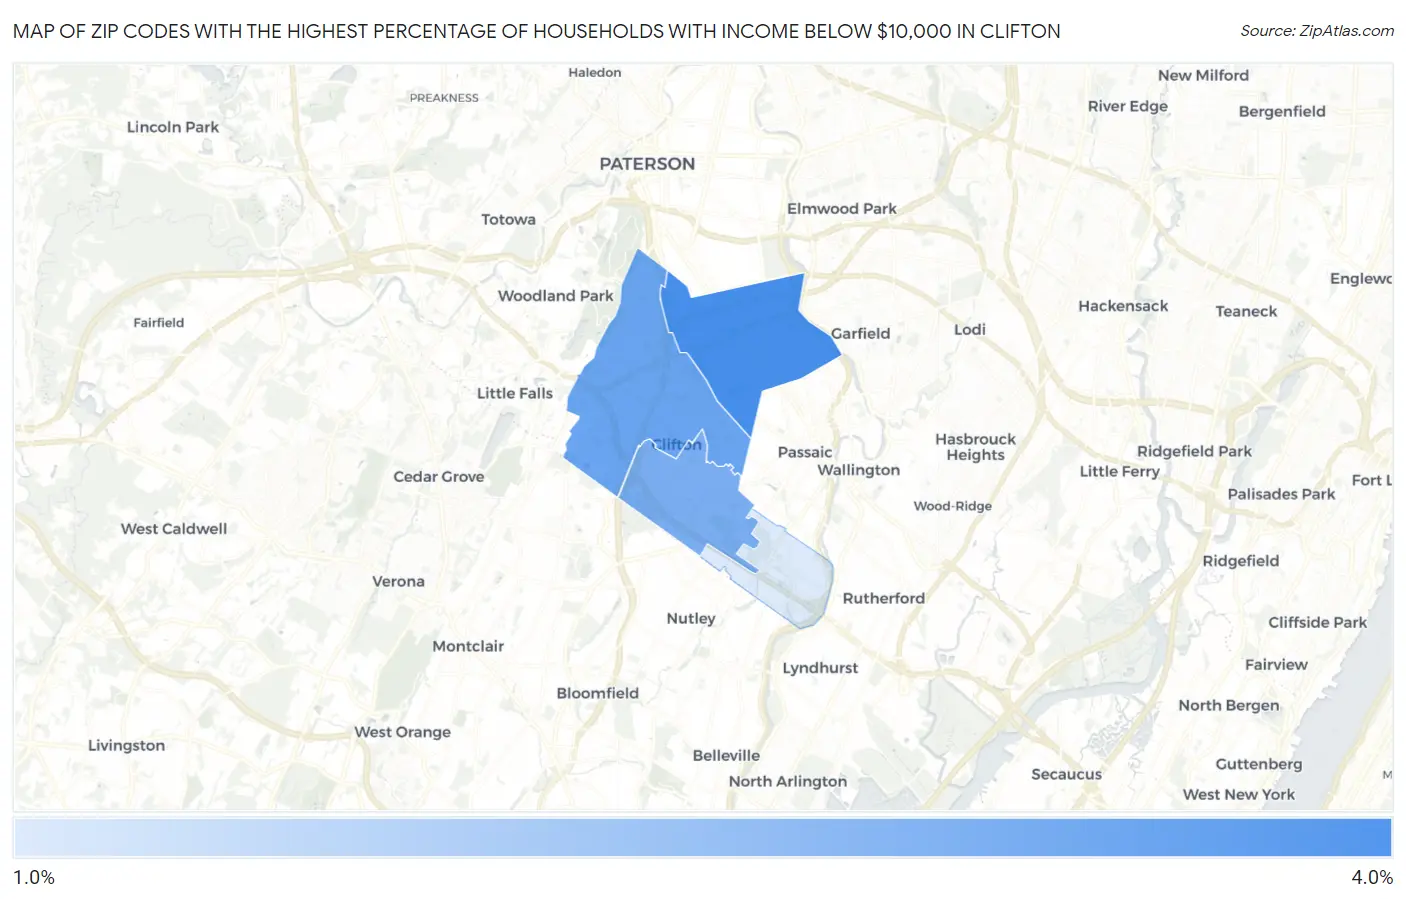
Map of Zip Codes with the Highest Percentage of Households with Income Below $10,000 in Clifton
1.4%
3.5%
Zip Codes with the Highest Percentage of Households with Income Below $10,000 in Clifton, NJ
| Zip Code | Households with Income < $10k | vs State | vs National | |
| 1. | 07011 | 3.5% | 4.1%(-0.600)#209 | 4.9%(-1.40)#17,211 |
| 2. | 07013 | 3.0% | 4.1%(-1.10)#247 | 4.9%(-1.90)#19,356 |
| 3. | 07012 | 2.8% | 4.1%(-1.30)#282 | 4.9%(-2.10)#20,355 |
| 4. | 07014 | 1.4% | 4.1%(-2.70)#455 | 4.9%(-3.50)#25,822 |
1
Common Questions
What are the Top 3 Zip Codes with the Highest Percentage of Households with Income Below $10,000 in Clifton, NJ?
Top 3 Zip Codes with the Highest Percentage of Households with Income Below $10,000 in Clifton, NJ are:
What zip code has the Highest Percentage of Households with Income Below $10,000 in Clifton, NJ?
07011 has the Highest Percentage of Households with Income Below $10,000 in Clifton, NJ with 3.5%.
What is the Percentage of Households with Income Below $10,000 in Clifton, NJ?
Percentage of Households with Income Below $10,000 in Clifton is 3.1%.
What is the Percentage of Households with Income Below $10,000 in New Jersey?
Percentage of Households with Income Below $10,000 in New Jersey is 4.1%.
What is the Percentage of Households with Income Below $10,000 in the United States?
Percentage of Households with Income Below $10,000 in the United States is 4.9%.